Abstract
The purposes of this study were to determine content uniformity of phenolics in the St John's Wort (SJW) supplements, and to demonstrate how variations in the product matrices affect their absorption and efflux. LC and LC-MS/MS methods were used to determine the phenolic contents of twelve different products purchased locally or from the internet. Three representative extracts were further submitted to Caco-2 cell transport experiment and transport of rutin, hyperoside, and isoquercitrin were evaluated. The results indicated that twelve different products displayed twelve different HPLC fingerprints, but all products contained the following major compounds: rutin, hyperoside, isoquercitrin, quercitrin, quercetin, and amentoflavone. The content uniformity of these major compounds was poor across products, with the smallest difference in the amounts of amentoflavone (2.6 folds) and largest difference in that of isoquercitrin (28.8 folds). The Caco-2 experiments indicated transport of rutin was vectorial, with the permeabilities varied about 2 folds in both direction of transport. The vectorial permeabilities of hyperoside and isoquercitrin were similarly different. Use of efflux transporter inhibitors studies suggested that MRP2 was involved in isoquercitrin's efflux and the product matrix affected the extent of its efflux. In conclusion, different SJW supplements had highly variable contents of phenolics, and the variability in product matrix and phytochemical compositions affected the permeabilities of key phenolics across the Caco-2 monolayers, which may further impact their bioavailabilities. Therefore, standardization will be necessary to ensure safe and efficacious use of supplements such as SJW.
Keywords: St John's Wort, Dietary Supplement, Standardization, Caco-2 cell model, Bioavailability, MRP
Introduction
Depression is a common but serious medical condition that physically and emotionally affects millions worldwide, resulting in loss of motivation, disability, physical or emotional impairment, and an increased risk of death from suicide (1-3). Although pharmaceutical industries offer several approved drugs, many depression patients experience only slight improvement, suffer from negative side effects, or refuse to take medicinal treatment (4, 5). As a consequence, an increasing number of patients are relying on alternative medicinal therapies.
The extract of St. John's Wort (SJW, Hypericum perforatum L.) is a popular herbal dietary supplement intended to treat mild to moderate symptoms of depression (6). Clinical trials have shown SJW to be superior to placebo when treating major depression and equally effective as conventional antidepressants but with fewer side effects (7, 8). Although the mechanism of SJW's efficacy remains unknown, its pharmacological effects are attributed to its phytochemical content. Recent studies suggested that its apparent antidepressant effects were due to the presence of phenolics (8, 9). In any rate, SJW extract has become a top ten selling herbal supplement and is produced by over fifteen different manufacturers (10).
Due to its apparent commercial successes, many manufacturers have rushed in to produce, sell, and market SJW products. Because SJW is defined as a dietary supplement, these products are sold without first demonstrating safety and efficacy as normally required for FDA-approved drugs. This practice may be inevitably associated with inconsistent quality standards. Therefore, it is entirely possible that one brand SJW supplement may contain very different amounts and proportions of phytochemical compounds as opposed to another. This could be a serious problem because, despite its supposed benefits, SJW may cause adverse side-effects as well as interact with other drugs. For example, SJW was shown to reduce the effectiveness of oral contraceptives and reducing the effectiveness of other important drugs, (e.g. cyclosporine and digoxin), with narrow therapeutic indexes (11). Therefore, without an established standard or a set of standards, it would be difficult to determine which product is safe and effective to use and which product will cause serious side effects and should be pulled out of the market place.
Establishment of quality control criteria based on phytochemical components of a SJW extract can be done with relatively ease. The more difficult task is to establish a universal standard that every manufacturer can agree upon, as was done routinely for FDA-regulated drug products. This is because there is a lack of scientific evidence that will demonstrate one set of standard will produce a superior product than the other. Moreover, it is difficult to determine which ingredients in an herbal supplement were responsible for the reported beneficial or side effects. This lack of direct scientific evidence was partially responsible for the lack of government regulation as regulatory agency cannot determine the best criteria that can be used to regulate a product.
The current investigation represents a new approach to the problem. Conventionally, a product if often defined by its phytochemical composition but it is difficult to define how one may be different from another biologically. In this paper, we showed not only how products differed phytochemically but also biopharmaceutically with respect to absorption and efflux, the first steps in the bioavailability continuum.
We have chosen LC fingerprinting combined with LC-MS/MS to define products phytochemically because more than 12 compounds with documented biological activities have been identified in SJW (12). The LC fingerprinting technique is a state-of-the-art and powerful approach to identify and quantify phytochemicals in an herbal product, and LC-MS/MS is very helpful in confirming a compound's identity. We have chosen the Caco-2 model system to determine the absorption of phytochemicals present in SJW because the model system is recognized by FDA as a validated model to predict drug absorption in humans (13).
Materials and Methods
SJW Products and Chemical Reagents
Twelve herbal supplements were bought from national chain stores located in Houston, Texas and from the internet (Table 1). Rutin, hyperoside, isoquercitrin, quercitrin, quercetin, and amentoflavone were obtained from ChromaDex (Irvine, CA, USA). Hank's balance salt solution was purchased from Sigma Chemical Co (St. Louis, MO). Solvents were HPLC grade and purchased from VWR (Suwanee, GA, USA). Other chemicals were used as received.
Table 1. St John's Wort Product Information.
| Product No | Manufacture | Vendor | Claimed hypericin Content (mg/daily dose) |
Daily dose (capsules or tablets per day) |
Lot No. |
|---|---|---|---|---|---|
| 1 | Sundown | Walgreen | 2.7 | 6 | 4503101A |
| 2 | GNC Nature's Fingerprint | GNC | NC* | 3 | 2297EH1942 |
| 3 | Now | iherb.com | 2.7 | 3 | NF# |
| 4 | CVS pharmacy | CVS | 2.7 | 3 | 6671020 |
| 5 | Kroger | Kroger | 2.7 | 3 | 7CBO669 |
| 6 | Whole health | wholehealthproduct.com | 2.7 | 1 | 7H719-0 |
| 7 | Nature Made | Walgreen | 2.7 | 6 | RD10334 |
| 8 | Nature's Resource | CVS | 2.7 | 2 | QF10003 |
| 9 | GNC herbal plus standardized | GNC | 2.7 | 3 | 1926EH1945 |
| 10 | Safe way select | Randalls | 2.7 | 3 | 6HA0900 |
| 11 | Nature's way | Randalls | NC | 4 | NF# |
| 12 | Puritan's Pride | puritan.com | 2.7 | 3 | 168323-08 |
NC= No claim;
NF= not found
HPLC Conditions for Fingerprint Analysis
The HPLC conditions were as follows: Agilent 1050 running the ChemStation software with a 759 A absorbance detector (Applied Biosystem, Foster city, CA, US); column, Dikma Diamonsil C18, 5 μm, 250 × 4.6 mm (Dikma Technologies, Beijing, China); mobile phase A (MPA), acetonitrile, mobile phase B 0.1% formic acid in water; elution gradient, 0 to 15 min, 10 % MPA, 10 - 40 min 10 - 30 % MPA, 40 - 50 min 30 - 60% MPA, 50 - 60 min 60 - 90% MPA, 60 - 65 min, 90 - 10 % MPA, 65 - 70 min, 10% MPA; detect wavelength, 254 nm; flow rate, 1 mL/min; and injection volume, 250 μL. The retention times for rutin, hyperoside, isoquercitrin, quercitrin, quercetin, and amentoflavone were 21.00, 23.95, 25.28, 36.48, 46.48, and 48.33 min respectively.
Identification of Selected Compounds Present in SJW Extracts with UPLC-MS/MS
The UPLC conditions were as follows: system, Waters Acquity™ with PDA detector; column, Acquity UPLC BEH C18 column (50 × 2.1 mm I.D. 1.7 μm; Waters, Milford, MA, USA); mobile phase A (MPA), 0.1% formic acid in water; mobile phase B (MPB), 100% acetonitrile; elution gradient,0 - 0.5 min, 0 % MPB, 0.5 - 0.7 min, 0 - 10% MPB, 0.7 - 3.0 min, 10 % MPB, 3.0 - 4.0 min, 10 - 90 % MPB, 4.0 - 4.5 min, 90 % MPB, 4.5 - 5.0 min, 90 - 0 % MPB, 5.0 - 5.5 min, 0 % MPB. An ABI 3200 Q-TRAP triple quadruple mass spectrometer (Applied Biosystems/MDS SCIEX, CA, USA) equipped with a TurboIonspray source operating in negative ion mode was used to perform the MS/MS analysis.
Sample Preparation from Extracts and Analysis with HPLC
An amount equal to daily dose of each of the twelve products was suspended in equivalent volumes (60 ml) of MeOH/H2O = 1:1 and sonicated three times at room temperature (22 °C), each for a period of one hour. The supernatant was removed following each sonication and the supernatant were combined to afford 12 extracts. The original extracts (1 ml of each) were diluted 8 times by 20% MeOH in water, and 200 μL of each of the diluted samples was injected for the HPLC analysis, and 10 μL of some diluted samples were injected in UPLC-MS/MS for phytochemical identification and measurements. Prunetin was selected as internal standard.
HPLC Standard Curves and Quality Control Sample Preparation
The standard curve for HPLC analysis was prepared in 20 % MeOH from the stock solution (10mg/ml, in DMSO/EtOH=1:4) of each of the individual standard compounds. Predetermined amounts of the stock solutions were mixed in 20% MeOH, which was further diluted by the same solvent to afford the standard curve samples. The standard curves ranged from 16.6 to 133.3 μg/ml for both rutin and quercetin, from 5.0 to 40.0 μg/ml for hyperoside, from 6.6 to 53.0μg/ml for isoquercitrin, and from 1.6 to 13.3 μg/ml for amentoflavone, and they produced correlation coefficient values > 0.99 for all six compounds. Prunetin was also selected as internal standard. A 10 μl of 0.25 mM prunetin in acetonitrile was added to 300 μl of samples. The injection volume was 200 μl. The quality control samples were prepared by mixing rutin, hyperoside, and isoquercitrin in 20 % MeOH from stock solution at low, medium and high concentration for method validation study.
Extract Sample Stability
Portions of the diluted extracts (200 μl) from product 1, 2, and 4extracts were injected in HPLC. Additional portions of the same extracts (200 μl) were then kept at room temperature for 24 hours, and injected again at day 2. The relative peak areas of the six identified compounds were compared to evaluate sample stability. The result indicated that there were no statistic differences (p > 0.05) between these two injections for all of six compounds.
Extraction Reproducibility
Three daily doses of product 1 were extracted five times according to the normal extraction procedure described previously. Samples were analyzed by HPLC. The relative peak areas of the six compounds did not change significantly (p > 0.05) suggesting the extraction procedure was reproducible.
Selection of Marker Compounds for Transport Study
Three key components of SJW rutin, hyperoside, and isoquercitrin were selected as transport markers due to their high contents and potential biological benefits (e.g. antidepressant) (14, 15). Moreover, they are homologous compounds and the transport result may reveal structure transport relationships. Product 1, 2, and 4 were selected as the study products because they are the most popular brands in market. The study concentrations of these three compounds used in the current study ranged from 0.3 μM to 9.7 μM (Table 2).
Table 2. Concentration of the Marker Compounds in Caco-2 Experiments.
| Product | Rutin (μM) | Hyperoside (μM) | Isoquercitrin (μM) |
|---|---|---|---|
| 1 | 9.70 | 5.00 | 6.97 |
| 2 | 3.32 | 3.20 | 0.30 |
| 4 | 4.30 | 3.35 | 2.64 |
UPLC-MS/MS Analysis of Rutin, Hyperoside, and Isoquercitrin
The UPLC conditions were described previously in UPLC-MS/MS compounds identification section. The MS quantitative analysis for rutin, hyperoside, and isoquercitrin in Caco-2 transport study conditions were: negative mode, ionspray voltage, -4.5 kV; ion source temperature, 650 °C; nebulizer gas (gas 1), nitrogen, 40 psi; turbo gas (gas 2), nitrogen 60 psi; curtain gas. The quantification was performed by using multiple reactions monitoring (MRM) method with ion pair transition to monitor each analyte. Unit mass resolution was set in both mass-resolving quadruple Q1 and Q3. Compound dependent parameters were in Table 3.
Table 3. Compounds Dependent Parameters in UPLC-MS Analysis.
| Compound | Q1 (m/z) | Q3 (m/z) | DP (v) |
CEP (v) |
CE (v) |
CXP (v) |
Qwell time (msec) |
|---|---|---|---|---|---|---|---|
| Rutin | 609.0 | 300.8 | -73 | -31 | -49 | -2 | 100 |
| Hyperoside | 463.0 | 300.8 | -58 | -31 | -33 | -3 | 100 |
| isoquercitrin | 463.3 | 300.3 | -61 | -57 | -35 | -2 | 100 |
| Kaempferol-3-rutinoside | 593.3 | 284.6 | -50 | -27 | -49 | -2 | 100 |
| Formononetin | 267.1 | 252.1 | -47 | -23 | -26 | -2 | 100 |
Transport Study Sample Preparation and Stability
A 4 ml portion of the original extract, as prepared above, was dried under N2. The dried residues were dissolved in 60 μl of DMSO/EtOH = 1: 4, and the resulting solution was diluted 1000 times by HBSS (pH = 6.8) to afford the donor solution. Pure rutin, hyperoside, isoquercitrin, and kaempferol-3-rutinoside were prepared as 10 mM (50 mM for Kaempferol-3-rutinoside) stock solutions in DMSO/EtOH = 1: 4 and then diluted 1000 times by HBSS for use as the donor solution in a Caco-2 experiment. The experimental solutions were kept in 37 °C water bath and samples were taken at 0, 1, 2, 4, and 6 hour for UPLC-MS/MS analysis. The relative peak area of rutin, hyperoside, and isoquercitrin were compared, and there was no statistical difference as a function of time, indicating that these three compounds in samples were stable.
Standard Curves and Quality Control Samples for Transport Study
The standard curves for UPLC-MS/MS analysis of rutin, hyperoside, and isoquercitrin were prepared in HBSS (pH, 6.8) from 10 mM stock solution (DMSO/EtOH = 1:4) at 10, 5, 2.5, 1.25, 0.625, 0.3125, 0.156, 0.078, 0.039, 0.0195, 0.00975, 0.00488, and 0.00244 μM. Formononetin was used as the internal standard, and 25 μL of 10 μM formononetin in acetonitrile was added to 500 μL of samples for UPLC-MS/MS analysis (injection volume: 10 μL). The quality control samples were prepared by mixing rutin, hyperoside, and isoquercitrin from stock solution in HBSS (pH, 6.8).
Caco-2 Cell Culture
Caco-2 TC7 cells were originally a kind gift of Prof. Monique Rousset of INSERM U178 (Villejuif, France). The Caco-2 cells were routinely performed in our lab for more than a decade. Briefly, a cell monolayer was prepared by seeding 400,000 cells per insert (Nunc, surface area 4.2 cm2, 3 μm pore size). Cells were maintained at 37 °C under 90% humidity and 5% CO2. Monolayers were used between 19-22 days after seeding. The integrity of each monolayer was checked by measuring the transepithelial electrical resistance (Millicell ERS®) before the experiment. The normal TEER values obtained were between 500 -750 Ω·cm2. Cell monolayers with TEER values less than 400 Ω·cm2 were not used. Hank's balanced salt solution (HBSS) (9.8g/ml) supplemented with NaHCO3 (0.37 g/L), HEPES (5.96 g/L), and glucose (3.5 g/L) was used for all experiments after adjusting pH to a desired value. Cells were used as passages 41 - 49.
Caco-2 Experiment
The experiment protocol was from those described previously (16). Briefly, the testing solution with appropriate concentrations of product extract or pure compound was loaded onto the apical or basolateral (donor) side. Five donor samples (500 μL) and five receiver samples (from basolateral or apical side respectively) (500 μL) were taken at 0, 1, 2, 3, and 4 hours followed by the addition of 500 μL of fresh donor solution to the donor side or 500 μL of fresh buffer to the receiver side. The samples were then analyzed by UPLC-MS/MS. Inhibitors were added only at apical side. The apparent permeability coefficient (P) was determined by the equation:
P = (dQ/dt)/(A × Co)
where dQ/dt is the drug permeation rate (mmol/second), A is the surface area of the epithelium (cm2) and Co is the initial concentration in the donor compartment at time 0 (mmol).
Statistical analysis
One-way ANOVA or a Student's t-test (Microsoft Excel) was used to analyze the data. The prior level of significance was set at 5%, or P < 0.05. Values are expressed as mean ± S.D.
Method Validation for HPLC and UPLC-MS/MS Quantitative Analysis
The interday and intraday precisions for HPLC and UPLC-MS/MS analysis were determined by injecting the quality control samples at low, medium and high concentrations for rutin, hyperoside and isoquercitrin in the first day and in each of the following two days. The quality control samples were prepared as described previously. The validation results, which were summarized in Table 4, revealed that the precision and accuracy values for HPLC and UPLC-MS/MS quantitative analysis were well within the acceptance range (less than 15%).
Table 4. Intra-day and Inter-day Precision and Accuracy for Rutin, Hyperoside, and Isoquercitrin.
| Analyte | HPLC | UPLC-MS/MS | ||||||||
|---|---|---|---|---|---|---|---|---|---|---|
| Inter-day (n=5) | Intra-day(n=5) | Inter-day(n=5) | Intra-day(n=5) | |||||||
| Concentration (μg/ml) |
Accuracy (Bias, %) |
Precision (CV, %) |
Accuracy (Bias, %) |
Precision (CV, %) |
Concentration (μM) |
Accuracy (Bias, %) |
Precision (CV, %) |
Accuracy (Bias, %) |
Precision (CV, %) |
|
| Rutin | 66.6 | 106.2 | 0.7 | 104.0 | 1.2 | 10 | 101.6 | 3.4 | 93.0 | 9.6 |
| 40.0 | 101.2 | 1.1 | 100.7 | 0.6 | 0.3125 | 97.4 | 2.6 | 103.3 | 9.5 | |
| 16.6 | 107.8 | 0.7 | 110.5 | 4.3 | 0.00488 | 97.1 | 4.4 | 98.9 | 9.8 | |
| Hyperoside | 32.0 | 109.1 | 0.4 | 106.7 | 1.3 | 10 | 99.7 | 4.1 | 90.2 | 7.5 |
| 12.0 | 103.0 | 1.1 | 102.1 | 0.6 | 0.3125 | 94.9 | 1.5 | 91.7 | 8.1 | |
| 6.0 | 109.8 | 0.8 | 115.2 | 7.5 | 0.00488 | 97.3 | 9.8 | 102.3 | 9.3 | |
| Isoquercitrin | 40.0 | 102.8 | 0.9 | 104.9 | 1.3 | 10 | 103.3 | 9.5 | 92.7 | 6.0 |
| 20.0 | 103.3 | 1.1 | 102.0 | 0.8 | 0.3125 | 98.8 | 7.3 | 95.1 | 13.3 | |
| 8.0 | 103.0 | 0.8 | 95.4 | 4.1 | 0.00488 | 107.6 | 3.5 | 97.6 | 9.4 | |
Results
HPLC Fingerprints and Identification of Major Compounds
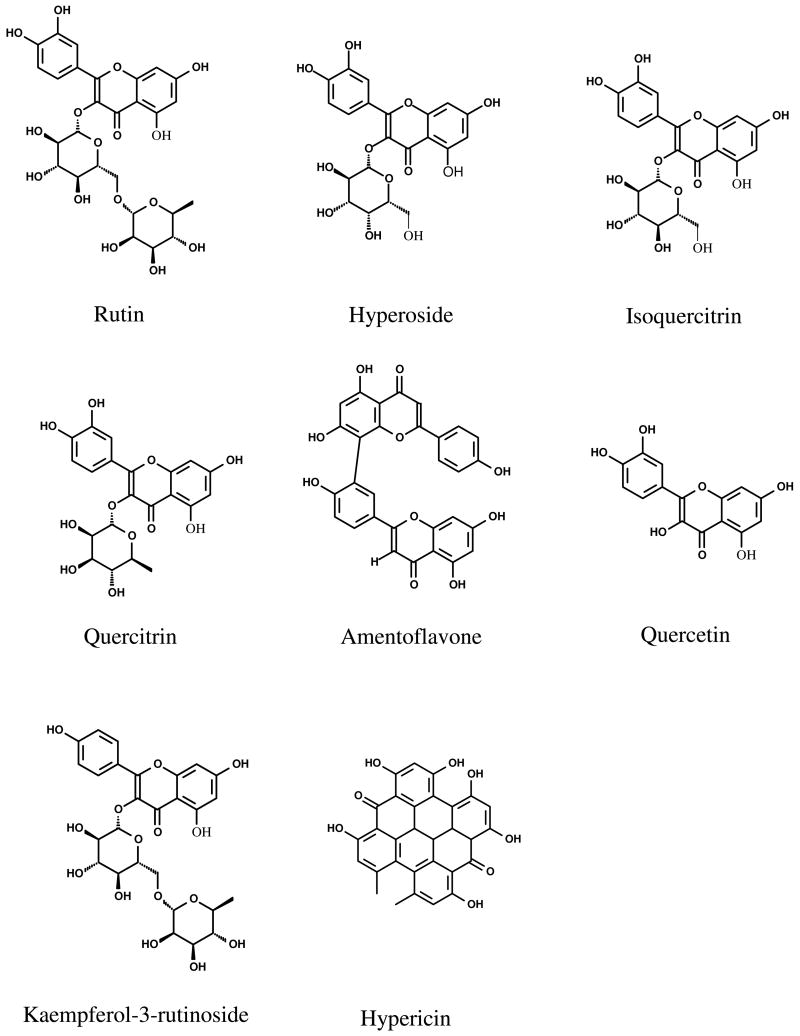
Each of the twelve different SJW products displayed distinctive HPLC fingerprint chromatographs (Figure 1). Fourteen common peaks were observed in these chromatographs including five minor peaks eluted before 20 min, and six major and three minor peaks that were eluted after 20 min. The HPLC profiles were similar among these 12 products indicating that the UV-visible components contained in SJW products were essentially identical. But the relative peak areas of the major components were high variable. Six major peaks were unambiguously assigned as rutin (6), hyperoside (7), isoquercitrin (8), quercitrin (10), quercetin (13), and amentoflavone (14) (Figure 2), respectively by HPLC co-injection with authentic compounds, which were further confirmed by UV spectra and MS/MS data (12) (Table 5). The possible MS/MS spectra of these identified compounds were also shown in Figure 3.
Figure 1.
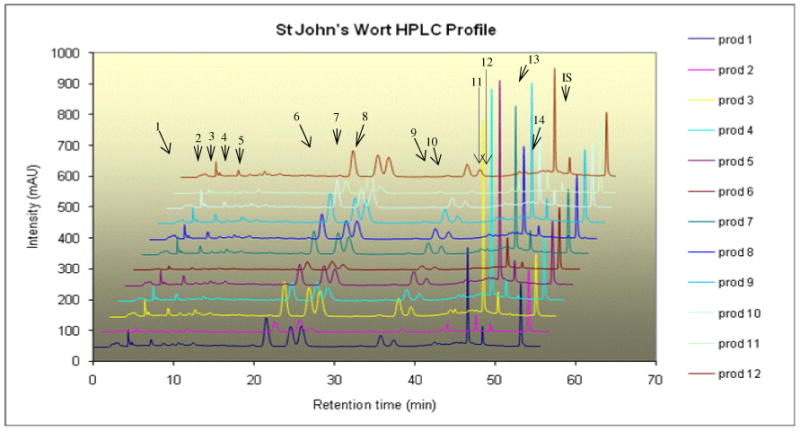
The HPLC chromatograms of extracts of 12 St. John's Wort Supplement products.
Figure 2.
Chemical Structures of Compounds Studied in This Paper.
Table 5. Identification of Key Phenolic Compounds by HPLC and UPLS-MSn.
| Compound | HPLC Retention time (min) | UPLC Retention time (min) | UV λmax (nm) | ESI-MS (-) m/z |
|---|---|---|---|---|
| Rutin | 21.0 | 2.80 | 254.7, 354.4 | 609.3 [M-H]- |
| Hyperoside | 23.95 | 2.60 | 254.7, 354.4 | 463.1 [M-H]- |
| Isoquercitrin | 25.28 | 2.85 | 254.7, 354.4 | 463.2 [M-H]- |
| Quercitrin | 36.48 | 3.56 | 254.7, 354.4 | 447.3 [M-H]- |
| Quercetin | 46.48 | 3.71 | 254.7, 367.3 | 301.1 [M-H]- |
| Amentoflavone | 48.33 | 3.84 | 268.9, 335.3 | 537.1[M-H]- |
Figure 3.
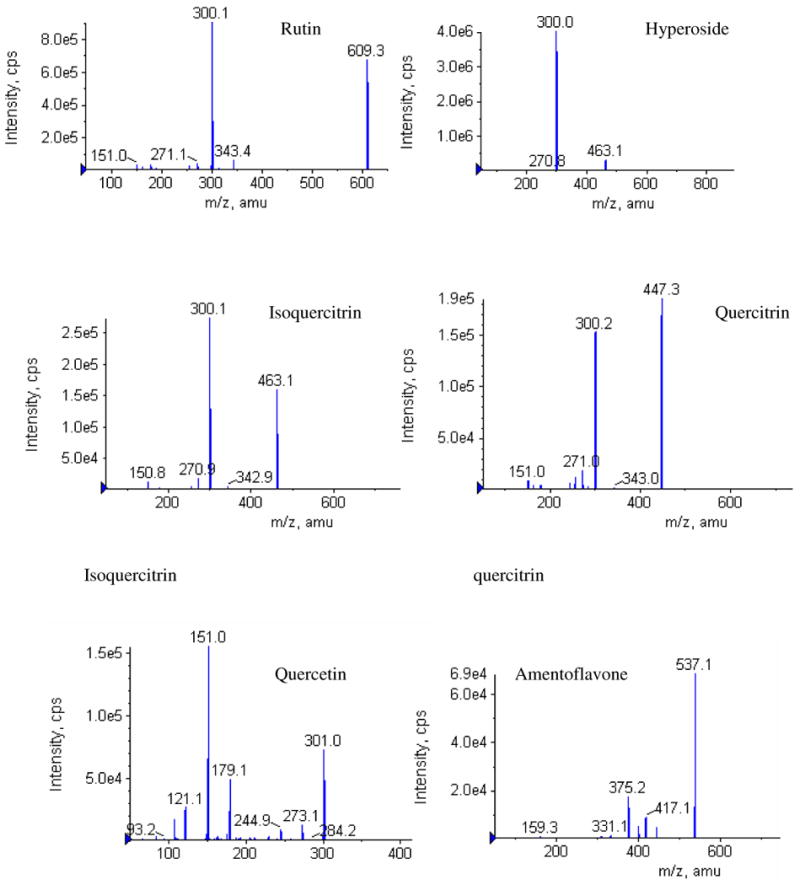
MS/MS profiles of six identified phenolics derived from SJW.
Lack of Content Uniformity Among the Twelve Products
The content uniformity of these major compounds was poor across the 12 products (Table 6). The amount per daily dose varied from 3.51 to 18.93 mg (5.4 folds) for rutin, 2.00 to 9.27 mg (4.6 folds) for hyperoside, 0.37 to 10.66 mg (28.8 folds) for isoquercitrin, 2.86 to 18.39 mg (6.4folds) for quercitrin, 1.56 to 13.70 mg (8.8 times) for quercetin, and from 0.67 to 1.71 mg (2.6 folds) for amentoflavone. The total amount of these phenolics in one product ranged from 70.33 mg to 12.35 mg nearly 6 folds. Statistical analysis showed that all of the compound contents in product 2 were statistically different with those in product 3 indicating that product 2 was significantly different from product 3 (Table 7). Similarly, product 2 was significantly different from product 12 whereas product 3 and 5 were different from 6. Statistical analysis also revealed that there was no difference between product 1 and 10 as well as no difference between 8, 9, 10, and 12. However, except for product 1, 8, 9, 10, and 12, at least one compound was different among all of the tested products. Therefore, poor content uniformity among the SJW products was obvious, which is disconcerting since they all have the same product name.
Table 6. Contents of Six Major Phenolic Compounds per Daily Dose*.
| Products | Rutin (mg) |
Hyperoside (mg) |
Isoquercitrin (mg) |
Quercitrin (mg) |
Quercetin (mg) |
Amentoflavone (mg) |
Total Phenolics (mg) |
|---|---|---|---|---|---|---|---|
| 1 | 16.07±0.76 | 6.32±0.78 | 8.81±1.11 | 12.57±1.75 | 6.02±0.55 | 1.46±0.05 | 51.25 |
| 2 | 5.47±0.13 | 4.05±0.19 | 0.37±0.06 | 3.75±1.33 | 1.31±0.06 | 0.67±0.15 | 15.62 |
| 3 | 18.93±0.67 | 9.27±0.78 | 10.66±0.84 | 18.39±0.54 | 11.50±0.21 | 1.58±0.29 | 70.33 |
| 4 | 7.08±0.15 | 4.36±0.34 | 3.34±0.17 | 8.42±0.68 | 10.16±0.34 | 1.21±0.15 | 34.57 |
| 5 | 10.26±0.50 | 5.67±0.55 | 5.78±0.46 | 11.52±1.62 | 13.70±0.43 | 1.71±0.19 | 48.64 |
| 6 | 3.51±0.07 | 2.00±0.16 | 0.97±0.07 | 3.29±0.15 | 2.11±0.03 | 0.47±0.02 | 12.35 |
| 7 | 10.69±0.37 | 6.36±0.84 | 6.68±1.12 | 14.19±1.55 | 8.43±0.12 | 1.42±0.18 | 47.77 |
| 8 | 13.65±1.25 | 5.78±0.84 | 7.68±1.27 | 12.65±1.91 | 6.79±0.11 | 0.95±0.09 | 47.68 |
| 9 | 14.97±0.18 | 7.25±1.06 | 9.00±1.35 | 11.67±2.84 | 7.19±0.73 | 1.51±0.19 | 51.59 |
| 10 | 15.84±0.97 | 6.94±1.02 | 9.36±1.36 | 15.07±2.84 | 6.57±0.22 | 1.25±0.12 | 55.03 |
| 11 | 5.69±0.34 | 7.91±0.23 | 1.56±0.37 | 2.86±0.49 | 1.56±0.15 | 0.56±0.15 | 20.14 |
| 12 | 13.89±1.24 | 7.46±0.49 | 8.61±0.46 | 11.25±1.37 | 6.77±0.19 | 1.22±0.12 | 49.20 |
Data were based on three individual experiments
Table 7. Statistical Analysis of Six Major Compounds in Different products per Daily Dose*.
| Product No. | 1 | 2 | 3 | 4 | 5 | 6 | 7 | 8 | 9 | 10 | 11 | 12 |
|---|---|---|---|---|---|---|---|---|---|---|---|---|
| 1 | +§#*$ | +#* | +§* | +§* | +§#*$ | +* | + | * | +§#*$ | + | ||
| 2 | +§#*$ | + Δ§#*$ | §*$ | +§#*$ | Δ | +§#*$ | +§#*$ | +§#*$ | +§#*$ | Δ | + Δ§#*$ | |
| 3 | +#* | +Δ§#*$ | + Δ§#* | +§#* | + Δ§#*$ | +§* | +§#* | +#* | +#* | +§#*$ | + #* | |
| 4 | +§* | §*$ | + Δ§#* | +* | + Δ#*$ | +§#* | +§* | +§* | +§#* | Δ#*$ | + Δ§* | |
| 5 | +§* | +§#*$ | +§#* | +* | + Δ§#*$ | * | +*$ | +§* | +§* | +§#*$ | + §* | |
| 6 | +§#*$ | Δ | + Δ§#*$ | + Δ#*$ | + Δ§#*$ | +§#*$ | +§#* | +§#*$ | +§#*$ | + Δ | + Δ§#*$ | |
| 7 | +* | +§#*$ | +§* | +§#* | +§#*$ | +§* | +* | +§* | +§#*$ | +* | ||
| 8 | + | +§#* | +§#*$ | +§* | +*$ | +§#* | +* | +* | +§#* | |||
| 9 | * | +§#*$ | +#* | +§* | +§* | +§#*$ | +* | +§#*$ | ||||
| 10 | +§#*$ | +#* | +§#* | +§* | +§#*$ | +§* | + | +§#*$ | ||||
| 11 | +§#*$ | Δ | +§#*$ | Δ#*$ | +§#*$ | + Δ | +§#*$ | +§#* | +§#*$ | +§#*$ | +#*$ | |
| 12 | + | + Δ§#*$ | +#* | + Δ§* | +§* | + Δ§#*$ | +* | +#*$ |
One-way ANOVA analyze was used to analysis the data shown in Table 6. The symbols indicate statistically significant difference (p < 0.05).
for rutin;
for hyperoside;
for isoquercitrin;
for quercitrin;
for quercetin;
for amentoflavone.
For example, data in this Table showed that among the six major compounds, product 1 and 2 displayed statistically different in the contents of rutin (+), isoquercitrin (§), quercitrin (#), quercetin (*), and amentoflavone ($). There was no difference in the content of hyperoside (no symbol).
Transepithelial and Vectorial Transport of Marker Compounds in Different Product Matrices
Transepithelial transport of three key components in SJW products across the Caco-2 cell monolayer was found to be different from those of control experiments employing pure compounds (10 μM, Figure 4). For rutin, Pa-b in the three products were not statistically altered when comparing with that of control. However, rutin's Pb-a in products 1 and 4 were 7.3 folds higher and in product 2 was 3.7 folds higher than control. For hyperoside, its Pa-b in product 1 was not altered but in products 2 and 4 were only 54% and 46% of that of the control. Moreover, hyperoside's Pb-a in products 1 and 4 were increased 1.9 and 3.4 folds respectively. For isoquercitrin, when comparing to that of control, its Pa-b were 3.5, 2.3, and 2.0 folds higher in products 1, 2, and 4 respectively. On the other hand its Pb-a in product 1 and 2 were statistically lower (78% in product 1 and 42% in product 2) than that of control. The results clearly revealed that product matrixes affected permeabilities of key components.
Figure 4.
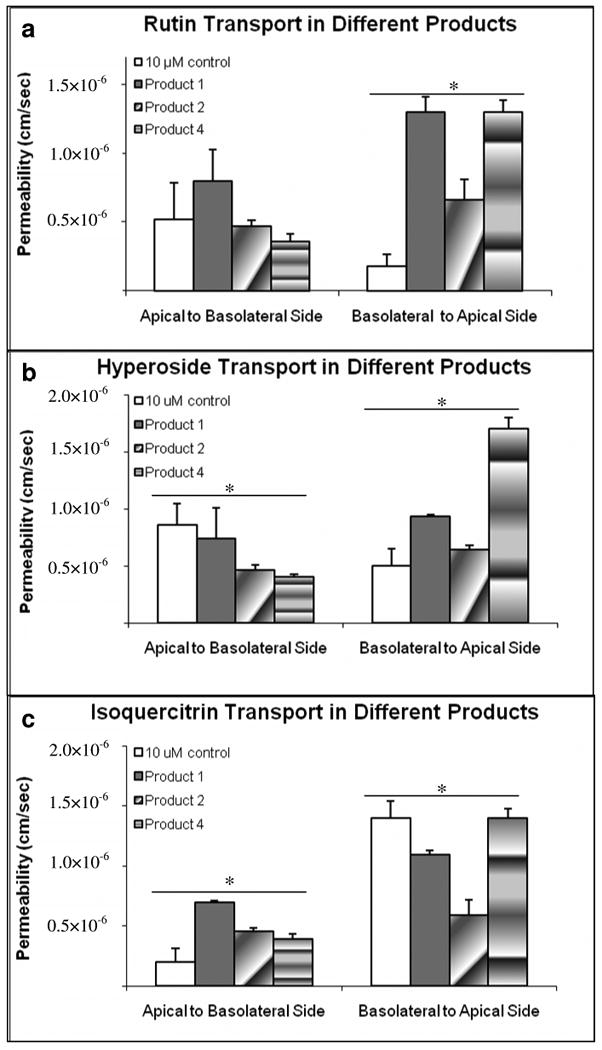
Transport of three marker compounds in pure form or in one of the three product matrices. The buffer used in both donor and receiver sides was pH 6.8. The experiments were performed at 37 °C. Each data point is the average of three determinations, and the error bar is the standard deviation of the mean. The asterisk (*) indicates a statistically significant difference between products and control (p < 0.05, One-way ANOVA).
Vectorial transport, as measured by permeability ratios between basolateral to apical permeability over apical to basolateral permeability, was affected differently across tested products (Figure 5). For rutin, efflux ratios (Pba/Pab) were 1.63 and 3.64 in products 1and 4 respectively. In product 2, the ratio was approximately 1. When transport of hyperoside was preformed, efflux ratios were 1.39 and 4.25 in product 2 and 4 but it was 1in product 1. When transport of isoquercitrin was conducted, efflux ratios were 1.56 and 3.59 in product 1 and 4 whereas the ratio was 1 in product 2. For controls, only isoquercitrin showed significant efflux with a ratio of 7.13. These results suggested that transport behaviors of key compounds were significantly affected by product matrixes.
Figure 5.
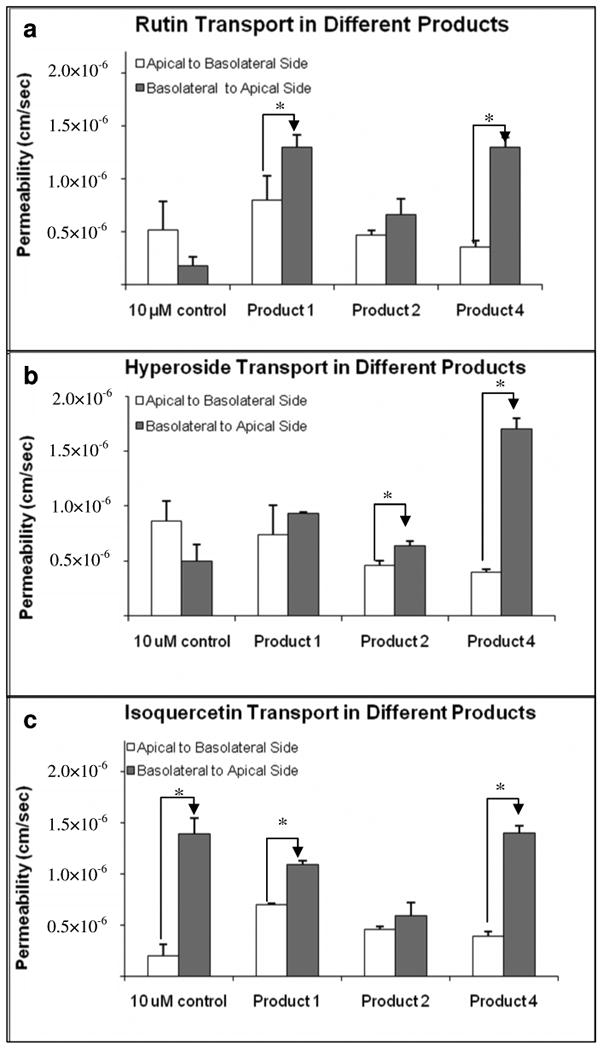
Effect of product matrices on the (basolateral to apical over) apical to basolateral permeability ratios. The buffer used in both donor and receiver sides was pH 6.8. The experiments were performed at 37 °C. Each data point is the average of three determinations, and the error bar is the standard deviation of the mean. The asterisk (*) indicates a statistically significant difference between apical to basolateral and basolateral to apical transport (p < 0.05, unpaired Student T-test).
Effects of Matrix on Transport of Kaempferol-3-rutinoside
In order to confirm the presence of matrix effect, transport of kaempferol-3-rutinoside (Figure 2) was studied since kaempferol-3-rutinoside normally is not present in SJW and is structurally similar to other key components present in SJW. The results showed that when kaempferol-3-rutinoside was used as a pure compound in the Caco-2 cell transport experiment, its vectorial transport ratio was 0.16. However, in product 4, its efflux ratio was 3.5 (Figure 6). The result clearly revealed that the absorptive transport was inhibited and the efflux was accelerated in product 4 (Figure 6).
Figure 6.
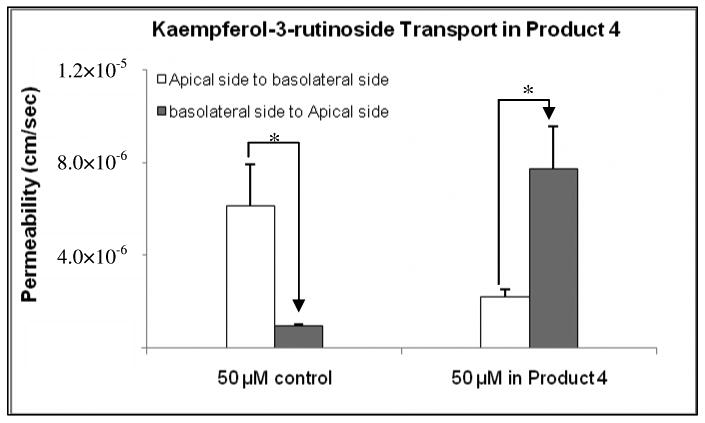
Matrix effect on kaempferol-3-rutinoside transport. The buffer used in both donor and receiver sides was pH 6.8 HBSS. The experiments were performed at 37 °C. Each data point is the average of three determinations, and the error bar is the standard deviation of the mean. The asterisk (*) indicates a statistically significant difference between apical to basolateral and basolateral to apical transport (p < 0.05, unpaired Student T-test).
Effect of MRP2 Inhibitor on Isoquercitrin Transport
When transport of pure isoquercitrin was studied, its vectorial transport ratio was 7.13, suggesting the involvement of an efflux transporter. To determine which efflux transporters might be involved, studies were conducted in the presence of 50 μM of MK 571 (Figure 7a, b). The results showed that Pa-b increased 3.2 times whereas Pb-a decreased 5.2 times comparing to control, resulting in a vectorial transport ratio of 1, suggesting efflux was inhibited completely or nearly completely. When isoquercitrin was transported in the presence of 50 μM of MK 571 (Figure 7c, d), its Pb-a didn't change but Pa-b was significantly increased (2.9 times) in product 4. The Pb-a was not statistically different from Pa-b. In product 2, its Pb-a reduced 1.8 times while Pa-b didn't increase significantly. The efflux ratio was 0.4 in product 2.
Figure 7.
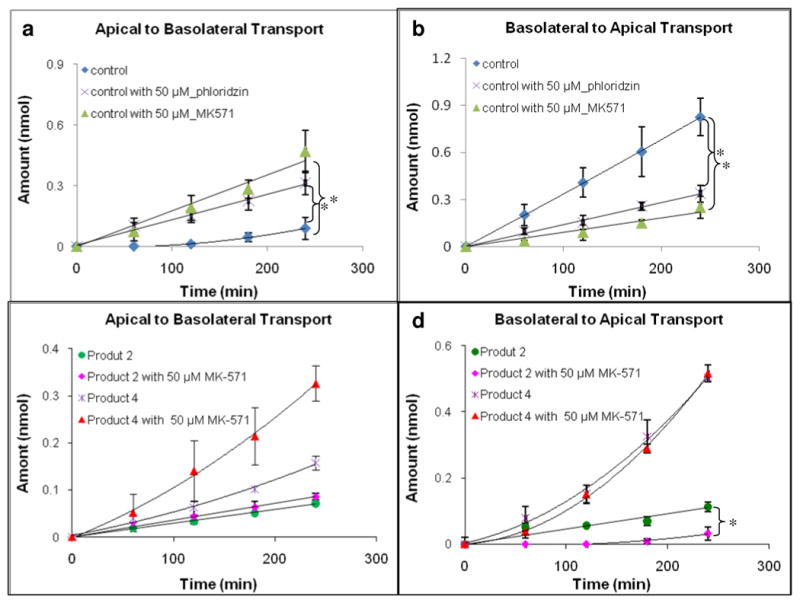
Effect of MK-571 and phloridzin on transport of isoquercitrin in pure form (upper two panels) or in product matrices (lower two panels). Both apical to basolateral (Fig.7a and 7c) and basolateral to apical (Fig.7b and 7d) transport was monitored. The concentration of control is 10 μM. The buffer used in both donor and receiver sides was pH 6.8 HBSS. The experiments were performed at 37 °C. Each data point is the average of three determinations, and the error bar is the standard deviation of the mean. The asterisk (*) indicates a statistically significant difference between with and without MK-571 (p < 0.05, unpaired Student T-test).
Phloridzin, a substrate of both SGLT1 and MRP1/2 (17), was also used to study the uptake transporter (Figure 7a, b). Interestingly, in the presence of 50 μM phloridzin, its Pa-b was increased 2.9 times (compared to the control), its Pb-a decreased 2.1 times, and the difference between its Pa-b and Pb-a was diminished.
Effects of Concentration on Rutin Transport
Since it was not possible to determine the transport of same flavonoid glucoside at one uniform concentration across different products, effects of concentration on transport of rutin was determined at 5 and 10 μM concentration. The results showed that concentration change did not significantly affect transepithelial transport of rutin (Figure 8).
Figure 8.
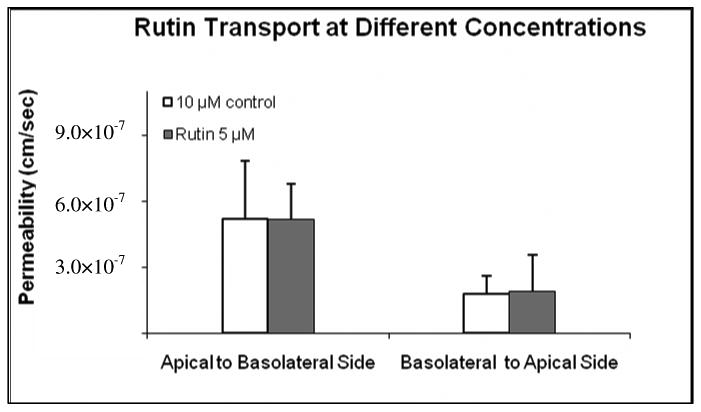
Effects of concentration on rutin transport. The buffer used in both donor and receiver was pH 6.8. The experiments were performed at 37 °C. Each data point is the average of three determinations, and the error bar is the standard deviation of the mean.
Marker compounds hydrolysis and metabolism
Marker compounds rutin, hyperoside, and isoquercitrin used in transport studies were not hydrolyzed since their aglycone was not detected by UPLC-MS/MS. Glucuronidation and sulfation metabolites of these three marker compounds and their aglycone were not detected either.
Discussion
Our study showed clearly that different SJW products have different HPLC fingerprints and phenolic contents of different products were highly variable. Furthermore, our study demonstrated for the first time that the transport of phenolic compounds across the Caco-2 cell monolayers was significantly altered by the product matrices. Use of MRP2 inhibitor MK-571 suggests that some of the matrix effects observed in the transport of key phenolic products were possibly the results of interaction of other components present in these products with MRP efflux transporters.
Contents of major phenolics were highly variable across 12 products, even though all the products contained these phenolics based on UV and MS chromatograms (Figure. 1, Table 6, 7). The high variability means that consumer cannot obtain the same amount of these compounds by taking different SJW products, even if they correctly followed the manufacturers' recommendations. For example, by taking product 1, a consumer will take 51.25 mg of major phenolics, including 16.07 mg of rutin, 6.32 mg of hyperoside, 8.81 mg of isoquercitrin, 12.57 mg of quercitrin, 6.02 mg of quercetin and 1.46 mg of amentoflavone. On the contrary, he/she will take almost equal amount (48.64 mg, 0.95 fold) of total phenolics by consuming product 5, but the compounds were quite different, which contained 10.26 mg (0.64 fold) of rutin, 5.67 mg (0.90 fold) of hyperoside, 5.78 mg (0.66 fold) of isoquercitrin, 11.52 mg (0.9 folds) of quercitrin, 13.70 mg (2.3 folds) of quercetin, and 1.71 mg (1.2 folds) of amentoflavone. In product 5, the amounts of quercitrin and amentoflavone were higher than those in product 1 while the other key components were less. If product 3 and 6 were taken, 70.33 mg and 12.35 mg of total phenolics will be administrated respectively and the latter is significantly less than those of product 1 and 5. The lack of quality control criteria for SJW dietary supplement means that consumers will get different amounts of components by taking different products with the exact same product name.
In addition to the lack of uniformity in major phenolic contents, product differences also significantly impacted the transport of these phenolics, making the differences in exposure to phenolics even bigger. The study clearly revealed that product matrices, most likely due to the differences in phytochemical compositions, significantly affected the transport of phenolics across the Caco-2 cell monolayers (Figures. 4-7). The transport was affected at multiple levels, although a higher permeability displayed by an phenolic was not correlated with a higher content in the product (Table 5, Figure. 4). Surprisingly, the effects of matrices on transepithelial transport of all three phenolics had the similar pattern (Figure.4), in that all three phenolics from the same product displayed the highest transepithelial permeabilities in either the apical to basolateral or basolateral to apical direction, although the extent of the differences was variable (Figure.4). The more dramatic differences were apparent when comparing the permeability ratios (Figures. 5-6) in that transport ratios often changed from favoring apical to basolateral absorption to favoring basolateral to apical efflux (Figures. 5-6), except for isoquercitrin, which always favored efflux (Figure. 5c). Another way to examine the effects of matrix on transport is to determine how different product matrices impact the permeability ratios of the phenolics. Product 4 always increased efflux ratios (Figures. 5-6) including that of kaempherol-3-rutinoside, which is not present in SJW.
To determine the possible reasons why different products have influenced transport of phenolics differently, we first examined the known mechanisms of transport for flavonoid glycosides. Earlier works have shown that SGLT1 was involved in the apical uptake of flavonoid glycoside (e.g. quercetin-3-glucoside, quercetin 4′-glucoside, isorhamnetin-3-O-rutinoside), and MRP2 was involved in its apical efflux (17-20). Later studies showed that flavonoid glycosides presented in plants could inhibit the functions of MRPs (21, 22). The results of the present studies are consistent with these published conclusions such that three out of the four pure flavonoid glycosides (other than isoquercitrin) had higher (although not always statistically significant) apical to basolateral permeability than basolateral to apical permeability, suggesting that SGLT1 may be involved in the uptake of these flavonoid glycosides (17, 18). However, evidence accumulated here didn't support the involvement of SGLT1 in the isoquercitrin uptake (Figure. 5c) as its apical to basolateral transport was always lowered than the basolateral to apical transport in the absence of an inhibitor (Figure. 5c, Figure.7). In any rate, this role of SGLT1 could not be excluded completely since this compound is heavily effluxed and possibly poorly transported by SGLT1, making the detection of its contribution more difficult. It was quite surprising that in product 4, basolateral to apical transport of all four flavonoid glycosides became substantially higher than their apical to basolateral transport, suggesting this product may contain ingredients that enhance the functions of MRP2. If more detailed in vivo studies can confirm this observation, it would represent the first known case that short term treatment of herbal supplement could enhance the function of an efflux transporter. Earlier study has shown that the transporter function was inhibited by the flavonoid and other phytochemical glycosides (21, 22).
One of the interesting findings of our study was that three marker compounds, all glycosides, were not found to be hydrolyzed in the study. Although it is generally recognized that flavonoid glycosides can be hydrolyzed by microflora β-glycosidases to the aglycone in GI tract (23, 24), Caco-2 cells usually do not possess β-glycosidase activities (19, 25). This is different from in vivo situation, where microflora bacteria are abundantly present in the lower small intestine (i.e., ileum) and colon. Another interesting finding is that all three flavonoid glycosides were shown to be permeable, albeit poorly. Previously, Serra et al reported that diosmin, hesperidin, and naringin were not permeable (26), but the difference may be due to the lower sensitivity of analysis method used in that paper (HPLC-UV) and shorter duration of the transport study (120 min). In our study, a more sensitive UPLC-MS analysis method was used and the transport duration was 240 min. In any way, our reported permeabilities were close to two previously reported permeability values of flavonoids by Zou et al (25) and Tian et al (22), both less than 1.0 × 10⁻⁶ cm/sec, but is higher than the permeability of naringin reported by Tourniaire et al, which was 0.8×10⁻⁷ cm/sec at 90 μM (27). The reason for this discrepancy is unclear. Taken together, all of the flavonoid glycosides have permeability that is lower than 1×10⁻⁶ cm/sec, indicating poor absorption with a predicted %absorption in humans of less than 15% (28).
One of the unexpected findings of this study was that hypericin was not detected in any of the product extracts. Hypericin (Figure 2), a potentially beneficial naphthodianthrone standardized by the manufacturer, was not detected by HPLC in this experiment. We believed that this is because hypericin is a highly unstable in aqueous solutions, especially under light exposure as was used in our experiments (29). We tried to extract hypericin by adding 0.1% Vc and 0.01% of EDTA without light exposure, which is considered to be a common way to prevent oxidation via free radicals (30, 31), but hypericin was not found using a UV method. Draves and co-workers showed that most labels overestimate hypericin content in commercial SJW products (32). Only two products were proven to have a total naphthodianthrone concentration within 10% of their labeled claims and no naphthodianthrone was detected in other products (32).
Conclusion
Twelve St John's Wort products used in the present study contain highly variable amounts of phenolics. Because different products possessed highly variable matrices, the transepithelial transport of three key phenolics and one model phenolic (kaempherol-3-glycoside) across the Caco-2 cell monolayers were substantially affected by differences in the matrix composition. Because permeation across the intestinal membrane (i.e., Caco-2 cells) is the first step in the bioavailability continuum, the bioavailabilities of these phenolics will most likely be highly variable. Therefore, we conclude that standardization of herbal supplement is very important from pharmaceutical and biopharmaceutical points of view, as long as the ultimate goal is to make alternative herbal medicine such as SJW as an attractive alternative to the conventional Western medical care.
Acknowledgments
Funding for the study was provided by The Gustavus and Louise Pfeiffer Research Fundation and NIH GM070737, both to MH.
Abbreviations Used
- SJW
St John's Wort
- LC
Liquid chromatography
- LC-MS/MS
Liquid chromatography coupled with tandem mass spectrometry
- HPLC
High performance liquid chromatography
- UPLC
Ultra performance liquid chromatography
- UPLC-MS/MS
Ultra performance liquid chromatography coupled with tandem mass spectrometry
- MRP1/2
Multidrug resistance-associated protein 1 or 2
- SGLT1
Sodium-glucose transport protein 1
- TEER
Transendothelial electrical resistance
- HBSS
Hank's balanced salt solution
Literature Cited
- 1.Smeets RJ. A comparison of the relationship between depression, perceived disability, and physical performance in persons with chronic pain: a comment on Alschuler et al. (2008) Eur J Pain. 2009;13(1):109–10. doi: 10.1016/j.ejpain.2008.08.005. author reply 111-2. [DOI] [PubMed] [Google Scholar]
- 2.Prager LM. Depression and suicide in children and adolescents. Pediatr Rev. 2009;30(6):199–205. doi: 10.1542/pir.30-6-199. quiz 206. [DOI] [PubMed] [Google Scholar]
- 3.Hartley SL, Maclean WE. Depression in adults with mild intellectual disability: role of stress, attributions, and coping. Am J Intellect Dev Disabil. 2009;114(3):147–60. doi: 10.1352/1944-7588-114.3.147. [DOI] [PMC free article] [PubMed] [Google Scholar]
- 4.Keith SJ, Matthews SM. The value of psychiatric treatment: its efficacy in severe mental disorders. Psychopharmacol Bull. 1993;29(4):427–30. [PubMed] [Google Scholar]
- 5.Moller HJ, Volz HP. Drug treatment of depression in the 1990s. An overview of achievements and future possibilities. Drugs. 1996;52(5):625–38. doi: 10.2165/00003495-199652050-00001. [DOI] [PubMed] [Google Scholar]
- 6.Bilia AR, Gallori S, Vincieri FF. St. John's wort and depression: efficacy, safety and tolerability-an update. Life Sci. 2002;70(26):3077–96. doi: 10.1016/s0024-3205(02)01566-7. [DOI] [PubMed] [Google Scholar]
- 7.Andreescu Carmen, M BH, Emanuel James E. Complementary and alternative medicine in the treatment of bipolar disorder — A review of the evidence. Journal of Affective Disorders. 2008;110:16–26. doi: 10.1016/j.jad.2008.03.015. [DOI] [PubMed] [Google Scholar]
- 8.Brattstrom A. Long-term effects of St. John's wort (Hypericum perforatum) treatment: a 1-year safety study in mild to moderate depression. Phytomedicine. 2009;16(4):277–83. doi: 10.1016/j.phymed.2008.12.023. [DOI] [PubMed] [Google Scholar]
- 9.Barnes J, Anderson LA, Phillipson JD. St John's wort (Hypericum perforatum L.): a review of its chemistry, pharmacology and clinical properties. J Pharm Pharmacol. 2001;53(5):583–600. doi: 10.1211/0022357011775910. [DOI] [PubMed] [Google Scholar]
- 10.Bent S. Herbal medicine in the United States: review of efficacy, safety, and regulation: grand rounds at University of California, San Francisco Medical Center. J Gen Intern Med. 2008;23(6):854–9. doi: 10.1007/s11606-008-0632-y. [DOI] [PMC free article] [PubMed] [Google Scholar]
- 11.Zhou S, Chan E, Pan SQ, Huang M, Lee EJ. Pharmacokinetic interactions of drugs with St John's wort. J Psychopharmacol. 2004;18(2):262–76. doi: 10.1177/0269881104042632. [DOI] [PubMed] [Google Scholar]
- 12.Schmidt B, Jaroszewski JW, Bro R, Witt M, Staerk D. Combining PARAFAC analysis of HPLC-PDA profiles and structural characterization using HPLC-PDA-SPE-NMR-MS experiments: commercial preparations of St. John's Wort. Anal Chem. 2008;80(6):1978–87. doi: 10.1021/ac702064p. [DOI] [PubMed] [Google Scholar]
- 13.Corti G, Maestrelli F, Cirri M, Zerrouk N, Mura P. Development and evaluation of an in vitro method for prediction of human drug absorption II. Demonstration of the method suitability. Eur J Pharm Sci. 2006;27(4):354–62. doi: 10.1016/j.ejps.2005.11.005. [DOI] [PubMed] [Google Scholar]
- 14.Paulke A, Noldner M, Schubert-Zsilavecz M, Wurglics M. St. John's wort flavonoids and their metabolites show antidepressant activity and accumulate in brain after multiple oral doses. Pharmazie. 2008;63(4):296–302. [PubMed] [Google Scholar]
- 15.Butterweck V, Jurgenliemk G, Nahrstedt A, Winterhoff H. Flavonoids from Hypericum perforatum show antidepressant activity in the forced swimming test. Planta Med. 2000;66(1):3–6. doi: 10.1055/s-2000-11119. [DOI] [PubMed] [Google Scholar]
- 16.Hu M, Chen J, Lin H. Metabolism of flavonoids via enteric recycling: mechanistic studies of disposition of apigenin in the Caco-2 cell culture model. J Pharmacol Exp Ther. 2003;307(1):314–21. doi: 10.1124/jpet.103.053496. [DOI] [PubMed] [Google Scholar]
- 17.Walle T, Walle UK. The beta-D-glucoside and sodium-dependent glucose transporter 1 (SGLT1)-inhibitor phloridzin is transported by both SGLT1 and multidrug resistance-associated proteins 1/2. Drug Metab Dispos. 2003;31(11):1288–91. doi: 10.1124/dmd.31.11.1288. [DOI] [PubMed] [Google Scholar]
- 18.Walgren RA, Lin JT, Kinne RK, Walle T. Cellular uptake of dietary flavonoid quercetin 4′-beta-glucoside by sodium-dependent glucose transporter SGLT1. J Pharmacol Exp Ther. 2000;294(3):837–43. [PubMed] [Google Scholar]
- 19.Walgren RA, Karnaky KJ, Jr, Lindenmayer GE, Walle T. Efflux of dietary flavonoid quercetin 4′-beta-glucoside across human intestinal Caco-2 cell monolayers by apical multidrug resistance-associated protein-2. J Pharmacol Exp Ther. 2000;294(3):830–6. [PubMed] [Google Scholar]
- 20.Wolffram S, Block M, Ader P. Quercetin-3-glucoside is transported by the glucose carrier SGLT1 across the brush border membrane of rat small intestine. J Nutr. 2002;132(4):630–5. doi: 10.1093/jn/132.4.630. [DOI] [PubMed] [Google Scholar]
- 21.Patanasethanont D, Nagai J, Matsuura C, Fukui K, Sutthanut K, Sripanidkulchai BO, Yumoto R, Takano M. Modulation of function of multidrug resistance associated-proteins by Kaempferia parviflora extracts and their components. Eur J Pharmacol. 2007;566(1-3):67–74. doi: 10.1016/j.ejphar.2007.04.001. [DOI] [PubMed] [Google Scholar]
- 22.Tian X, Yang X, Wang K. The efflux of flavonoids morin, isorhamnetin-3-O-rutinoside and diosmetin-7-O-beta-D-xylopyranosyl-(1-6) -beta-D-glucopyranoside in the human intestinal cell line caco-2. Pharm Res. 2006;23(8):1721–8. doi: 10.1007/s11095-006-9030-5. [DOI] [PubMed] [Google Scholar]
- 23.Kim DH, Jung EA, Sohng IS, Han JA, Kim TH, Han MJ. Intestinal bacterial metabolism of flavonoids and its relation to some biological activities. Arch Pharm Res. 1998;21(1):17–23. doi: 10.1007/BF03216747. [DOI] [PubMed] [Google Scholar]
- 24.Parisis DM, Pritchard ET. Activation of rutin by human oral bacterial isolates to the carcinogen-mutagen quercetin. Arch Oral Biol. 1983;28(7):583–90. doi: 10.1016/0003-9969(83)90005-5. [DOI] [PubMed] [Google Scholar]
- 25.Zuo Z, Zhang L, Zhou L, Chang Q, Chow M. Intestinal absorption of hawthorn flavonoids--in vitro, in situ and in vivo correlations. Life Sci. 2006;79(26):2455–62. doi: 10.1016/j.lfs.2006.08.014. [DOI] [PubMed] [Google Scholar]
- 26.Serra H, Mendes T, Bronze MR, Simplicio AL. Prediction of intestinal absorption and metabolism of pharmacologically active flavones and flavanones. Bioorg Med Chem. 2008;16(7):4009–18. doi: 10.1016/j.bmc.2008.01.028. [DOI] [PubMed] [Google Scholar]
- 27.Tourniaire F, Hassan M, Andre M, Ghiringhelli O, Alquier C, Amiot MJ. Molecular mechanisms of the naringin low uptake by intestinal Caco-2 cells. Mol Nutr Food Res. 2005;49(10):957–62. doi: 10.1002/mnfr.200500088. [DOI] [PubMed] [Google Scholar]
- 28.Artursson P, Karlsson J. Correlation between oral drug absorption in humans and apparent drug permeability coefficients in human intestinal epithelial (Caco-2) cells. Biochem Biophys Res Commun. 1991;175(3):880–5. doi: 10.1016/0006-291x(91)91647-u. [DOI] [PubMed] [Google Scholar]
- 29.Ang CY, Hu L, Heinze TM, Cui Y, Freeman JP, Kozak K, Luo W, Liu FF, Mattia A, DiNovi M. Instability of St. John's wort (Hypericum perforatum L.) and degradation of hyperforin in aqueous solutions and functional beverage. J Agric Food Chem. 2004;52(20):6156–64. doi: 10.1021/jf0490596. [DOI] [PubMed] [Google Scholar]
- 30.Li XJ, Zhao BL, Liu GT, Xin WJ. Scavenging effects on active oxygen radicals by schizandrins with different structures and configurations. Free Radic Biol Med. 1990;9(2):99–104. doi: 10.1016/0891-5849(90)90111-u. [DOI] [PubMed] [Google Scholar]
- 31.Ates B, Abraham L, Ercal N. Antioxidant and free radical scavenging properties of N-acetylcysteine amide (NACA) and comparison with N-acetylcysteine (NAC) Free Radic Res. 2008;42(4):372–7. doi: 10.1080/10715760801998638. [DOI] [PubMed] [Google Scholar]
- 32.Draves AH, Walker SE. Analysis of the hypericin and pseudohypericin content of commercially available St John's Wort preparations. Can J Clin Pharmacol. 2003;10(3):114–8. [PubMed] [Google Scholar]


