

Abstract
The anterior region of the Drosophila embryo is patterned by the concentration gradient of the homeodomain transcription factor Bicoid (Bcd). The Bcd gradient was the first identified morphogen gradient and continues to be a subject of intense research at multiple levels, from the mechanisms of RNA localization in the oocyte to the evolution of the Bcd-mediated patterning events in multiple Drosophila species. Critical assessment of the mechanisms of the Bcd gradient formation requires biophysical models of the syncytial embryo. Most of the proposed models rely on reaction-diffusion equations, but their formulation and applicability at high nuclear densities is a nontrivial task. We propose a straightforward alternative in which the syncytial blastoderm is approximated by a periodic arrangement of well-mixed compartments: a single nucleus and an associated cytoplasmic region. We formulate a compartmental model, constrain its parameters by experimental data, and demonstrate that it provides an adequate description of the Bcd gradient dynamics.
INTRODUCTION
The anterior region of the Drosophila embryo is patterned by the concentration gradient of a homeodomain transcription factor Bicoid (Bcd) (Ephrussi and St Johnston, 2004). Bcd is translated from the anteriorly localized maternal transcript and diffuses in the syncytium, a cell with multiple dividing nuclei. During the interphase, Bcd undergoes rapid nucleocytoplasmic exchange (Gregor et al., 2007). When in the nucleus, Bcd binds the regulatory DNA regions of its transcriptional targets, controlling in this way multiple gene expression boundaries along the anteroposterior (AP) axis of the embryo. The Bcd gradient was the first identified morphogen gradient and continues to be a subject of intense research at multiple levels, from the mechanisms of RNA localization in the oocyte to the evolution of the Bcd-mediated patterning events in multiple Drosophila species (Goering et al., 2009; McGregor, 2005; Weil et al., 2008).
The core processes leading to the formation of the Bcd gradient are well established, but their relative contributions to the gradient dynamics are a matter of debate (Reinitz, 2007). For instance, a textbook model of the Bcd gradient assumes that the transcript is tightly localized to the anterior pole of the embryo and that the formation of the gradient requires protein diffusion (Wolpert et al., 2002). In sharp contrast to this view, a recent study reports that the transcript is distributed in an AP gradient with a length scale very near to the length scale of the Bcd protein gradient (Spirov et al., 2009). As another example, while nuclear degradation of Bcd was proposed to set the length scale of the Bcd gradient (Gregor et al., 2007), recent computational and experimental studies argue that nuclei play no role in determining the wild type gradient length scale and stability (Coppey et al., 2007; Lucchetta et al., 2008).
Unambiguous resolution of these arguments requires direct measurements of multiple rate processes, such as the lifetime of the Bcd protein and its diffusivity. At this time, accurate quantitative information for most of these parameters is unavailable. For example, the spatial pattern of Bcd production is inferred from the pattern of transcript localization, which is clearly an indirect measure of the Bcd synthesis rate. Similarly, two existing estimates of the Bcd diffusivity differ by almost two orders of magnitude (Gregor et al., 2005; Gregor et al., 2007). Under these circumstances, one can attempt to solve an inverse problem, i.e., to deduce the rate constants of multiple processes from the macroscopic properties of the gradient, such as its length scale, by fitting the observed gradient to a mathematical model.
Most of the proposed models of the Bcd gradient dynamics are based on reaction-diffusion partial differential equations (PDEs) and assume that the dynamics of Bcd concentration can be characterized by effective diffusivity and reaction rate constants (Aegerter-Wilmsen et al., 2005; Coppey et al., 2007; Hecht et al., 2009; Manu et al., 2009). Formulation of such models is a nontrivial task. Indeed, a syncytial embryo is a system with multiple time and length scales that characterize the nucleocytoplasmic shuttling of Bcd, its diffusion between nuclei, as well as changes in the size and number of the nuclei themselves. Approximate continuum models can be derived via a rigorous homogenization approach, leading to averaged reaction-diffusion PDEs at a given nuclear density; yet no formal way of accounting for dynamic variations in the nuclear size and/or mitosis currently exists (Sample and Shvartsman, 2010).
An alternative to the PDE-based modeling is provided by a more coarse-grained description, whereby the syncytium is modeled by a system of well-mixed compartments, each of which contains a single nucleus and associated cytoplasmic region (“island”). This model has been suggested by live imaging studies of the dynamics of Dorsal (Dl), a protein that patterns the dorsoventral axis of the embryo (DeLotto et al., 2007). These studies revealed dynamics characterized by a slow inter-island exchange and rapid intra-island equilibration. A mathematical model based on these observations was consistent with the observed dynamics of the Dl gradient and made a number of successful predictions (Kanodia et al., 2009). Here, we use a similar approach to model the Bcd gradient and explore the importance of different processes, including the inter-island exchange rate of Bcd protein in the late syncytium, and the importance of the spatial distribution of the source of Bcd synthesis. In addition, we provide an estimate for the time scale of Bcd degradation in the model where Bcd is degraded in the nuclei.
Results
Compartmental model of the early embryo
Our model describes the temporal evolution of the Bcd concentration along the one-dimensional AP axis, whose length we denote by L (see Fig. 1A). During cycles 1–9, we only consider the transport of cytoplasmic Bcd, which is modeled through a standard diffusion equation with a constant effective diffusivity D; we neglect the presence of the nuclei, since their volume fraction is very small. Bcd is produced at a constant rate Q at the anterior end (xA=0) of the embryo; a no-flux boundary condition for the cytoplasmic Bcd applies at the posterior end (x=xP=L). The initial concentration of Bcd is taken to be zero (see Supporting material for equations).
Figure 1.
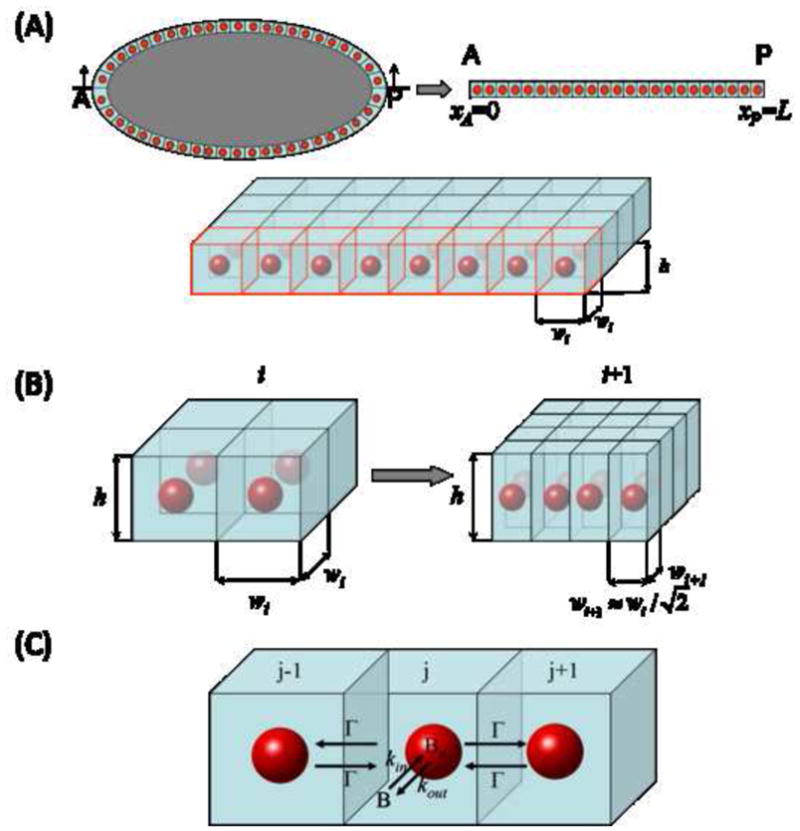
(A) Model geometry: red spheres illustrate the nucleus in each compartment, and light blue denotes the surrounding cytoplasmic island.
(B) Variation of the width of each compartment between two successive cycles, i and i+1. If the number of nuclei doubles then the total volume is conserved when wi+1=2−1/2 wi.
(C) Expanded view of three adjacent compartments. Mass is transferred within each compartment from the cytoplasm to the nucleus at a rate proportional to the coefficient kin, and from the nuclear phase to the cytoplasmic at a rate proportional to the coefficient kout. Cytoplasmic Bcd is transferred across compartments at a rate proportional to the coefficient Γ.
During the second phase of the process (cycles 10–14) the syncytium is modeled as an array of identical cuboidal compartments (Kanodia et al., 2009). During the interphase of the nuclear division cycle, each compartment consists of a single nucleus and its surrounding cytoplasm, within which transport occurs at a rate much faster than that of transport between adjacent compartments, as was shown by fluorescence recovery after photobleaching (FRAP) experiments (DeLotto et al., 2007). Thus, we model the concentration of cytoplasmic Bcd as uniform (completely mixed) within each compartment and assume that the same holds also for the concentration of nuclear Bcd. The dynamics of a single compartment during the interphase period are then described by two ordinary differential equations (ODEs): one for cytoplasmic and one for nuclear Bcd (see Supporting Material for more details).
Cytoplasmic Bcd is transported across neighboring compartments through a “membrane”’-like transport mechanism, where flux is proportional to the commonly shared surface area, Aadj, the inter-compartmental difference of cytoplasmic Bcd concentrations and a permeability constant Γ, which we assume remains constant at all times (Fig. 1B,C). We also model the transport of Bcd between its cytoplasmic and nuclear compartments as a first order process across the nucleus surface area, An. We assume that the trapping rate of cytoplasmic Bcd by nuclei is proportional to a coefficient kin and its concentration; the release rate of Bcd from the nucleus to its surrounding cytoplasm is also taken to be proportional, with coefficient kout, to its concentration in the nuclear phase. In this section, Bcd is modeled as a stable protein without any degradation. An extension of this model, taking into account the nuclear degradation of Bcd, is discussed later in the paper. Thus, the dynamics of cytoplasmic and nuclear Bcd profiles are modeled by the following ODEs:
| (1) |
| (2) |
where [B(j)] and [ ] are the cytoplasmic and nuclear concentrations respectively in compartment j; Aadj is the commonly shared surface of two adjacent compartments given by Aadj=hwi, where h and wi are the height and width, respectively, of the nuclear compartment, and An is the surface area of a single nucleus. Assuming that the nucleus is a sphere, An (t) = 4πR(t)2, where R(t) is the nuclear radius at time t (we take into account the experimental observations of growing nuclear radii during each cycle, (Gregor et al., 2007)). Vn is the volume occupied by a single nucleus (Vn = 4/3πR3) and is the volume of the associated cytoplasm island.
At the end of the interphase nuclei dissolve, releasing their content to the surrounding cytoplasm. The number of equations is reduced by a factor of 2, since only cytoplasmic Bcd is now involved in the process and we only consider its mass transport across the compartments. Each compartment has constant height h (corresponding to the cortical thickness) throughout cycles 10–14, and width wi, which does vary between successive cycles in a way that ensures conservation of the total volume occupied by the compartments. When the number of compartments doubles, volume conservation between two successive cycles implies that wi+1 = 2−1/2 wi (see Fig. 1B).
Note that the resulting model is a highly nontrivial dynamical system: It transitions from a (discretized) PDE to a set of (compartment-based) ODEs after the first nine cycles. It is subsequently nonautonomous, due to the temporal variations in nuclear size it embodies. More importantly, it is a variable degree-of-freedom system: at each cycle the number of compartments and, consequently, the number of equations to be solved, changes. Furthermore, within each cycle the number of equations reduces by a factor of two due to nuclear dissolution.
Dimensionless parameters and experiment-based constraints
The model is nondimensionalized using the following set of transformations:
| (3) |
Here T0 is the time interval comprising the first 9 cycles (T0=72 min); Aadj,14 is the common surface area between two adjacent compartments at cycle 14 and Vn,14 is the volume of a single nucleus at the end of cycle 14, when its radius is .
Thus, the dynamics of Bcd depends on four dimensionless parameters: D̂ is the dimensionless effective diffusivity of cytoplasmic Bcd in the early syncytium (the first 9 nuclear division cycles), Γ̂ is the dimensionless transport coefficient of the inter-compartmental transport process during cycles 10–14, K̂in is the dimensionless rate coefficient of the nuclear import of cytoplasmic Bcd, and K̂out is the dimensionless rate coefficient of Bcd release from the nuclear phase to the surrounding cytoplasm. The ratio of import and export rates is henceforth referred to as the “equilibrium constant”.
The ranges within which these four free parameters vary can be constrained by experimental observations. The first constraint is related to the shape of the Bcd gradient at the beginning of cycle 14. Based on experiments with Bcd antibody staining and/or Bcd-GFP constructs, Bcd gradient is found to be exponential in space: B(t)~exp(−z/λ), where z is the normalized distance along the AP axis and λ is the decay length that has been estimated between 0.1 and 0.2. We are interested in those sets of parameters that predict a decay length in this range. The decay length of the model-based gradient is computed by a simple exponential fit.
The second constraint is provided by the stability of the pattern of nuclear Bcd in the late syncytium (Gregor et al., 2007). This pattern is “dissolved” with every mitosis, but is then rapidly re-established at a new nuclear density to a new quasi-steady state value that is within 10% of the pre-mitotic level. In experiments, the stability of the nuclear Bcd gradients was quantified by the spatially averaged coefficient of variation (ratio of the standard deviation and variance) of [Bn] at times: t=74, 84, 95, 110 and 134 min, that correspond to ~40% of the time in the interphase of each nuclear cycle (i=10–14).
To establish a stability measure for the gradient in the model, we first calculate the values of nuclear Bcd at these five specific time points in every compartment. Based on these points, we calculate the mean, the standard deviation, and the accuracy (defined here as a coefficient of variation) of nuclear Bcd in a given compartment. Finally, we average the result over all compartments, generating in this way a scalar measure of the temporal accuracy of the nuclear gradient predicted by the model. We are interested in those sets of parameters that predict accuracy of at least 10% (this corresponds to the coefficient of variation less than 0.1).
Thus, a four-dimensional vector of model parameters is mapped into two numbers. The first number corresponds to the exponential decay length of the Bcd gradient at the beginning of cycle 14, and the second number corresponds to the temporal accuracy (or stability) of the nuclear Bcd gradient during the last five nuclear cycles. An additional constraint is provided by the fact that the nuclear level of Bcd in cycle 14 embryos is higher than the cytoplasmic Bcd concentration (Gregor et al., 2007).
As a first step in analyzing the dynamics of the Bcd gradient in the model, we generated an ensemble of parameter vectors that satisfy the three constraints above. This was done by sampling the four model parameters from uniform distributions. The values for effective diffusivity were chosen based on a uniform distribution between 0.05 and 10 μm2/s, a range that contains the experimentally reported diffusivities (Gregor et al., 2005; Gregor et al., 2007). The values for the import and export rate constants were chosen from a very broad interval; the only condition was that their ratio should be greater than one (see the third constraint above). Finally, the inter-compartmental transport coefficient was chosen between 10−3 and 0.5 μm/s. Our analysis below is based on an ensemble of ~ 40,000 acceptable parameter vectors.
Parameter values in the model with a stable Bcd protein
Fig. 2A depicts the spatiotemporal evolution of the (dimensionless) nuclear Bcd gradient during cycles 10–14 for D=3 μm2/s, Γ=0.1 μm/s, kin=108 μm/s and kout=20 μm/s (kin/kout=5). These dynamics are consistent with the criteria of Bcd shape and stability: The cytoplasmic Bcd gradient, which is fitted by an exponential, has a dimensionless decay length λ=0.16 at the beginning of cycle 14. Temporal stability of nuclear Bcd is also attained (at ~9%). In Fig. 2C we show the evolution of nuclear Bcd concentration during the interphase of cycles 10–14, at a dimensionless distance z=0.1 (10% along the AP axis of the embryo). Bcd rapidly increases within a very short time interval at the beginning of each cycle; after that, an increase of the nuclear radius leads to an effective decrease in the nuclear Bcd concentration. Other modeling approaches, which assume that the nuclear radius is constant, predict a continuously increasing trend (e.g. (Coppey et al., 2007; Hecht et al., 2009)). Note that the nuclear Bcd level starts ramping up with a shallow slope at the end of the interphase of cycle 14; this is due to the stabilization of the nuclear radius combined with the arrival of the newly produced Bcd.
Figure 2.
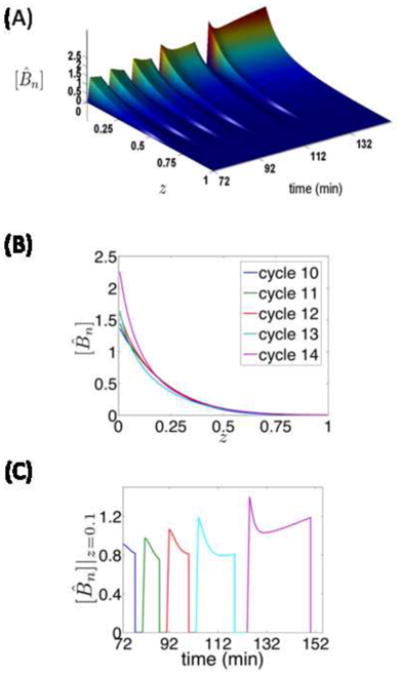
(A) Spatiotemporal evolution of nuclear Bcd predicted for D=3μm2/s, Γ=0.1 μm/s, kin=108μm/s and kout=20 μm/s (kin/kout=5). These parameter values produce Bcd dynamics that are consistent with the Bcd shape criterion (λ = 0.16) and the nuclear Bcd stability criterion (~9% accuracy).
(B) Snapshots of the nuclear Bcd gradient used for the computation of the stability measure. The Bcd gradients are ~9% accurate over cycles 10–14.
(C) Temporal evolution of nuclear Bcd concentration at dimensionless distance z=0.1, showing a rapid increase at the beginning of each cycle; nuclear Bcd then starts decreasing progressively as the volume occupied by the nuclear phase grows.
Live imaging experiments demonstrated that Bcd undergoes rapid nucleocytoplasmic shuttling; this suggests that cytoplasmic and nuclear pools of Bcd can be considered at a local equilibrium (Gregor et al., 2007). While we have not imposed this as a constraint, our analysis indicate that a rapid local equilibration is indeed established between nuclear and cytoplasmic Bcd within each compartment at the beginning of each cycle. A local equilibration implies that the nuclear concentration of Bcd quickly approaches a steady state ( ); this leads to , where K ≡ kin/kout is the equilibrium constant for nuclear import and export. Several test simulations, using a large ensemble of optimal parameter vectors, indicate that there is indeed an agreement between the dynamics of nuclear Bcd concentration and the equilibrium approximation: .
Fig. 3A presents the distribution of acceptable values of this equilibrium constant K, as it results from the application of our parameter screening process. The mean value of this empirically determined distribution (<K>=5.5) is close to the experimentally determined value of ~5. Another parameter of the model which can be compared with experimental measurements is the Bcd diffusivity, D, during the early stages of the process (cycles 1–9). As shown in Fig. 3B according to our model, D can range between 1.5 and 6 μm2/s. Similar estimates were obtained using our earlier PDE-based model (Coppey et al., 2007). While this estimate is in good agreement with the measurements of dextran diffusivity in the early embryo, it is almost an order of magnitude higher than the 0.3 μm2/s value that has been measured with the Bcd-GFP protein in cycle 14 embryos (Gregor et al., 2005; Gregor et al., 2007).
Figure 3.
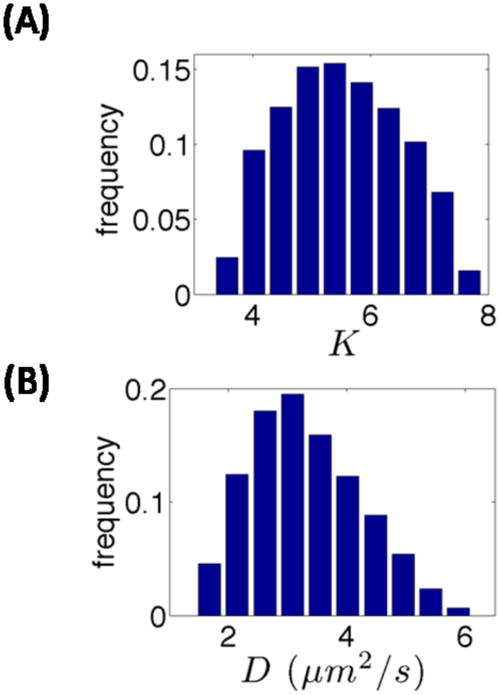
(A) Distribution of the acceptable values of the equilibrium constant for nucleocytoplasmic shuttling, K. (B) Distribution of the sampled acceptable values of Bcd diffusivity, D, during cycles 1–9.
Sensitivity to the distribution of Bcd source and lateral transport
Using a large set of parameters consistent with the wild type Bcd gradient, we can explore aspects of gradient dynamics that cannot (yet) be straightforwardly accessed experimentally. One important question pertains to the distribution gradient of the Bcd mRNA in the syncytium. Until recently, Bcd protein was assumed to be produced at the pole of the embryo where all the mRNA was tightly localized. In contrast, recent work indicated that the Bcd mRNA itself is distributed in a gradient and not localized at the pole (Spirov et al., 2009). We use the model developed in this paper to characterize the behavior of the system with a non-localized source. We analyze the model for two alternate distributed source functions - “sharp mRNA gradient” (λsource = 0.125 λprotein ) or a “shallow mRNA gradient” (λsource = 0.75 λprotein ) and compare these results with the ones obtained using the model with flux localized at the boundary, henceforth referred to as the “localized source”. The equations for the systems with a distributed source are explained in detail in the supplementary material.
We found that as the source becomes delocalized, acceptable parameter values for diffusivity and inter-compartmental transport coefficients become significantly lower, while the equilibrium constant is relatively higher. This can be rationalized as follows: For the highly localized source, protein molecules need to diffuse farther away from the source such that the final protein gradient has a characteristic length between 0.1 and 0.2 (in units of the total size of the system). Therefore, they have higher diffusivity and inter-compartmental transport coefficient. For the shallow source, the protein should not travel far from the source. Thus, lateral transport should be limited and protein should be trapped quickly by the nuclei, which explains the low transport coefficients and slightly higher equilibrium constant. Note that the estimated diffusivity for the shallow source is in good agreement with the Bcd diffusivity measured using Bcd-GFP, in contrast to systems with higher diffusivity.
Another important question that needs to be addressed is the relative contributions of the lateral Bcd transport during the early and late phases of the Bcd gradient formation. Specifically: is it possible that the gradient becomes fully established during the first nine cycles, and that transport during the last nuclear cycles can be neglected? To address this question, we examined the model predictions for a large number of acceptable parameter vectors with either a localized source or a shallow source gradient. For each of these parameter combinations, we set the rate of inter-compartmental transport to zero. The model was then solved for each of the modified parameter vectors, to test whether the predicted gradient is still consistent with the length scale and temporal accuracy constraints.
We found that almost all of the perturbed parameter sets passed this test for the shallow source gradient but no parameter vector satisfied the constraints for the localized source. Thus, lateral transport of Bcd in the late syncytium is not essential for establishing a Bcd gradient in the model with a shallow source of Bcd production. The gradient can be formed during the early nuclear cycles and then “read-out” by the nuclei, which thus act as passive sensors of the pre-established concentration field. In contrast, if the mRNA is localized at the pole, the inter-compartmental transport is important for establishing and maintaining the protein gradient.
Model with nuclear degradation of Bcd
Up until now we considered a model where Bcd is viewed as a protein with infinitely long lifetime. Most of the models in the literature, however, contain some form of Bcd degradation. This is mainly based on the fact that the observed gradient is well-approximated by a single exponential, which can be obtained as a steady state solution of a model that accounts for diffusion and uniform degradation of locally produced Bcd (Driever and Nusslein-Volhard, 1988; Ephrussi and St Johnston, 2004). It has been also proposed that a model including the nuclear degradation of Bcd can account for the scaling properties of the Bcd gradient (Gregor et al., 2007). One attractive feature of this model is that it can potentially account for the experimentally observed scaling of the Bcd gradient in species of different size. At the same time, it is not known whether or not Bcd is degraded on the time scale relevant for the formation of the wild type gradient. This issue can be readily explored using our modeling framework.
We have extended our model to account for a first order nuclear degradation. First, we asked whether the observed dynamics of the gradient can be used to constrain the values for lifetime of the Bcd protein. We selected a number of values for the Bcd lifetime (τ1/2 = 3 min, 5 min, 10 min, 20 min, 40 min, 100 min). For each of these values we implemented the model inversion strategy described above, to determine the ranges of the remaining parameters (D, K, Γ) for the model with either a sharp source or a shallow source We established that for both models with lifetimes greater than 100 minutes, the distribution functions for D, K, and Γ are indistinguishable from those in the model with no Bcd degradation. Furthermore, based on extensive sampling of the parameter space, we concluded that for the localized (or shallow) source, lifetimes below 10 minutes (5 min) cannot be reconciled with the experimentally observed length scale and stability of the Bcd gradient. Thus, we could provide a lower bound for the lifetime of the Bcd protein, a parameter that is yet to be measured experimentally.
For shorter lifetimes, the model does not satisfy the stability constraint: Instead of preserving its shape at different nuclear densities, the gradient is amplified at the pole and attenuated in the midbody region. This is a common property of problems with diffusion and uniform degradation. For the intermediate ranges of the Bcd lifetimes (between 5 and 100 min), there is a correlation between the lifetime and the equilibrium constant that characterizes nucleocytoplasmic shuttling: shorter lifetimes lead to smaller value of equilibrium constant. This is to be expected, since, by reducing the fraction of time spent in the nucleus, the system reduces the gradient sharpening effect.
With the introduction of finite Bcd lifetime (however long it might be), the model acquires a true steady state, a feature that is absent in the model with no Bcd degradation. Thus, we asked how closely this steady state is approached on the time scale of the gradient formation. To explore this issue we carried out the following test. For every value of the Bcd lifetime consistent with the experimentally observed gradient dynamics, we generated an ensemble of remaining model parameters. For each of these parameter sets, we calculated the steady state value of the nuclear Bcd concentration at 50% of the embryo length, which corresponds to the location of the expression boundary of Hb, a well-studied transcriptional target of Bcd (Crauk and Dostatni, 2005; Driever and Nusslein-Volhard, 1989; Houchmandzadeh et al., 2002).
Next, we looked at the time required for the gradient to approach this steady state in cycle 14. For the localized source or the sharply distributed source, we found that for all acceptable values of Bcd lifetime, it takes at least 90 min into cycle 14 to approach the final steady state. For the shallow source, a small number of parameter vectors are consistent with the system approaching steady state within 10–15 min. This can be understood based on the fact that with a shallow source, the molecules don’t diffuse very far and hence, can be trapped in the nucleus relatively faster, thus approaching the steady state quickly. However, even with the shallow source, most parameter vectors predict that it takes more than 60 min to reach steady state. Based on this, we conclude that it is unlikely that the system reaches the steady state on the time scale relevant for the formation of the gradient.
Discussion
We proposed a hybrid model for the dynamics of the Bcd morphogen gradient. Our model combines a continuum description of the early syncytium with a compartmental description of nucleocytoplasmic shuttling and transport during the last five nuclear divisions. The model contains four dimensionless parameters that characterize the lateral spread of Bcd during the first nine cycles, the inter-compartmental transport in the late syncytium, and the rates of nuclear import and export. Overall, we conclude that such a model provides an adequate mathematical description of the known processes that contribute to the Bcd gradient formation, and constitutes a viable alternative to the predominant PDE-based approaches.
In future work our model can be extended to provide increasingly accurate representations of both the syncytium and the Bcd gradient. Possible extensions include a more realistic description of the nucleocytoplasmic shuttling (Kopito and Elbaum, 2007), convection in the early syncytium (Hecht et al., 2009), disorder in the spatial arrangements of nuclei (Yohn et al., 2003), and cell cycle-dependent changes of the model parameters. Quantitative understanding of the possible effects of these factors is essential in exploring the scaling properties of the gradient and its behavior in the wild type and mutant backgrounds. We note that while the roles of the macroscopic shape of the embryo and cell-cycle dependent rate constants can be readily explored using PDE-based models, modeling the effects of disorder in nuclear positions is much more straightforward within the proposed compartmental framework.
Our final note is related to the computational efficiency of model inversion studies with spatially distributed models. The model of the Bcd gradient presented here had only four parameters, clearly a consequence of the large number of assumptions and approximations we made in its formulation. A more complex model of the Dl morphogen gradient had nine dimensionless parameters and could also be inverted without difficulty. Thus, models of individual maternal morphogen gradients, Bcd, Dl, and the Mitogen Activated Protein Kinase (MAPK) signaling gradient that patterns the terminal regions of the embryo (Coppey et al., 2008), can be used as an efficient tool for constraining the ranges of individual rate constants (Shvartsman et al., 2008). A more complex problem arises when one considers nonlinear interactions between different maternal patterning systems. As an example, MAPK phosphorylates Bcd, an effect that influences both the transcriptional activity of Bcd and the MAPK signaling gradient itself (Kim et al., 2010). Even the simplest model for the interaction of the anterior and terminal systems has more than a dozen uncertain parameters. While computationally challenging, analysis of such models is essential in order to quantitatively understand how the joint action of maternal morphogen gradients specifies gene expression boundaries in the embryo.
Supplementary Material
Figure 4.
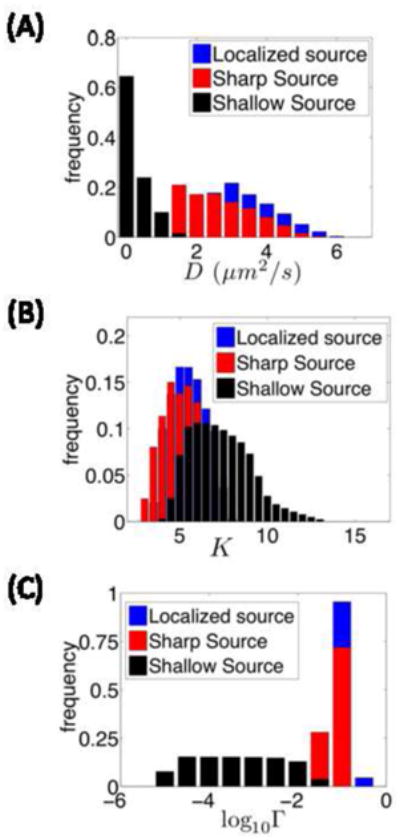
Distribution of the acceptable values of the diffusivity (A), equilibrium constant for nucleocytoplasmic shuttling (B) and intercompartmental transport (C) for the model with the Bicoid production sources with different levels of localization (see text for details).
Footnotes
Publisher's Disclaimer: This is a PDF file of an unedited manuscript that has been accepted for publication. As a service to our customers we are providing this early version of the manuscript. The manuscript will undergo copyediting, typesetting, and review of the resulting proof before it is published in its final citable form. Please note that during the production process errors may be discovered which could affect the content, and all legal disclaimers that apply to the journal pertain.
References
- Aegerter-Wilmsen T, Aegerter CM, Bisseling T. Model for the robust establishment of precise proportions in the early Drosophila embryo. Journal of Theoretical Biology. 2005;234:13–19. doi: 10.1016/j.jtbi.2004.11.002. [DOI] [PubMed] [Google Scholar]
- Coppey M, Berezhkovskii AM, Kim Y, Boettiger AN, Shvartsman SY. Modeling the Bicoid gradient: diffusion and reversible nuclear trapping of a stable protein. Dev Biol. 2007;312:623–630. doi: 10.1016/j.ydbio.2007.09.058. [DOI] [PMC free article] [PubMed] [Google Scholar]
- Coppey M, Boettiger AN, Berezhkovskii AM, Shvartsman SY. Nuclear trapping shapes the terminal gradient in the Drosophila embryo. Curr Biol. 2008;18:915–919. doi: 10.1016/j.cub.2008.05.034. [DOI] [PMC free article] [PubMed] [Google Scholar]
- Crauk O, Dostatni N. Bicoid determines sharp and precise target gene expression in the Drosophila embryo. Curr Biol. 2005;15:1888–1898. doi: 10.1016/j.cub.2005.09.046. [DOI] [PubMed] [Google Scholar]
- DeLotto R, DeLotto Y, Steward R, Lippincott-Schwartz J. Nucleocytoplasmic shuttling mediates the dynamic maintenance of nuclear Dorsal levels during Drosophila embryogenesis. Development. 2007;134:4233–4241. doi: 10.1242/dev.010934. [DOI] [PubMed] [Google Scholar]
- Driever W, Nusslein-Volhard C. A Gradient of Bicoid Protein in Drosophila Embryos. Cell. 1988;54:83–93. doi: 10.1016/0092-8674(88)90182-1. [DOI] [PubMed] [Google Scholar]
- Driever W, Nusslein-Volhard C. The bicoid protein is a positive regulator of hunchback transcription in the early Drosophila embryo. Nature. 1989;337:138–143. doi: 10.1038/337138a0. [DOI] [PubMed] [Google Scholar]
- Ephrussi A, St Johnston D. Seeing is believing: The bicoid morphogen gradient matures. Cell. 2004;116:143–152. doi: 10.1016/s0092-8674(04)00037-6. [DOI] [PubMed] [Google Scholar]
- Goering LM, Hunt PK, Heighington C, Busick C, Pennings PS, Hermisson J, Kumar S, Gibson G. Association of orthodenticle with Natural Variation for Early Embryonic Patterning in Drosophila melanogaster. Journal of Experimental Zoology Part B-Molecular and Developmental Evolution. 2009;312B:841–854. doi: 10.1002/jez.b.21299. [DOI] [PMC free article] [PubMed] [Google Scholar]
- Gregor T, Bialek W, de Ruyter van Steveninck RR, Tank DW, Wieschaus EF. Diffusion and scaling during early embryonic pattern formation. Proc Natl Acad Sci U S A. 2005;102:18403–18407. doi: 10.1073/pnas.0509483102. [DOI] [PMC free article] [PubMed] [Google Scholar]
- Gregor T, Wieschaus E, McGregor AP, Bialek W, Tank DW. Stability and Nuclear Dynamics of the Bicoid Morphogen Gradient. Cell. 2007;130:141–153. doi: 10.1016/j.cell.2007.05.026. [DOI] [PMC free article] [PubMed] [Google Scholar]
- Hecht I, Rappel WJ, Levine H. Determining the scale of the Bicoid morphogen gradient. Proceedings of the National Academy of Sciences of the United States of America. 2009;106:1710–1715. doi: 10.1073/pnas.0807655106. [DOI] [PMC free article] [PubMed] [Google Scholar]
- Houchmandzadeh B, Wieschaus E, Leibler S. Establishment of developmental precision and proportions in the early Drosophila embryo. Nature. 2002;415:798–802. doi: 10.1038/415798a. [DOI] [PubMed] [Google Scholar]
- Kanodia JS, Rikhy R, Kim Y, Lund VK, Delotto R, Lippincott-Schwartz J, Shvartsman SY. Dynamics of the Dorsal morphogen gradient. Proc Natl Acad Sci. 2009;106:21707–21712. doi: 10.1073/pnas.0912395106. [DOI] [PMC free article] [PubMed] [Google Scholar]
- Kim Y, Coppey M, Grossman R, Ajuria L, Jimenez G, Paroush Z, Shvartsman SY. MAPK substrate competition integrates patterning signals in the Drosophila embryo. Curr Biol. 2010;20:446–451. doi: 10.1016/j.cub.2010.01.019. [DOI] [PMC free article] [PubMed] [Google Scholar]
- Kopito RB, Elbaum M. Reversibility in nucleocytoplasmic transport. Proceedings of the National Academy of Sciences of the United States of America. 2007;104:12743–12748. doi: 10.1073/pnas.0702690104. [DOI] [PMC free article] [PubMed] [Google Scholar]
- Lucchetta EM, Vincent ME, Ismagilov RF. A precise Bicoid gradient is nonessential during cycles 11–13 for precise patterning in the Drosophila blastoderm. PloS One. 2008;3:e3651. doi: 10.1371/journal.pone.0003651. [DOI] [PMC free article] [PubMed] [Google Scholar]
- Manu, Surkova S, Spirov AV, Gursky VV, Janssens H, Kim AR, Radulescu O, Vanario-Alonso CE, Sharp DH, Samsonova M, Reinitz J. Canalization of Gene Expression in the Drosophila Blastoderm by Gap Gene Cross Regulation. Plos Biology. 2009;7:591–603. doi: 10.1371/journal.pbio.1000049. [DOI] [PMC free article] [PubMed] [Google Scholar]
- McGregor AP. How to get ahead: the origin, evolution and function of bicoid. Bioessays. 2005;27:904–913. doi: 10.1002/bies.20285. [DOI] [PubMed] [Google Scholar]
- Reinitz J. Developmental biology: a ten per cent solution. Nature. 2007;448:420–421. doi: 10.1038/448420a. [DOI] [PubMed] [Google Scholar]
- Sample C, Shvartsman SY. Multiscale modeling of diffusion in the early Drosophila embryo. Proc Natl Acad Sci. 2010 doi: 10.1073/pnas.1001139107. In press. [DOI] [PMC free article] [PubMed] [Google Scholar]
- Shvartsman SY, Coppey M, Berezhkovskii AM. Dynamics of maternal morphogen gradients in Drosophila. Curr Opin Genet Dev. 2008;18:342–347. doi: 10.1016/j.gde.2008.06.002. [DOI] [PMC free article] [PubMed] [Google Scholar]
- Spirov A, Fahmy K, Schneider M, Frei E, Noll M, Baumgartner S. Formation of the bicoid morphogen gradient: an mRNA gradient dictates the protein gradient. Development. 2009;136:605–614. doi: 10.1242/dev.031195. [DOI] [PMC free article] [PubMed] [Google Scholar]
- Weil TT, Parton R, Davis I, Gavis ER. Changes in bicoid mRNA anchoring highlight conserved mechanisms during the oocyte-to-embryo transition. Current Biology. 2008;18:1055–1061. doi: 10.1016/j.cub.2008.06.046. [DOI] [PMC free article] [PubMed] [Google Scholar]
- Wolpert L, Beddington R, Jessell T, Lawrence P, Meyerowitz E, Smith J. Principles of development. 2. Oxford University Press; Cambridge: 2002. [Google Scholar]
- Yohn CB, Pusateri L, Barbosa V, Lehmann R. l(3)malignant brain tumor and three novel genes are required for Drosophila germ-cell formation. Genetics. 2003;165:1889–1900. doi: 10.1093/genetics/165.4.1889. [DOI] [PMC free article] [PubMed] [Google Scholar]
Associated Data
This section collects any data citations, data availability statements, or supplementary materials included in this article.