

Abstract
The pH-sensitive GFP variant pHluorin is typically fused to the extracellular domain of transmembrane proteins to monitor endocytosis. Here we have turned pHluorin inside-out, and demonstrate that cytoplasmic fusions of pHluorin are effective quantitative reporters for endocytosis and MVB sorting. In yeast in particular, fusion of GFP and its variants on the extracellular side of transmembrane proteins can result in perturbed trafficking. In contrast, cytoplasmic fusions are well tolerated, allowing for the quantitative assessment of trafficking of virtually any transmembrane protein. Quenching of degradation-resistant pHluorin in the acidic vacuole permits quantification of extra-vacuolar cargo proteins at steady-state levels and is compatible with kinetic analysis of endocytosis in live cells.
Keywords: Endocytosis, pHluorin, multivesicular body, vacuole, cargo
Introduction
Although considerable advances have been made in understanding the mechanisms and regulation of vesicular transport, the development of novel techniques to visualize and quantify trafficking events will undoubtedly enhance our understanding of these processes. In particular, the Aequorea victoria green fluorescent protein (GFP) and its subsequent variants have been used extensively for studying protein, membrane and cytoskeletal dynamics in living cells. However, two important factors limit the use of GFP derivatives for quantitative analysis of cargo movement via vesicular trafficking: resistance to proteolysis in the lysosome (or vacuole in organisms such as Saccharomyces cerevisiae, which will be used in the present study) and insensitivity to changes in pH (1).
Persistent vacuolar fluorescence of GFP-cargo chimeras is readily apparent when monitoring trafficking through the endocytic pathway. Internalized cargo proteins are frequently targeted to the lysosome or vacuole for degradation, and the stable GFP tag often remains detectable for extended periods following degradation of the cargo protein. Thus, persistence of vacuolar GFP can confound whole-cell quantitative analysis of internalized cargo chimeras. Other fluorescent markers used in studies of endocytic trafficking, such as the lipophilic dye FM4-64 and the fluid-phase marker Lucifer yellow (2), have been used to follow endocytosis quantitatively. However, both dyes are used as general markers of endocytosis, and cannot be used to monitor trafficking of specific cargos. It is also worth noting that transmembrane cargo proteins that are commonly used for studying anterograde transport from the endoplasmic reticulum to the plasma membrane are frequently targeted for vacuolar proteolysis, thus GFP-tagged markers of numerous trafficking pathways besides endocytosis can render quantitative analyses difficult.
Several variants of GFP have been generated that, in theory, could reduce the accumulation of detectable fluorescence in the vacuole. For example, protease-sensitive variants, in which cleavage sites have been introduced into the sequence of GFP, are degraded upon delivery to sites of protease activity (3–5); however, their usefulness might be limited by the efficiency of cleavage. Instead, pH-sensitive GFP variants, known as pHluorins, display changes in excitation and/or emission properties depending on the pH of their local environment (6). Upon lowering of pH, ratiometric pHluorin shows a decrease in excitation at 395 nm with a concomitant increase in excitation at 475 nm, while ecliptic and super-ecliptic pHluorin show a pronounced dampening of excitation at both wavelengths (6, 7). In wild-type yeast, cytoplasmic pH has been determined to lie between 6.5 and 7 when cells are grown in media with a pH of 5.5, while vacuolar pH has been reported at 5.45 under similar growth conditions (8–10). Although ratiometric pHluorin fluorescence is readily detectable within the above pH range, ecliptic pHlourin as well as the super-ecliptic variant, which has enhanced fluorescence (7), are detectable at cytosolic pH but not at the lower pH within the vacuole.
In the present study, we sought to use super-ecliptic pHluorin as a tool for quantitative analysis of endocytosis in yeast. Past studies using pHluorin in mammalian cells have placed the tag on the extracellular face of transmembrane proteins such as synaptobrevin or the transferrin receptor (6, 11, 12). This approach is not amenable for use in yeast because GFP does not fold correctly in the ER lumen, which can lead to degradation, loss of function or mistargeting (13, 14). Instead, we reasoned that placing a cytoplasmic pHluorin tag on a cargo protein that reaches the vacuole via incorporation into multivesicular bodies (MVBs) would result in quenching of the fluorescent tag within the vacuole lumen. As shown in Figure 1, a cytoplasmic fluorescent tag remains exposed to the cytosol while at the plasma membrane, but is packaged into the lumen of internal vesicles within MVBs by the ESCRT machinery (15). Upon fusion with the acidic vacuole, the contents of the MVB are degraded, and although GFP fluorescence remains detectable, pHluorin is expected to lose fluorescence. In this study, we demonstrate that chimeric cargo proteins with a cytoplasmic pHluorin tag can be used for quantitative analysis of endocytosis in yeast cells. We also demonstrate that the pHluorin tag can be used to study the properties and dynamics of endocytic pathway intermediates by showing that the cytosolic contents of luminal MVB vesicles are acidified prior to MVB fusion with the vacuole.
Figure 1. Transit of cargo bearing a cytoplasmic tag through the endocytic pathway.

During endocytosis, transmembrane proteins retain their topology with respect to the cytoplasm and the extracellular space or vesicle lumen. However, membrane-associated proteins destined for degradation in the vacuole are often packaged into internal vesicles within the multivesicular body (MVB) via the ESCRT machinery. Upon fusion of MVBs with the vacuole, the internal vesicles are exposed to vacuolar hydrolases, and their contents are degraded. Although a cytoplasmic GFP tag (left) can be delivered to the vacuole in such a manner, it retains detectable fluorescence within the vacuole (denoted as a green tag) because of resistance to degradation by vacuolar proteases and changes in pH. In contrast, a cytoplasmic pHluorin tag (right), which is similarly resistant to degradation but is sensitive to changes in pH, loses its fluorescence (denoted as a black tag) upon incorporation into internal MVB vesicles and delivery to the acidic vacuole.
Results
pHluorin-tagged cargos are not fluorescent in the yeast vacuole
We generated pHluorin plasmids for PCR-based tagging of endogenous genes by homologous recombination, similar to those described by Longtine et al. (16), with selection using resistance genes for kanamycin (KANR) and nourseothricin (NATR). A GFP or pHluorin tag was introduced on the cytoplasmic C-terminus of the pheromone receptor Ste3p, a cargo protein that is constitutively internalized, incorporated into MVBs, and targeted to the vacuole lumen in wild-type (WT) cells (17). While vacuolar Ste3-GFP was clearly visible, very little GFP signal could be detected at the cell surface. In contrast, Ste3-pHluorin was barely visible at the cell surface, with almost no detectable signal in vacuoles (Figure 2). We occasionally observed small fluorescent punctae in Ste3-pHluorin cells, which might correspond to Golgi-derived vesicles in transit to the plasma membrane or newly internalized Ste3p destined for the vacuole.
Figure 2. Quenching of a pHluorin-tagged endocytic cargo protein in the vacuole lumen.

Wild-type (WT), ΔΔΔΔ + Ent1 and ΔΔΔΔ + ENTH1 cells tagged with C-terminal GFP (left panels) or pHluorin (right panels) at the STE3 locus. For each fluorescent tag, any adjustment to the brightness or contrast of images was identical for all strains in order to accurately reflect differences in fluorescence intensity. Furthermore, all images were captured under identical exposure conditions. Corresponding differential interference contrast (DIC) images are presented for all panels.
Mutations that impair endocytosis cause accumulation of detectable Ste3-pHluorin at the cell surface
We recently demonstrated that yeast cells lacking the four clathrin-binding endocytic adaptor proteins Ent1p, Ent2p, Yap1801p and Yap1802p (ΔΔΔΔ) and complemented with an epsin N-terminal homology (ENTH) domain are defective in endocytosis (18). The essential function of the ENTH domain appears to be involved in recruitment of Cdc42p regulatory components to the bud; thus, the essential function is unlikely to be a role solely in endocytosis (19). Consistent with the previous finding that a single copy of any full-length adaptor can complement internalization defects in ΔΔΔΔ cells (18, 20), localization of Ste3-GFP or Ste3-pHluorin inΔΔΔΔ + Ent1 cells was indistinguishable from WT (Figure 2). In contrast, Ste3-GFP and Ste3-pHluorin accumulated at the surface of ΔΔΔΔ cells expressing only the Ent1 ENTH domain (ENTH1). However, vacuolar Ste3-GFP was also detectable in ΔΔΔΔ + ENTH1 cells, whereas no vacuolar signal was seen with Ste3-pHluorin. Thus, increased steady-state levels of Ste3p at the cell surface can serve as an indicator of a reduced endocytic capacity.
Given the loss of detectable fluorescent signal in the vacuole of pHluorin-tagged cells, we next sought to quantify differences in extra-vacuolar Ste3p by measuring the total cellular fluorescence of Ste3-GFP and Ste3-pHluorin in WT, ΔΔΔΔ + Ent1 andΔΔΔΔ + ENTH1 cells. Fluorescence intensity of Ste3-GFP measured from images acquired with equivalent parameters was similar in all strains tested (p>0.4, Figure 3A), even though the ΔΔΔΔ + ENTH1 cells retained a greater proportion of Ste3p at the plasma membrane. Our inability to detect changes in total cellular fluorescence in GFP-tagged cells indicates that the persistent GFP fluorescence in the vacuole prevents accurate quantification of cargo retention at the surface of endocytic mutant cells. In contrast to Ste3-GFP, fluorescence intensity of pHluorin-tagged Ste3p in ΔΔΔΔ + ENTH1 cells was 2.5-fold greater than in WT or ΔΔΔΔ + Ent1 (Figure 3B). In addition, we assessed the expression level of Ste3-GFP or Ste3-pHluorin in WT, ΔΔΔΔ + Ent1 and ΔΔΔΔ + ENTH1 cells to determine whether changes in Ste3p expression levels could account for the observed differences in fluorescence levels. Unexpectedly, we found that Ste3p is expressed at a similar steady-state level in all strains tested, rather than an increased level in ΔΔΔΔ + ENTH1 cells arising from its retention at the cell surface (Figure 3C). This might indicate a compensatory mechanism for regulating the expression level of Ste3p when endocytosis is blocked. Thus, total cellular fluorescence levels of Ste3-pHluorin can indicate changes in the ability of cells to transport the receptor to the vacuole, and subcellular localization can be used to determine the step(s) within the secretory and/or endocytic pathway at which the block in transport occurs.
Figure 3. pHluorin used for quantification of steady-state levels of extravacuolar cargo by fluorescence microscopy.

Fluorescence intensity (in arbitrary units, a.u.) of WT, ΔΔΔΔ + Ent1 and ΔΔΔΔ + ENTH1 cells expressing Ste3-GFP (A) or Ste3-pHluorin (B). Values are presented as mean ± s.e.m., with the number of measured cells indicated in parentheses (One-way ANOVA with Tukey’s Multiple Comparison post-hoc test, ***p<0.001). (C) Western immunoblot of cell extracts from WT, ΔΔΔΔ + Ent1 and ΔΔΔΔ + ENTH1 strains tagged at the endogenous STE3 locus with either GFP or pHluorin and probed with anti-Ste3 or anti-GAPDH antibodies as indicated.
pHluorin-tagged cargo allows kinetic analysis of endocytosis in live cells
Because Ste3p is constitutively internalized and targeted to the vacuole, it is not amenable to kinetic analysis of endocytosis. To develop a fluorescence-based assay that more directly analyzes endocytosis, we instead used the methionine transporter Mup1, which is retained at the cell surface in the absence of methionine, but is rapidly internalized and targeted to the vacuole when methionine is present in the medium. Using this cargo, we predicted that we would observe a decrease in Mup1-pHluorin fluorescence with time in methionine-treated cells. We first compared the localization and fluorescence intensity of Mup1-GFP and Mup1-pHluorin in WT cells grown in the absence of methionine. Both Mup1-GFP and Mup1-pHluorin maintained relatively constant levels of Mup1p fluorescence during the 45-minute observation period, with very little accumulation of Mup1-GFP in the vacuole over the entire time frame (Figure 4, panels A and B). In contrast, methionine-treated cells showed a decrease in Mup1p at the cell surface, with a concomitant increase in the vacuole for Mup1-GFP. When we quantified the fluorescence intensity of pHluorin-tagged cells, we observed a rapid decrease in Mup1p fluorescence within 5–10 min, and intensity levels decreased by approximately 80% of the initial signal within 40–45 min. In Mup1-GFP cells, GFP fluorescence initially remained similar to cells grown in the absence of methionine for 20–25 min, and showed a gradual decrease in GFP fluorescence to approximately 50% of the initial signal by 45 min. While the initially slow kinetics of GFP fluorescence loss underscores the insensitivity of GFP to pH and proteolysis, the eventual loss of GFP fluorescence is likely due to the slow rate of GFP degradation in the vacuole. Overall, the pHluorin tag provides a distinct advantage for quantitative analysis of receptor-mediated endocytosis in live cells over the more widely used GFP tag, since quenching of the pHluorin tag is likely to occur more rapidly than degradation of protease-resistant molecules.
Figure 4. pHluorin used for kinetic analysis of endocytosis.

(A) Cells tagged with Mup1-GFP or Mup1-pHluorin were imaged in the absence (− Met) or presence (+ Met) of methionine at the indicated times. For each series, maximum and minimum intensities were normalized to the same level for each image in order to reflect changes in the relative Mup1p fluorescence over time. (B) Total cellular fluorescence of Mup1-GFP or Mup1-pHluorin was measured at 5 min intervals from cells growing in the absence (− Met, for Mup1-GFP and
  for Mup1-pHluorin) or presence (+ Met,
  for Mup1-GFP and
  for Mup1-pHluorin) of methionine. Fluorescence intensity was normalized to the first time point of the series, and values are presented as mean ± s.d. (n=6).
Vacuole hydrolase activity is not required for quenching of pHluorin fluorescence
Since either degradation or acidification of the pHluorin tag can each account for a loss in fluorescence signal, we made use of strains lacking the vacuolar hydrolases PEP4, PRB1 and PRC1 to determine whether reducing proteolytic activity within the vacuole lumen would result in increased cellular fluorescence. In protease-deficient (pep4Δ, prb1Δ, prc1Δ) cells, Ste3-GFP showed a localization similar to that seen in WT cells; however, the protease-deficient cells appeared brighter, presumably due to stabilization of GFP that failed to be degraded in the vacuole (Figure 5A). In contrast, Ste3-pHluorin was not readily detectable in the vacuole of either WT or protease-deficient strains, and fluorescence intensity did not appear to be enhanced in the protease-deficient Ste3-pHluorin cells compared to WT Ste3-pHluorin cells. Furthermore, quantification of total cellular Ste3-GFP or Ste3-pHluorin fluorescence confirmed that Ste3-GFP fluorescence intensity was nearly twice as high in protease-deficient cells compared to WT (Figure 5B). In contrast, Ste3-pHluorin intensity was similar in both WT and protease-deficient cells, and both pHluorin strains had much lower fluorescence intensity than the equivalent GFP-tagged strains. Western blotting showed an increase in Ste3p levels for the protease-deficient strain compared to WT, confirming that vacuole-targeted cargos fail to be properly degraded (Figure 5C). Thus, pH-dependent quenching of pHluorin is likely to be the predominant cause of fluorescence loss within the vacuole.
Figure 5. Detection of fluorescently-tagged Ste3p in protease-deficient cells.

(A) WT and protease-deficient (pep4Δ, prb1Δ, prc1Δ) cells expressing GFP-or pHluorin-tagged Ste3p were imaged by fluorescence microscopy, with maximum and minimum intensity adjustments applied equally to all samples to demonstrate the relative fluorescence intensity in each strain. (B) Total cellular fluorescence was measured for individual cells from the strains shown in panel A. Values are presented as mean ± s.e.m., with the total number of cells measured per condition indicated in parentheses. (C) Western immunoblot of cell extracts from WT and protease-deficient strains tagged with either GFP or pHluorin at the endogenous STE3 and probed with anti-Ste3 or anti-GAPDH antibodies as indicated.
Vacuole acidification and incorporation of cargo into MVB vesicles is required for quenching of the cytoplasmic pHluorin tag
We next asked whether the acidic environment of the yeast vacuole can lead to quenching of the pHluorin tag. To confirm that loss of Ste3-pHluorin fluorescence was due to pH-dependent quenching, we neutralized vacuolar pH using the v-ATPase inhibitor Bafilomycin-A1. Unlike vehicle (DMSO)-treated cells, Bafilomycin-A1 treatment restored vacuolar pHluorin fluorescence in WT cells (Figure 6A). Since Ste3p was tagged on its cytoplasmic face, incorporation into intraluminal MVB vesicles is likely required for acidification and quenching. To determine whether Ste3-pHluorin quenching occurs as a result of its packaging into MVBs, we expressed dominant-negative Vps4E233Q, an AAA-type ATPase required for the formation of luminal vesicles to produce an MVB (21). As expected, we found that both Ste3-GFP and Ste3-pHluorin localized to the vacuolar limiting membrane and to the pre-vacuolar class E vps compartment (Figure 6B). Together, these findings are consistent with vacuolar quenching of pHluorin downstream of incorporation into MVB luminal vesicles.
Figure 6. Manipulation of vacuolar pH or delivery into multivesicular bodies affects quenching of luminal pHluorin.
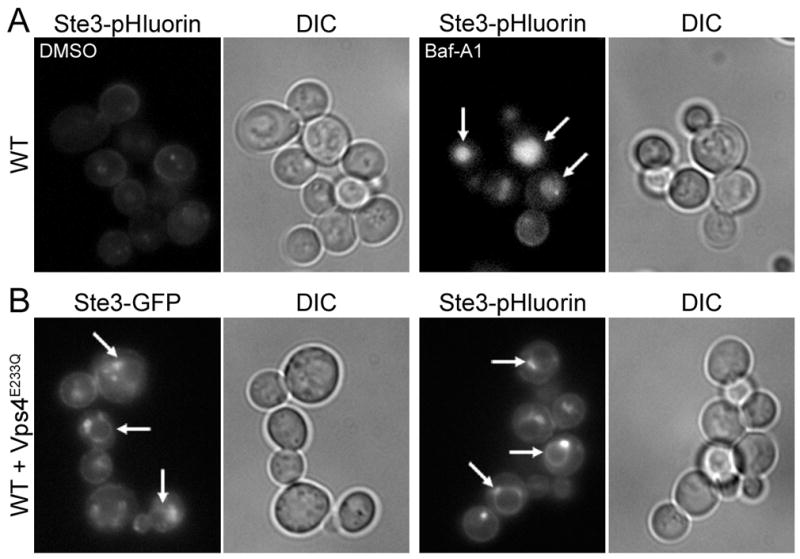
(A) pHluorin-tagged cells treated with vehicle (DMSO) or Bafilomycin-A1 (Baf-A1). Arrows indicate bright vacuoles. (B) GFP- and pHluorin-tagged cells expressing dominant-negative Vps4E233Q. Arrows indicate fluorescence at the vacuolar limiting membrane. Corresponding differential interference contrast (DIC) images are presented for all panels.
The lumen of internal MVB vesicles is an acidified compartment
Because the luminal contents of vesicles that are incorporated into MVBs are topologically equivalent to the cytosol, it is currently thought that they are protected from acidification until heterotypic fusion of the MVB with the vacuole occurs. Upon vacuole delivery, degradation of the lipid bilayer of MVB luminal vesicles is thought to allow for mixing of the luminal contents with the acidic and hydrolytic environment of the vacuole. However, whether acidification of the luminal content of MVB vesicles occurs prior to MVB-vacuole fusion has not been directly tested to our knowledge. Thus we sought to apply pHluorin-tagged cargos to address this question. If the interior of MVB luminal vesicles is acidified prior to heterotypic fusion with the vacuole, we predict that Ste3-pHluorin would be quenched upon incorporation into MVB vesicles. Neutralization of the acidic pH of MVBs using the v-ATPase inhibitor Bafilomycin-A1 would then restore fluorescence of the quenched fluorophore. In contrast, if the luminal environment has a pH that more closely matches that of the cytosol, we would predict that Ste3-pHluorin would normally be detectable at the MVB without a need for neutralization with Bafilomycin-A1.
We first assessed the co-localization of Ste3-GFP with mCherry-tagged Ist1, a protein localized to late endosomes/MVBs and functions in concert with the ESCRT-III machinery to promote sorting into MVBs (22). While MVBs labeled with Ist1-mCherry were often found in close proximity to the vacuole, Ist1 itself rarely, if ever, co-localized with Ste3-GFP in the vacuole (Figure 7). However, Ste3-GFP was readily detectable in MVBs and co-localized with Ist1-mCherry in DMSO-treated cells with normal, acidic vacuole pH, suggesting that cargo en route to the vacuole transits through these structures. Because the GFP tag is not sensitive to changes in pH, neutralization of the vacuole with Bafilomycin-A1 did not enhance the co-localization of Ste3-GFP with Ist1-mCherry. In contrast, Ste3-pHluorin did not co-localize with Ist1-mCherry under conditions of acidic vacuolar pH, indicating that the pHluorin tag is exposed to an acidic environment within MVB luminal vesicles as shown in Figure 1, and is unlikely to be on the limiting membrane facing the more neutral cytosol. Notably, treatment of cells with Bafilomycin-A1 restored co-localization of Ste3-pHluorin with Ist1-mCherry. Although internal Ste3-pHluorin-containing structures were occasionally seen in DMSO-treated cells, they rarely co-localized with Ist1-mCherry, and the rare structures that did contain both tagged proteins might correspond to maturing late endosomes with Ste3-pHluorin that had not yet been incorporated into MVB vesicles (data not shown). Thus, the lumen of MVB vesicles is likely acidified prior to fusion with the vacuole.
Figure 7. Acidificatioin of MVB vesicles detected with Ste3-pHluorin.

Cells endogenously tagged with Ste3-GFP or Ste3-pHluorin and expressing Ist1-mCherry were treated for 10 min in the presence of vehicle (DMSO) or Bafilomycin-A1 (Baf-A1) prior to imaging by fluorescence microscopy.
Discussion
Previous studies have made use of an extracellular pHluorin-tag for analyzing endocytic events such as transferrin receptor internalization in mammalian cells (6, 11, 12). Such approaches require modulation of extracellular pH in order to quench cell surface-localized receptors, leaving only newly-internalized receptors detectable. pHluorins have also been used to study synaptic vesicle fusion and recycling, as well as for measurement of pH in intracellular compartments (6). In yeast and in some other organisms, extracellular or luminal GFP tagging can be problematic because of inefficient folding of GFP within the ER lumen or subsequent mistargeting (13, 14). In our system, we have instead engineered chimeric Ste3p and Mup1p receptors with super-ecliptic pHluorin on the cytoplasmic face. As these chimeras become incorporated into MVBs, the pHluorin signal is dampened without a need for rapid changes in pH of the medium, which could cause unanticipated cellular responses.
To date, quantitative analysis of endocytosis in yeast has relied primarily upon biochemical assessment of internalization using radiolabeled markers such as uracil or the alpha mating pheromone, or by assessing the stability of endocytic cargo proteins such as Ste3p in cycloheximide-treated cells (23). While these approaches can be used to accurately detect changes in the rate of ligand uptake for mutants with reduced endocytosis, they are not compatible with real-time visualization and analysis of live cells. Our pHluorin-based approach allows us to quantify changes in the steady-state level of the constitutively-internalized endocytic cargo protein Ste3p and to monitor rates of internalization during receptor-mediated endocytosis of the methionine transporter Mup1 in living cells; we envision its use as an additional tool for higher throughput analyses such as flow cytometry and fluorescence-activated cell sorting (FACS). One distinct advantage of using a receptor such as Mup1p instead of the more widely-used biochemical alpha-factor uptake assay is that the alpha-factor receptor Ste2p is expressed only in haploid MATa cells, while Mup1p is expressed in both haploid mating types as well as in diploid cells.
Our ability to observe pre-vacuolar Ste3-pHluorin in Vps4E233Q-expressing cells that are defective in MVB biogenesis demonstrates that the cytoplasmic pHluorin-cargo chimeras can be used to study defects at specific trafficking stages prior to vacuole fusion, and our finding that Ste3-pHluorin is quenched in Ist1-labeled late endosome/MVB structures highlights the possible applications of a cytoplasmic pHluorin tag in studying MVB sorting. Notably, an in vitro reconstitution of MVB biogenesis has recently been described (24), thus the cytoplasmic pHluorin tag can provide an in vivo approach that is complementary to the reported biochemical technique.
Overall, we report a novel and versatile approach to quantitative analysis of endocytosis using cargo proteins bearing a cytosolic pHluorin tag to overcome the known proteolytic resistance and pH-insensitivity of GFP in the vacuole. The ability to use PCR-based approaches for tagging of genes by homologous recombination in yeast will facilitate quantitative analysis of a wide variety of cargo proteins. Although our studies were performed in yeast, the cytosolic pHluorin tag can also be employed in other systems. We envision the use of cytoplasmic pHluorin chimeras in diverse applications, including studies of specific cargo trafficking requirements, MVB biogenesis, vacuole/lysosome acidification, mutagenic screens in yeast, and RNAi-based screens in mammalian cells.
Materials and Methods
Strains and plasmids
The strains and plasmids used in this study are listed in tables 1 and 2, respectively.
Table 1.
Strains used in this study
| Strain | Genotype | Source |
|---|---|---|
| SEY6210 | MATα his3-Δ200 trp1-Δ901 leu2-3 ura3-52 lys2-801 suc2-Δ9 | Laboratory strain |
| BWY2858 | SEY6210; Ste3-GFP::KAN | This study |
| BWY2995 | SEY6210; Ste3-pHluorin::KAN | This study |
| BWY3036 | SEY6210; ent1Δ::LEU2 ent2Δ::HIS3 yap1801Δ::HIS3 yap1802Δ::LEU2 Ste3-pHluorin::KAN + pBW0768 | This study |
| BWY3037 | SEY6210; ent1Δ::LEU2 ent2Δ::HIS3 yap1801Δ::HIS3 yap1802Δ::LEU2 Ste3-pHluorin::KAN + pBW0778 | This study |
| BWY3399 | SEY6210; ent1Δ::LEU2 ent2Δ::HIS3 yap1801Δ::HIS3 yap1802Δ::LEU2 Ste3-GFP::KAN + pBW0768 | This study |
| BWY3400 | SEY6210; ent1Δ::LEU2 ent2Δ::HIS3 yap1801Δ::HIS3 yap1802Δ::LEU2 Ste3-GFP::KAN + pBW0778 | This study |
| BWY3749 | SEY6210; pep4::LEU2 prb1::HisG prc1::HIS3 Ste3-GFP::KAN | This study |
| BWY3750 | SEY6210; pep4::LEU2 prb1::HisG prc1::HIS3 Ste3-pHluorin::KAN | This study |
| BWY3817 | SEY6210; Mup1-GFP::KAN | This study |
| BWY3818 | SEY6210; Mup1-pHluorin::KAN | This study |
Table 2.
Plasmids used in this study
| Plasmid | Description | Details | Source |
|---|---|---|---|
| pBW0659 | pFA6a-GFP(S65T)-kanMX6 | C-terminal GFP(S65T)-KAN integrating plasmid | M.S. Longtine (16) |
| pBW0768 | pENT1 (TRP1) | pRS414::ENT1 (TRP1, CEN) | Laboratory plasmid |
| pBW0778 | pENTH1 (TRP1) | pRS414::ent1 (aa1-151) (TRP1, CEN) | Laboratory plasmid |
| pBW1571 | pFA6a-pHluorin-kanMX6 | C-terminal Super-ecliptic pHluorin-KAN integrating plasmid | This study |
| pBW1679 | pFA6a-pHluorin-natMX4 | C-terminal Super-ecliptic pHluorin-NAT integrating plasmid | This study |
| pMB103 | pVPS4E233Q | pRS416::VPS4E233Q (URA3, CEN) | M. Babst |
| pMB243 | pIST1-mCherry (URA3) | pRS426::Ist1-mCherry (URA3, 2μ) | M. Babst (25) |
| pCI-super-ecliptic synaptopHluorin | Synaptobrevin-pHluorin mammalian expression plasmid | G. Miesenbock (6) |
Genomic integration
For genomic integration of GFP or pHluorin at the STE3 locus, we designed primers as described in Longtine et al. (16), using the F2 and R1 plasmid-specific sequences. Transformations were performed according to standard procedures using the lithium acetate method, and integrations were confirmed by colony PCR and Western Immunoblot (data not shown).
Microscopy and quantification of fluorescence intensity
For imaging and flow cytometry analyses, cells were transformed with an empty pRS426 vector (URA3, 2μ) or with dominant-negative Vps4E233Q for experiments assessing Ste3p incorporation into MVBs. Additionally, ΔΔΔΔ cells, which require an ENTH domain for viability, were transformed with Ent1 (TRP1, CEN) or ENTH1 (TRP1, CEN) as indicated. Cells were maintained in synthetic medium (yeast nitrogen base supplemented with amino acids and 2% dextrose) lacking uracil (YNB-ura), and grown to mid-logarithmic phase prior to analysis. Unless otherwise stated, media buffered to a pH of 5.5 was used for experiments.
Images were captured using an Axiovert 200 inverted microscope (Carl Zeiss) equipped with a Cooke Sensicam (Cooke, Romulus, MI), an X-Cite 120 PC fluorescence illumination system, a 100X, 1.4 numerical aperture (NA) plan-Apochromat oil immersion lens, and SlideBook 4.2 software. All images within an experiment were captured using identical exposure conditions, and modifications to brightness and contrast were applied equally among GFP- or pHluorin-tagged strains in order to maintain the relative fluorescence intensity between strains. For quantification of fluorescence intensity, 16-bit image files were analyzed in ImageJ v1.41n. Background subtraction was performed prior to measurement of integrated density, and values were corrected for cell size.
For Bafilomycin-A1 treatment, cells were transferred to YNB-ura medium buffered to pH 7.25 in 25 mM Tris-HCl containing either 10 μM Bafilomycin-A1 or an equivalent volume of vehicle (DMSO). Images were captured after 10 min of treatment.
Preparation of cell extracts
Cells grown to mid-logarithmic phase were washed in phosphate-buffered saline, prior to resuspension in Laemmli buffer containing 6 M urea. Cells were lysed by grinding with 0.4–0.6 mm glass beads, and proteins were then resolved by SDS-PAGE and detected by Western immunoblotting with rabbit anti-Ste3 and rabbit anti-GAPDH antibodies.
Methionine uptake assay
To perform kinetic analysis of endocytosis, cells expressing Mup1-GFP or Mup1-pHluorin were grown overnight in synthetic YNB medium lacking methionine (YNB -Met). Cells were then diluted to a density of 0.3–0.4 OD/ml in YNB -Met, and were grown to a density of 0.7–0.8 OD/ml. Cells were then seeded onto Concanavalin A-coated 8-well glass-bottomed chamber slides (LabTek) containing YNB -Met and were allowed to settle before imaging. Immediately before imaging, methionine was added to a concentration of 20 μg/ml, and images were then captured at 5-minute intervals for 45 min. During image acquisition, cells were maintained at a constant temperature of 30°C.
Acknowledgments
We would like to thank Markus Babst, Elizabeth Conibear, Gero Miesenbock and Tim Ryan for reagents used in this study. We are also grateful to William Gostic and Scott Johnson for help with preliminary studies, to Greg Payne for providing anti-Ste3 serum, and to Chris Burd, Michael Edidin, David Katzmann, Michael McCaffery, Johnny Ngsee and members of the Wendland laboratory for helpful discussions and comments. This work was funded by a grant from the National Institutes of Health (to BW, NIH R01 GM60979).
References
- 1.Bokman SH, Ward WW. Renaturation of Aequorea green-fluorescent protein. Biochem Biophys Res Commun. 1981;101:1372–1380. doi: 10.1016/0006-291x(81)91599-0. [DOI] [PubMed] [Google Scholar]
- 2.Vida TA, Emr SD. A new vital stain for visualizing vacuolar membrane dynamics and endocytosis in yeast. J Cell Biol. 1995;128:779–792. doi: 10.1083/jcb.128.5.779. [DOI] [PMC free article] [PubMed] [Google Scholar]
- 3.Barysheva OV, Fujii J, Takaesu G, Yoshida S-I. Application of unstable GFP variants to the kinetic study of Legionella pneumophila icm gene expression during infection. Microbiol. 2008;154:1015–1025. doi: 10.1099/mic.0.2007/013144-0. [DOI] [PubMed] [Google Scholar]
- 4.Mateus C, Avery SV. Destabilized green fluorescent protein for monitoring dynamic changes in yeast gene expression with flow cytometry. Yeast. 2000;16:1313–1323. doi: 10.1002/1097-0061(200010)16:14<1313::AID-YEA626>3.0.CO;2-O. [DOI] [PubMed] [Google Scholar]
- 5.Andersen JB, Sternberg C, Poulsen LK, Bjorn SP, Givskov M, Molin S. New unstable variants of green fluorescent protein for studies of transient gene expression in bacteria. Appl Environ Microbiol. 1998;64:2240–2246. doi: 10.1128/aem.64.6.2240-2246.1998. [DOI] [PMC free article] [PubMed] [Google Scholar]
- 6.Miesenbock G, De Angelis DA, Rothman JE. Visualizing secretion and synaptic transmission with pH-sensitive green fluorescent proteins. Nature. 1998;394:192–195. doi: 10.1038/28190. [DOI] [PubMed] [Google Scholar]
- 7.Sankaranarayanan S, De Angelis D, Rothman JE, Ryan TA. The use of pHluorins for optical measurements of presynaptic activity. Biophys J. 2000;79:2199–2208. doi: 10.1016/S0006-3495(00)76468-X. [DOI] [PMC free article] [PubMed] [Google Scholar]
- 8.Pena A, Ramirez J, Rosas G, Calahorra M. Proton pumping and the internal pH of yeast cells, measured with pyranine introduced by electroporation. J Bacteriol. 1995;177:1017–1022. doi: 10.1128/jb.177.4.1017-1022.1995. [DOI] [PMC free article] [PubMed] [Google Scholar]
- 9.Plant PJ, Manolson MF, Grinstein S, Demaurex N. Alternative mechanisms of vacuolar acidification in H+-ATPase-deficient yeast. J Biol Chem. 1999;274:37270–37279. doi: 10.1074/jbc.274.52.37270. [DOI] [PubMed] [Google Scholar]
- 10.Brett CL, Tukaye DN, Mukherjee S, Rao R. The yeast endosomal Na+(K+)/H+ exchanger Nhx1 regulates cellular pH to control vesicle trafficking. Mol Biol Cell. 2005;16:1396–1405. doi: 10.1091/mbc.E04-11-0999. [DOI] [PMC free article] [PubMed] [Google Scholar]
- 11.Merrifield CJ, Perrais D, Zenisek D. Coupling between clathrin-coated-pit invagination, cortactin recruitment, and membrane scission observed in live cells. Cell. 2005;121:593–606. doi: 10.1016/j.cell.2005.03.015. [DOI] [PubMed] [Google Scholar]
- 12.Gottfried I, Ehrlich M, Ashery U. HIP1 exhibits an early recruitment and a late stage function in the maturation of coated pits. Cell Mol Life Sci. 2009;66:2897–2911. doi: 10.1007/s00018-009-0077-4. [DOI] [PMC free article] [PubMed] [Google Scholar]
- 13.Eiden-Plach A, Zagorc T, Heintel T, Carius Y, Breinig F, Schmitt MJ. Viral preprotoxin signal sequence allows efficient secretion of green fluorescent protein by Candida glabrata, Pichia pastoris, Saccharomyces cerevisiae, and Schizosaccharomyces pombe. Appl Environ Microbiol. 2004;70:961–966. doi: 10.1128/AEM.70.2.961-966.2004. [DOI] [PMC free article] [PubMed] [Google Scholar]
- 14.Li J, Xu H, Bentley WE, Rao G. Impediments to secretion of green fluorescent protein and its fusion from Saccharomyces cerevisiae. Biotechnol Prog. 2002;18:831–838. doi: 10.1021/bp020066t. [DOI] [PubMed] [Google Scholar]
- 15.Hurley JH, Emr SD. The ESCRT complexes: structure and mechanism of a membrane-trafficking network. Annu Rev Biophys Biomol Struct. 2006;35:277–298. doi: 10.1146/annurev.biophys.35.040405.102126. [DOI] [PMC free article] [PubMed] [Google Scholar]
- 16.Longtine MS, McKenzie A, 3rd, Demarini DJ, Shah NG, Wach A, Brachat A, Philippsen P, Pringle JR. Additional modules for versatile and economical PCR-based gene deletion and modification in Saccharomyces cerevisiae. Yeast. 1998;14:953–961. doi: 10.1002/(SICI)1097-0061(199807)14:10<953::AID-YEA293>3.0.CO;2-U. [DOI] [PubMed] [Google Scholar]
- 17.Urbanowski JL, Piper RC. Ubiquitin sorts proteins into the intralumenal degradative compartment of the late-endosome/vacuole. Traffic. 2001;2:622–630. doi: 10.1034/j.1600-0854.2001.20905.x. [DOI] [PubMed] [Google Scholar]
- 18.Maldonado-Baez L, Dores MR, Perkins EM, Drivas TG, Hicke L, Wendland B. Interaction between Epsin/Yap180 adaptors and the scaffolds Ede1/Pan1 is required for endocytosis. Mol Biol Cell. 2008;19:2936–2948. doi: 10.1091/mbc.E07-10-1019. [DOI] [PMC free article] [PubMed] [Google Scholar]
- 19.Aguilar RC, Longhi SA, Shaw JD, Yeh L-Y, Kim S, Schon A, Freire E, Hsu A, McCormick WK, Watson HA, Wendland B. Epsin N-terminal homology domains perform an essential function regulating Cdc42 through binding Cdc42 GTPase-activating proteins. Proc Natl Acad Sci U S A. 2006;103:4116–4121. doi: 10.1073/pnas.0510513103. [DOI] [PMC free article] [PubMed] [Google Scholar]
- 20.Overstreet E, Chen X, Wendland B, Fischer JA. Either part of a Drosophila epsin protein, divided after the ENTH domain, functions in endocytosis of Delta in the developing eye. Curr Biol. 2003;13:854–860. doi: 10.1016/s0960-9822(03)00326-9. [DOI] [PubMed] [Google Scholar]
- 21.Babst M, Sato TK, Banta LM, Emr SD. Endosomal transport function in yeast requires a novel AAA-type ATPase, Vps4p. EMBO J. 1997;16:1820–1831. doi: 10.1093/emboj/16.8.1820. [DOI] [PMC free article] [PubMed] [Google Scholar]
- 22.Rue SM, Mattei S, Saksena S, Emr SD. Novel Ist1-Did2 complex functions at a late step in multivesicular body sorting. Mol Biol Cell. 2008;19:475–484. doi: 10.1091/mbc.E07-07-0694. [DOI] [PMC free article] [PubMed] [Google Scholar]
- 23.Dulic V, Egerton M, Elguindi I, Raths S, Singer B, Riezman H. Yeast endocytosis assays. Methods Enzymol. 1001;194:697–710. doi: 10.1016/0076-6879(91)94051-d. [DOI] [PubMed] [Google Scholar]
- 24.Tran JH, Chen C-J, Emr S, Schekman R. Cargo sorting into multivesicular bodies in vitro. Proc Natl Acad Sci U S A. 2009;106:17395–17400. doi: 10.1073/pnas.0909473106. [DOI] [PMC free article] [PubMed] [Google Scholar]
- 25.Dimaano C, Jones CB, Hanono A, Curtiss M, Babst M. Ist1 regulates Vps4 localization and assembly. 2008;19:465–474. doi: 10.1091/mbc.E07-08-0747. [DOI] [PMC free article] [PubMed] [Google Scholar]