Abstract
To reduce the number of invasive tissue biopsies and needle aspirations performed during cancer screenings, endo-microscopes can be used to image tissue in vivo. However, when optical fiber bundles are used to transmit the image, the resolution of such systems is limited by undersampling due to the spacing of the bundle's individual fibers for a given field of view. We propose a method to increase the sampling of an optical biopsy system and thereby improve the system's resolution. The method involves taking several images, shifting the object and fiber bundle slightly relative to each other from one image to the next. Multiple shifting patterns were evaluated to determine which provided the greatest increase in resolution. The shifted images are later realigned and recombined by a custom algorithm. By combining four shifted images of a USAF resolution target, we were able to measure an improvement in the resolution of the system from approximately 3.9 μm to 2.2 μm. When tested on cultured cells, a visible increase in detail was detectable. This technique can provide the basis for improving the diagnostic abilities of optical biopsy systems.
Keywords: endo-microscope, fiber bundle, undersampling, image reconstruction
1. INTRODUCTION
As early as 1964, researchers have been exploring ways to use fiber optics to form images of subcutaneous structures in vivo1. Today, there are systems which use fiber optics for optical coherence tomography (OCT)2, low coherence interferometry (LCI)3, fluorescence endoscopy4, confocal reflectance microscopy5, and white light micrsocopy6. The advantage of using fiber bundles as a means of transmitting light for in vivo optical imaging is that an image is relayed to a point away from the patient, allowing the probe tip to be relatively simple; this helps the procedure to be minimally invasive to the patient and improves the possibility of point of care diagnostics.
In order to characterize a region of interest and to differentiate between inflamed or infected tissues and cancerous tumors, it is necessary to optically resolve cellular features including morphology and subcellular architecture. Typically, this can only be accomplished through invasive procedures such as tissue biopsy or needle aspiration7–8. Such methods can be risky, costly, and time consuming, particularly as excised cells or tissue must be prepared for histological analysis. Optical biopsy systems seek to eliminate the need for excision of samples by inserting an optical waveguide into the region of interest and viewing the cells in an in vivo setting.
However, a significant problem with using fiber bundles for image transmission is that the minimum spacing between individual fibers can easily be larger than the optical resolution for a reasonable field of view (FOV), causing the object to be undersampled. When using a fiber bundle to image a small FOV at high resolution, the spacing between individual fibers becomes the limiting factor for the resolution of the system. This lowered resolution can make it difficult or impossible to determine subcellular features which are necessary for cancer detection and diagnosis. We aim to overcome this limitation through increased sampling by taking multiple images and performing computational post-processing.
The device used to test the proposed method is similar to a previously developed fiber endo-microscope9. The goal of this paper is to demonstrate the ability to improve the resolution capabilities of fiber microscopy so that it can become a more viable tool for imaging tissue in vivo. This was done by laterally shifting the sample in two dimensions while images were captured. The shifted images are then realigned and recombined into a single image. This shifting allows the sampling of the object to be increased compared to the number of individual fibers in the fiber bundle. When the images are recombined, the resolution limit imposed by the structure of the fiber bundle is mitigated.
2. OPERATION PRINCIPLE
In most systems which use a fiber bundle, the resolution is limited by the sampling rate imposed by the distance between individual fibers. As the sampling is increased, the resolution is improved. One possible application of improving resolution through increased sampling is in conjunction with a fiber confocal system. The inherent resolving power of a confocal system is limited when combined with a fiber bundle for in vivo imaging10, unless the sampling can be increased. The proposed method can also be used with a fiber endo-microscope which is designed to function without lenses, with the distal tip of the fiber bundle in direct contact with the tissue.
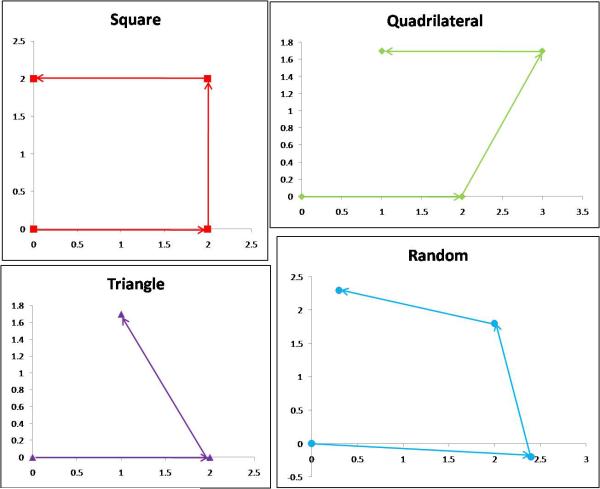
The sampling can be increased by shifting the fiber bundle and the sample relative to each other in various patterns. Patterns tested include square, triangle, quadrilateral, and random. The random pattern is similar to the square, except that the magnitude of the displacement was randomly generated each time; it is meant to simulate imprecise movement. At each point in the pattern, an image is captured. These images are later realigned and recombined, which effectively increases the sampling of the system.
In Figure 1, the left image is a cell seen through a 0.75 NA objective. The center image represents a single image of the sample as seen through a simulated fiber bundle. The right image represents the recombination of four simulated fiber bundle images shifted in a square pattern into a single, higher resolution image.
Figure 1.
Graphical representation of the reconstruction algorithm.
3. SPECIFIC METHODS
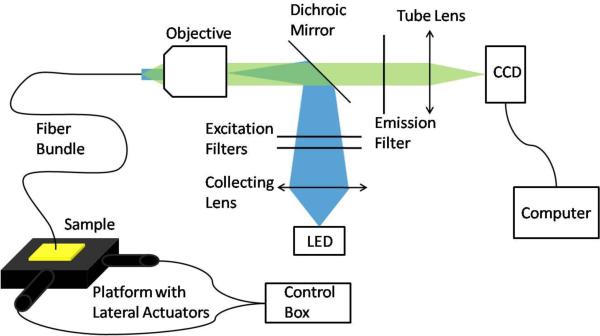
In order to test the proposed method, a fiber endo-microscope system and moveable platform were constructed (Figure 2). The system uses a 455 nm LED (M455L1, Thorlabs) as the illumination source. The light passes through two short-pass 450 nm filters (FES0450, Thorlabs) before reflecting off a dichroic mirror with a cutoff wavelength of 475 nm (475 DCXRU, Chorma). The excitation light passes through a 10× Olympus objective (RMS10×, Thorlabs) and travels down a fiber bundle (IGN-08/30, Sumitomo). Because the system is designed to provide epifluorescence illumination, the emission light returns through the fiber, enters the objective, and passes through the dichroic mirror. It then crosses a long pass 500 nm filter (FEL0500, Thorlabs) and is focused by a tube lens with a focal length of 150 mm (AC-254-150-A1, Thorlabs) onto the CCD sensor (GRAS-14S5M, Point Grey Research).
Figure 2.
Endo-microscope system with custom platform for lateral movement
The platform consists of two stages attached to electromechanical actuators (CMA-12PP, Newport). The actuators were directed by a control box (ESP300, Newport) which could move the stages with submicron precision. In order to verify the lateral displacement of the stages, two gauges (MT 25, Heidenhain) were placed in contact with the edge of each stage and connected to a control box (ND 720, Heidenhain). The sample to be imaged was secured on top of the two stages so that it could be shifted by a well-defined amount as measured by the stages. The fiber bundle was supported so that it could be held in contact with the sample without moving. This is actually an equivalent movement scheme, but opposite that which will be used for in vivo imaging, where the sample will be kept in place and the fiber bundle will be translated. This is a mock up to validate the principle; future systems will include miniature, integrated actuators.
The Newport stages were programmed to move in a variety of patterns including square, triangular, quadrilateral, and random (Figure 3). Because the distance between the fibers was 3.9 μm, half the distance between them is 1.95 μm. However, the stages cannot be displaced with 50 nm accuracy; the closest to 1.95 μm they can achieve is 2.0 μm. A variety of patterns were selected to experimentally determine whether some patterns are more effective than others at creating overlap and improving sampling.
Figure 3.
Shift locations for the proposed patterns. Note that the random pattern was similar to square, except that the actual shift values were uniform random values centered about ±2 μm with a range of ±0.5 μm, which changed after each round of image capture. All units are micrometers.
An image must be taken at each vertex in the pattern. Due to the difficulty in moving the fiber to precisely the same position each time, caused by friction between the sample and the fiber as well as imperfect repeatability in the displacement of the actuators, an automated algorithm was developed in Matlab to determine how each image was shifted relative to the others. The algorithm, which is based on a technique developed by Greg Ward11, realigns the images based on the change in position of the objects from one image to another and then recombines them.
The algorithm compares two images at a time, arbitrarily setting one as the reference image and the other as the test image which will be shifted relative to the reference in order to find the best alignment. First, a median filter reduces the contribution of the fiber cladding to the image. Next, a mean threshold bitmap (MTB) is computed for each image. An MTB is computed by first finding the average pixel intensity over the entire image, then creating a new bitmap where the value for each pixel is defined such that
| (1) |
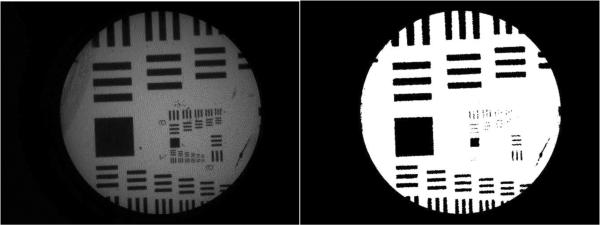
where “MTB” is a new bitmap, “i” and “j” are the x axis and y axis pixel indices, respectively (following the Matlab convention that the top left pixel is (1,1) and the x values increase to the right while the y values increase downward), “image” is the matrix representing the original image, and “mean” is the average intensity value of each pixel in “image.” The value of the MTB is zero if the corresponding pixel in the grayscale is less than the mean and one if the pixel is greater than or equal to the mean (Figure 4).
Figure 4.
Left image shows original single reference image. Right shows MTB image after the first noise reduction.
However, this leaves many stray pixels in the image, particularly near interfaces between light and dark regions. In order to reduce these stray pixels and improve the effectiveness of the alignment algorithm, a second filtration step is performed by the following
| (2) |
where the variables have the same definition as listed above. This has been demonstrated to reduce errant pixels and improve the accuracy of the alignment algorithm11. It should be noted that any filtration performed by the algorithm affects only the intermediate images; the images which are recombined at the end of the program are unaltered from when they were originally captured, except that one has been shifted relative to the other. The test MTB image is then repeatedly shifted and compared relative to the reference MTB image over a range of ±6 pixels in both the x axis and y axis (for a total of 49 shifts, including zero shift in either axis). The calculated magnification of the system is
| (3) |
where “ftube” is the focal length of the tube, “fobjective” is the focal length of the objective, and 8.3 is the total calculated magnification at the CCD. The measured magnification was 8.38, which is the value which will be used for further calculations. This means that each shift of ±2 μm corresponds to a shift of ±16.76 μm on the camera, or ±2.60 pixels (as each pixel is 6.45 μm on each side), which rounds to a range of ±3 pixels. Because only integer pixel shifts are performed by the program, the alignment may be off by as much as 0.5 pixels at the camera, which corresponds to 3.23 μm. Demagnifying this value gives a possible error of 0.38 μm at the object plane
It is important to note that there are two different frames of reference when discussing shifting the images: at the sample and within the program. At the sample, a shift along the positive x axis corresponds to driving stage 1 in actuator 1's positive direction; a shift along the positive y axis corresponds to driving stage 2 in actuator 2's positive direction. Within the algorithm, positive shifts in the x axis correspond to shifting the test image to the right, relative to the reference image; positive shifts in the y axis correspond to shifting the test image downward, relative to the reference image. If the reference image was captured while the sample was shifted fully in the positive x direction and the test image was captured while the sample was shifted fully in the negative x direction, this could corresponds to a shift of approximately −6 pixels in the program. Because they are arbitrarily chosen, the reference and test images could just as easily be in the opposite arrangement, and the shift would then be approximately +6 pixels. Because it is not known a priori how the shifting of the sample will correspond to shifting within the program, due to arbitrarily chosen reference images and possible rotation of the fiber bundle, a range of ±6 pixels is necessary in both the x and y directions.
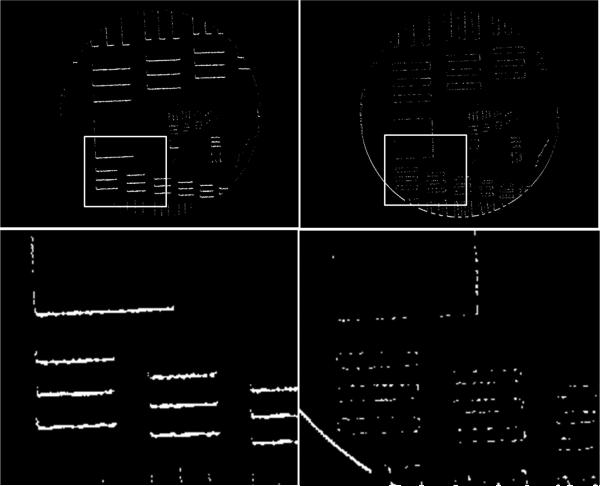
After each shift in the program, the reference and test MTB images were combined into a temporary matrix using exclusive-or (XOR). XOR returns false (0) when both pixels have the same value (which tends to happen more often if the objects are aligned) and returns true (1) if the pixel values are different. Thus, when the objects are more aligned, XOR returns more zeros (Figure 5).
Figure 5.
Two XOR images derived from images similar to the MTB image in Figure 4. The left XOR was calculated the test image and the reference image were unaligned while the right image represents when the two images are best aligned. The bottom images are subregions illustrated by the rectangles in the top images.
Because any shift of the test MTB image relative to the reference MTB image will prevent their matrix dimensions from agreeing in one or both axes, the test MTB is modified so that any region that does not line up with reference MTB is discarded and any portion of the reference MTB which does not have a corresponding region in the test MTB is compared to zeros. If the reference and test images were superimposed on top of each other without first aligning them, the fiber bundle and each individual fiber would line up correctly, but the objects which make up the image would not (Figure 5). The mismatch in pixel value in the unaligned image is due mostly to the objects not overlapping correctly. In the correctly aligned image, it is due mostly to noise caused by converting the original images to MTB images, as well as the fiber bundle itself no longer correctly aligning. The unaligned image has fewer mismatched pixels than the correctly aligned image (8272 compared to 15072). The realignment which produces the smallest number of mismatched pixels is taken to be the best alignment11.
The best alignment is found when the sum of the pixels of the temporary matrix is at a minimum. The minimum is found by performing
| (4) |
where “temp” is the matrix of XOR values of any given alignment of the reference and test MTB images, “MTBsum” is the total number of mismatched pixels in “temp”, and “MTBmin” is the smallest value of “MTBsum” that has been calculated thus far. Equation 4 is performed for every value of temp to find the global minimum. The smallest value of MTBmin among all possible alignments corresponds to the best alignment of the reference and test images. When the best alignment is found between two MTB images, the original reference and test images are aligned in the same way. Then, each pixel in the reference and test image is compared, and the higher intensity between the two is selected:
| (5) |
where “imagefinal” is the recombined image, “imagereference” is the reference image, and “imagetest” is the test image. This recombined image is then used as the reference image for a new test image, and the process is repeated until all images have been combined.
For preliminary studies, a 1951 USAF resolution target (NT38-257, Edmund Optics) with a fluorescent background was used to test the capabilities of the system. This provides a well known object to image and allows the resolution capabilities of the system can be easily measured. For later studies, cells of the 1483 cell line seeded on a microscope slide were used. To obtain fluorescence images, the cells were stained with solution of phosphate buffered saline (PBS) (P5493, Sigma) with 0.01% proflavine (P2508, Sigma) added into for 30 seconds before removing the stain and washing for 1 minute with PBS.
4. RESULTS
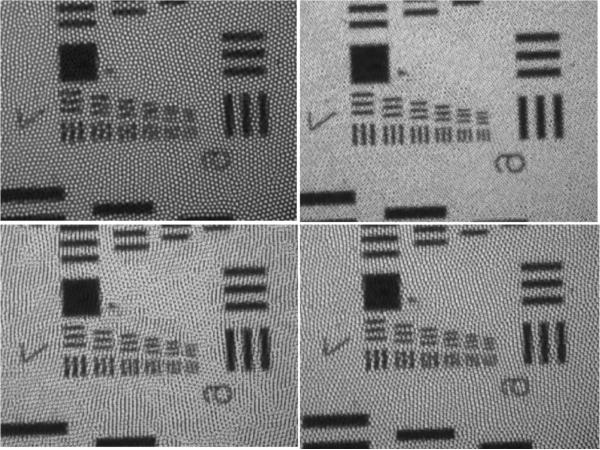
The resolution target was used to determine the resolution capabilities of the system before and after applying the reconstruction algorithm. The improvement in resolution associated with each shifting pattern was determined by comparing the smallest resolvable lines in the reconstructed image to the smallest resolvable lines in a single image. As can be seen in Figure 6, the smallest lines which can be completely resolved for a single image are group 7, element 1. This corresponds to 128 line pairs (lp)/mm and a resolution of approximately 3.9 μm. When four images which are shifted in a square pattern are recombined, the smallest resolvable lines are group 7, element 6. This corresponds to 228 lp/mm and a resolution of 2.2 μm. The quadrilateral pattern led to a recombined image where the smallest resolvable lines are group 7, element 4. This corresponds to 181 lp/mm and a resolution of about 2.8 μm. The random pattern led to a recombined image where the smallest resolvable lines are group 7, element 3. This corresponds to 161 lp/mm and a resolution of 3.1 μm. No significant improvement was seen with the triangle pattern.
Figure 6.
Images of 1951 USAF resolution target, from a single image or from a set of recombined images. Top left: single image. Top right: square pattern. Bottom left: quadrilateral pattern. Bottom right: random pattern. Notice that all elements of group 7 are resolvable in the top right image.
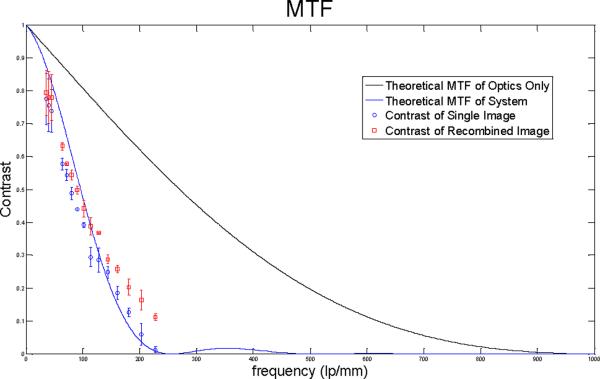
In Figure 7, the contrasts for the top two images in Figure 6 are displayed. These images were selected as they represent the lowest and highest resolutions achieved. The data for the graph was obtained by finding the average change in intensity across elements 2, 3, and 4 for group 5, and all elements in groups 6 and 7 by using the Measure function of ImageJ. The solid line is the theoretical MTF of the system without the fiber bundle while the dashed line is the theoretical MTF of the system when combined with a fiber bundle. The contrast for the rectangular elements is slightly higher than the contrast for sinusoidal elements of the actual MTF of the system. Notice that the square pattern consistently provides greater contrast than a single image, particularly at higher frequencies.
Figure 7.
Contrast of single image and square pattern recombination image compared to theoretical MTF.
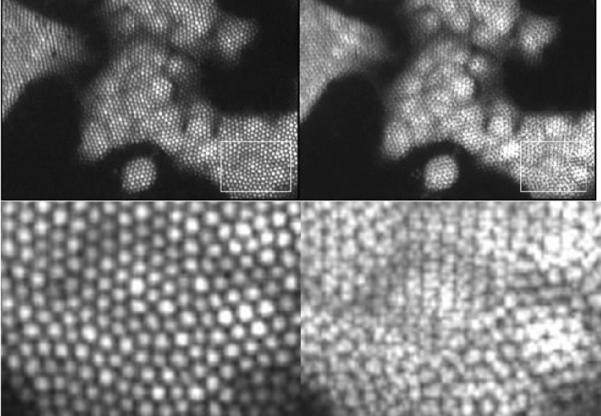
Because the square pattern was shown to provide the greatest improvement in resolution with the resolution target, it was selected as the pattern for imaging cells seeded on a microscope slide. The same reconstruction algorithm was used when imaging 1483 cells, and a visible increase in resolution can be seen (Figure 8). Notice that the bright region in the center of the recombination image, which corresponds to the cell's nucleus, can be differentiated from the darker cytoplasm around it. In the single image, this determination cannot be easily made.
Figure 8.
1483 cells stained with proflavine. Top left is a single image. Top right is an image which is formed from 4 recombined images shifted in a square pattern.
5. CONCLUSIONS
An image reconstruction algorithm has been shown that, when used in conjunction with a fiber bundle optical biopsy system, can improve the spatial resolution of the system beyond the limit imposed due to undersampling caused by the spacing of the individual fibers of the bundle. An improvement in resolution can increase the ability of the system to differentiate between cancerous tissue and cells which are only inflamed or infected, as well as to characterize cancer if it is detected. One way improving the resolution can do this is by enhancing the ability to calculate the nuclear/cytoplasmic ratio, which, when the value is increased, is an indicator of epithelial dysplasia8.
In order to perform the shifting pattern in an in vivo setting, we propose using a custom electromechanical actuator which is secured to the distal tip of the fiber bundle. Using an electromechanical actuator has the advantage of being mechanically simple to implement, once the actuator is developed.
5.1 Acknowledgements
The authors would like to thank Mark Pierce imaging advice and Vivian Mack for culturing and preparing cells. This research was supported by the National Institute of Health (NIH) under grant RO1 EB007594.
REFERENCES
- [1].Long C, Brushenko A, Pontarelli DA. The Fiber-Optics Hypodermic Microscope. Applied Optics. 1964;3(9):1031–1032. [Google Scholar]
- [2].Li X, Chudoba C, Ko T, Pitris C, Fujimoto JG. Imaging needle for optical coherence tomography. Optics Letters. 2000;25(20):1520–1522. doi: 10.1364/ol.25.001520. [DOI] [PubMed] [Google Scholar]
- [3].Reed WA, Yan MF, Schnitzer MJ. Gradient-index fiber-optic microprobes for minimally invasive in vivo low-coherence interferometry. Optics Letters. 2002;27(20):1794–1796. doi: 10.1364/ol.27.001794. [DOI] [PubMed] [Google Scholar]
- [4].Muldoon TJ, Anandasabapathy S, Maru D, Richards-Kortum R. High-resolution imaging in Barrett's esophagus: a novel, low-cost endoscopic microscope. GIE. 2008;68(4):737–744. doi: 10.1016/j.gie.2008.05.018. [DOI] [PMC free article] [PubMed] [Google Scholar]
- [5].Maintland KC, Gillenwater AM, Williams MD, El-Naggar AK, Descour MR, Richards-Kortum RR. In vivo imaging of oral neoplasia using a miniature fiber optic confocal reflectance microscope. Oral Oncology. 2008;44(11):1059–1066. doi: 10.1016/j.oraloncology.2008.02.002. [DOI] [PMC free article] [PubMed] [Google Scholar]
- [6].Yada T, Hiramatsu O, Kimura A, Goto M, Ogasawara Y, Tsujioka K, Yamamori S, Ohno K, Hosaka H, Kajiya F. In vivo observation of subendocardial microvessels of the beating porcine heart using a needle-probe videomicroscope with a CCD camera. Circ. Res. 1993;72(5):939–946. doi: 10.1161/01.res.72.5.939. [DOI] [PubMed] [Google Scholar]
- [7].Hait WN, August DA. Expert Consultations in Breast Cancer: Critical Pathways and Clinical Decision Making. Marcel Dekker; New York: 1999. pp. 28–29. [Google Scholar]
- [8].Werning JW. Oral Cancer: Diagnosis, Management, and Rehabilitation. Thieme Medical Publishers; New York: 2007. p. 120. [Google Scholar]
- [9].Muldoon TJ, Pierce MC, Nida DL, Williams MD, Gillenwater A, Richards-Kortum R. Subcellular-resolution molecular imaging within living tissue by fiber microendoscopy. Optics Express. 2007;15(25):16413–16423. doi: 10.1364/oe.15.016413. [DOI] [PMC free article] [PubMed] [Google Scholar]
- [10].Rouse AR, Kano A, Udovich JA, Kroto SM, Gmitro AF. Design and demonstration of a miniature catheter for a confocal microscope. Applied Optics. 2004;43(31):5763–5771. doi: 10.1364/ao.43.005763. [DOI] [PubMed] [Google Scholar]
- [11].Ward G. Fast, Robust Image Registration for Compositing High Dynamic Range Photographs from Handheld Exposures. Graphics Tools. 2003;8(2):17–30. [Google Scholar]


