Abstract
Chondroitin sulfate (CS) has an important role in cell division, in the central nervous system, and in joint related pathologies such as osteoarthritis. Due to the complex chemical structure and biological importance of CS, simple, sensitive, high-resolution, and robust analytical methods are needed for the analysis of CS disaccharides and oligosaccharides. An ion pairing, reversed-phase, ultraperformance liquid chromatography (IPRP-UPLC) separation, coupled to electrospray ionization mass spectrometry with ion trap mass analyzer was applied for the analyses of CS-derived disaccharides. UPLC separation technology utilizes small particle diameter, short column length, and elevated column temperature to obtain high resolution and sensitivity. Hexylamine (15 mM) was selected the optimal ion-pairing reagent.
Keywords: chondroitin sulfate, dermatan sulfate, glycosaminoglycans, disaccharides, ion pairing, reversed phase, LC-MS
1. Introduction
Proteoglycans, major components of extracellular matrixes and cell surfaces, consist of core proteins to which glycosaminoglycans (GAGs) are covalently linked. GAGs are linear polyanionic polysaccharides composed of repeating disaccharide units that can be divided into four main classes: hyaluronan; chondroitin sulfate (CS) and dermatan sulfate (DS); heparin and heparan sulfate; and keratan sulfate. CS/DS differ from other three classes as they contain disaccharides with galactosamine, and are known as galactosaminoglycans [1].
CS and DS consist of repeating disaccharide units of residues of uronic acid (β-D-glucuronic in CS and α-L-iduronic in DS) and N-acetyl-β-D-galactosamine (GalNAc) in alternating (1–4) and (1–3) linkages (Fig. 1). The GalNAc residues of most of the disaccharide units are substituted with 4- or 6-O-sulfo groups in CS-types A and B (DS) and CS-type C, respectively [2]. CS GAGs are polydisperse with molecular weight distribution depending on the tissue source, and having average molecular weights that vary from 10 to 140 kDa [3].
Fig. 1.
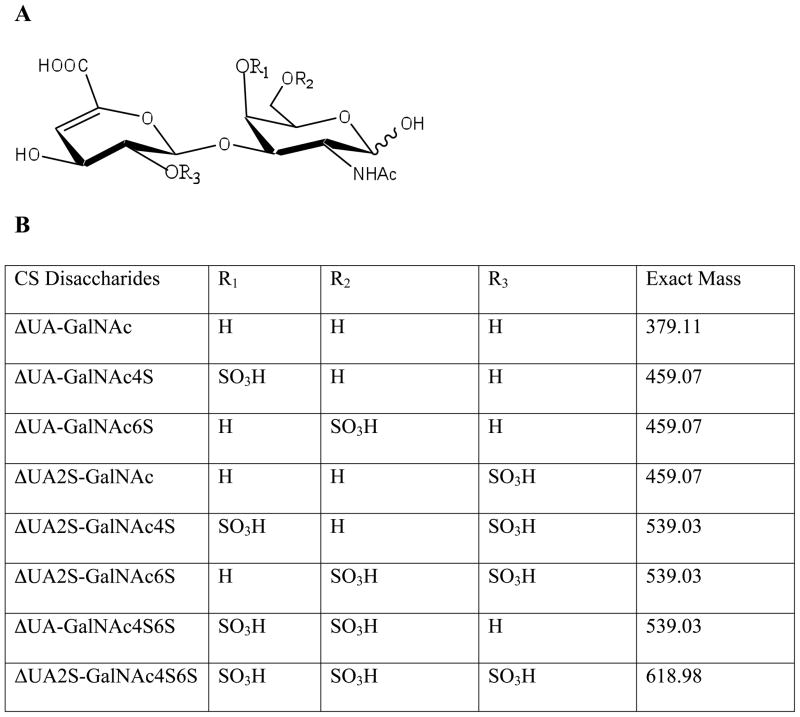
The chemical structure of the commercially available CS-derived disaccharides. A shows a general structure for the CS-derived disaccharide. B presents the pattern of sulfation and mass to charge ratio (m/z) for 8 different CS disaccharides.
CS plays an important role in fundamental biological processes, including cell division and in the central nervous system [4–6]. CS/DS hybrid chains are crucial to neuronal cell migration and maturation during brain development [5]. CS represents a low potency effective but treatment for the symptoms of osteoarthritis, the most common musculoskeletal disease, impacting 10% of the world’s population [7–10]. CS also has other potential therapeutic effects as an anti-inflammatory, an anti-oxidant, a reducer of allergic response, and in the treatment of urinary pathologies [11].
GAGs are anionic biopolymers owing to the presence of sulfo and carboxyl groups. Due to the biological significance of CS, rapid and sensitive analytical methods are required for their characterization at the level of disaccharide composition. Therefore, a number of researchers have applied various analytical methods to understand the role of CS in biological systems and for the diagnosis of CS related diseases [1,3,12,13]. Ion-pairing reversed-phase liquid chromatography (IPRP-LC) is one of the most powerful techniques for the analysis of GAG-derived oligosaccharides [14–20]. In this technique, ion pair reagents, typically amines with hydrophobic alkyl chains are added to the mobile phases and separation is performed on a reversed phase (RP)-liquid chromatography (LC) column. Common ion pairing reagents used for GAG analysis are tri-n-butylamine (TrBA) [15,16,18,19], n-pentylamine (PTA) [14], n-hexylamine (HXA) [14], tetrabutylammonium (Bu4N+) [15,17], tetrapropylammonium (Pr4N+) [15]. The use of ion-pairing reagents in the separation step also results in the removal of alkali or alkaline earth metal cations from samples, minimizing cation adduction, which often complicates the interpretations of ESI-MS. Unfortunately, some nonvolatile ion-pairing reagents can contaminate of the interface of MS. Higher concentrations of ion-pairing reagents, beneficial for optimized separation can also reduce the sensitivity of ESI-MS detection. Although ion-pairing chromatography offers an effective way to separate GAG-derived oligosaccharides, the separation times can be relatively long. The recent introduction of ultraperformance liquid chromatography (UPLC) offers an approach for overcoming these long analysis times. In UPLC, it is possible to use shorter columns (150 mm) packed with supports having small particle diameters (1.7 μm), and run these at higher flow rates to increase speed, efficiency, and resolution in comparison to other traditional high performance liquid chromatography (HPLC) methods [21–23].
The most widely used detection method coupled to LC for GAG-derived oligosaccharides has been UV absorption at 232 nm. While UV is simple to use it has low selectivity because common impurities often absorb light at the same wavelength as analyte. Fluorescence detection affords enhanced sensitivity but requires either pre-column or post-column derivatization [24]. Mass spectrometry offers a powerful alternative for the detection and structural characterization of GAG-derived oligosaccharides. Moreover, unlike UV and fluorescence, MS offers standard-free analysis by providing information on analyte identity. While both MALDI and ESI detectors have been used such analyses [25–27], the transfer of LC effluent to a target plate with matrix solution results in longer analysis time [28], making ESI detectors much easier to interface with LC. For higher sensitivity, nano-ESI can be employed [29]. Simultaneous detection by UV absorbance and MS offer the advantages of both detection methods and has been used in the current study [30].
We report a new method for the direct analysis of CS-derived disaccharides. This method provides a rapid, efficient, and highly sensitive analysis of these disaccharides. IPRP-UPLC is coupled with electrospray ionization ion trap mass spectrometry (ESI/MS). This method combines a chromatographic separation using reversed-phase BEH-C18 columns packed with 1.7 μm particles with both mass spectrometric and UV detection. The UPLC separation offers improved resolution, efficiency, and greater sensitivity for analyzing of CS-derived disaccharides. HXA is used as an ion-pairing reagent and 1,1,1,3,3,3-hexafluoro-2-propanol (HFIP) is used as organic modifier in mobile phase.
2. Experimental Section
2.1 Materials
Aliphatic amine, n-hexylamine (HXA) and organic modifier, 1,1,1,3,3,3-hexafluoro isopropanol (HFIP) were purchased from Sigma-Aldrich (St. Louis, MO) and were the highest purity available. Unsaturated disaccharides standards of CS/DS (ΔDi-0S, ΔUA-GalNAc; Δdi-4S, ΔUA-GalNAc4S; Δdi-6S, ΔUA-GalNAc6S; Δdi-UA2S, ΔUA2S-GalNAc; Δdi-diSB, ΔUA2S-GalNAc4S; Δdi-diSD, ΔUA2S-GalNAc6S; Δdi-diSE, ΔUA-GalNAc4S6S; Δdi-triS, ΔUA2S-GalNAc4S6S, where ΔUA is 4-deoxy-α-L-threo-hex-4-enopyranosyluronic acid, GalNAc is 2-acetamido-2-deoxy-D-galactose and S is sulfo.) were obtained from Seikagaku Corporation (Japan).
2.2 Methods
2.2.1 LC Separation
The separation was performed on an ACQUITY UPLC™ BEH C18 column (2. mm, 1.7 μm) (Waters Corporation, Milford, MA) using solution A for 10 min, followed by a linear gradient from 10 to 40 min of 0% to 50% solution B. The column temperature was maintained at 45 °C. The flow rate was 100 μl/min. Solution A and B for UPLC were 0 % and 75 % acetonitrile, respectively, containing the same concentration of 15 mM HXA as an ion-pairing reagent and 100 mM HFIP, as an organic modifier. Buffers were filtered using 0.2 μm membrane filters (Millipore). Detection was performed using both UV absorbance detector at 232 nm and ion trap mass detector.
2.2.2 Mass Spectrometry
The LC-MS analysis was performed on a LC-MS system (Agilent, LC/MSD trap MS). The column effluent entered the source of the ESI-MS for continuous detection by MS. The electrospray interface was set in positive ionization mode with the skimmer potential 40.0 V, capillary exit 40.0 V and a source of temperature of 350 °C to obtain maximum abundance of the ions in a full scan spectra (350–2000 Da, 10 full scans/s). Nitrogen was used as a drying (8 liters/min) and nebulizing gas (40 p.s.i.). The data was collected by UV and extracted ion chromatogram (EIC), respectively.
3. Results and Discussion
Separation optimization requires the resolution of eight CS-derived disaccharides (Figure 1), which depends on three main parameters: separation efficiency (N); separation selectivity (α); and capacity factor (k′).
Separation selectivity (α) can be optimized by changing the composition of the mobile and/or the stationary phase. Separation efficiency (N) can be optimized by changing column length, solvent velocities, packing uniformity, particle diameter, column temperature, and the flow rate. Capacity factor depend on the solvent strength [31].
In our optimization studies, the mobile phase, the stationary phase, column length, the particle diameter, mobile phase flow-rate, and column temperature were examined. By varying these parameters, separation and selectivity were optimized for CS-derived disaccharide analysis.
3.1. Effect of ion-pairing reagent on retention time and separation efficiency
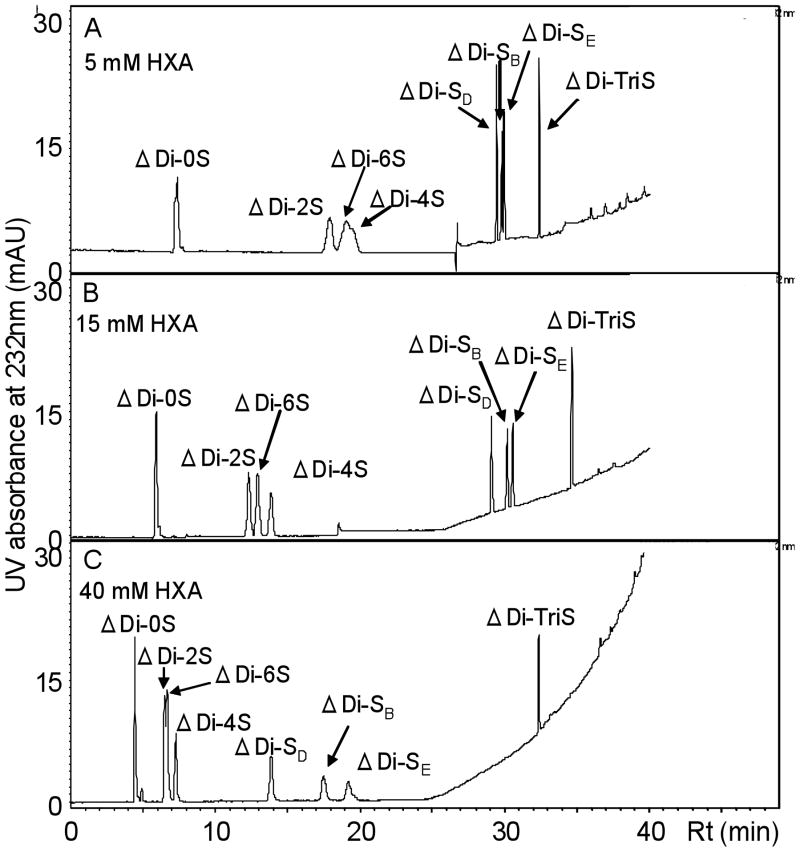
Mobile phase composition, (the concentration of ion-pairing reagent, HXA and organic modifier, HFIP) gradient profile, and buffer pH were evaluated for the separation of the eight CS disaccharides. The HFIP plays role as buffering acid to protonate the HXA since the ion-pairing reagent does not carry positive charge. HFIP converts HXA into the ammonium ion by decreasing the pH of the mobile phases. The concentration of HXA on capacity factor and the separation efficiency were evaluated at 5 mM, 15 mM, and 40 mM. The retention time decreases with increasing HXA concentration. While peaks eluted at shorter retention times using 40 mM HXA, ΔDi-2S and ΔDi-6S could not be separated. At 5 mM HXA, ΔDi-6S and ΔDi-4S could not be separated. However, 15 mM HXA provided excellent separation efficiency with good peak shapes for the CS-derived disaccharides (Figure 2).
Fig. 2.
The influence of various concentration of the ion-pair reagent (HXA) on the RPIP-UPLC separation of eight different CS disaccharide standards. Experimental conditions: an ACQUITY UPLC™ BEH C18 column (Waters, 2.1 × 150 mm, 1.7 μm) using solution A for 10 min, followed by a linear gradient from 10 to 40 min of 0% to 50% solution B. Solution A and B for UPLC were 0 % and 75 % acetonitrile, respectively, containing HXA (5, 15 and 40 mM, respectively, in panel A, B and C) as an ion-pair reagent and a fixed amount of HFIP (100 mM in panel A, B and C) as a buffering acid; detection wavelength 232 nm; flow rate 100 μl/min; injection volume 5 μl.
The mechanism of solute retention in IPRP-LC is mainly governed by the hydrophobic interactions between the analyte and the stationary phase. The basis of the separation in IPRP-LC is still controversial and two models, partition and adsorption, have been proposed as the separation process in the column chromatography [32]. In the partition model, the separation process can be explained by the formation of ion-pairs between the positively charged ion-pairing reagents and negatively charged CS disaccharides. In the case of adsorption model, positively charged ion-pairing reagents adsorb onto the stationary phase in the C18 column through their hydrophobic chain. This adsorption of ion-pairing reagents creates a pseudo ion-exchange support, resulting in the interaction between negatively charged CS disaccharides and already absorbed positively charged ion-pairing agents. Both cases predict our experimental results indicating that the retention time increases with increasing ion-pairing reagent concentration.
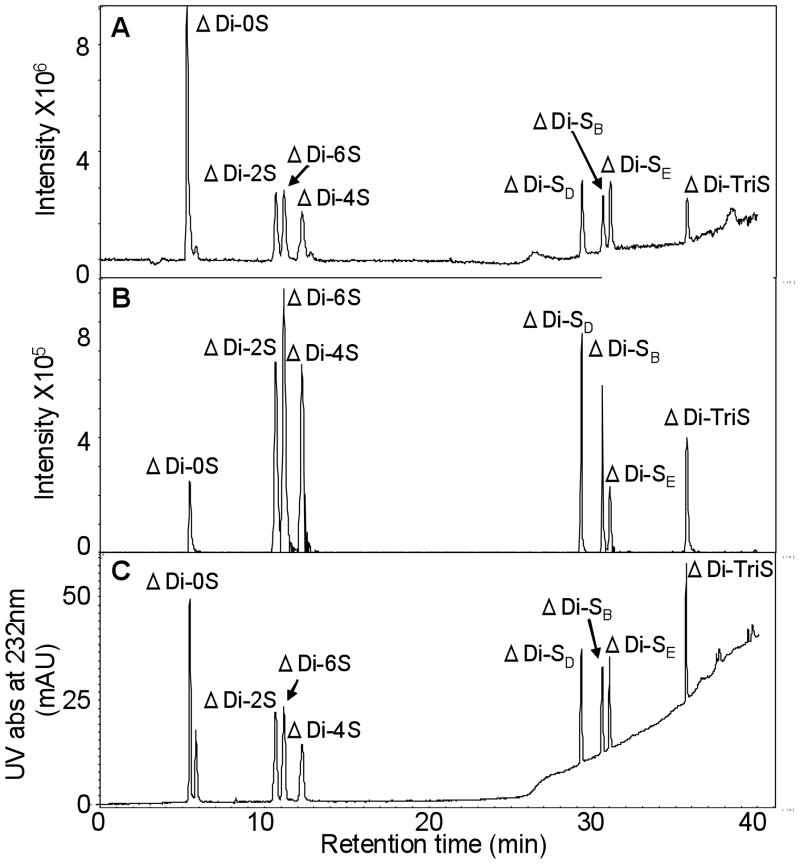
The resolution of eight different CS-derived disaccharides by IPRP-UPLC with ESI/MS detection has not previously been reported. Elution order depends on the number and position of sulfo groups that interact with HXA ion-pairing reagent, promoting hydrophobic interaction of the analyte with the stationary phase. CS trisulfated disaccharide elutes last from the column as it has the highest number of sulfo groups among eight CS disaccharides (Figure 3). In contrast, non-sulfated CS disaccharide elutes first because it has no sulfo groups and hence, it has weak ion-pairing interaction through its carboxyl group and HXA. An increased number of sulfo groups increases retention time, thus, the unsulfated disaccharide is followed by the three monosulfated disaccharides, the three disulfated disaccharides and finally the trisulfated disaccharide. The sulfo group position is a secondary factor that impacts the elution ordering. For example, among the monosulfated disaccharides the isomer with the 4-O-sulfo group in the galactosamine residue (ΔDi-4S) elutes last with the isomer with a 6-O-sulfo in the galactosamine residue (ΔDi-6S) eluting earlier and the isomer with 2-O-sulfo group in the uronic acid residue (ΔDi-2S) eluting earliest. This result suggests that the strength of interaction with the ion-pairing reagent clearly depends on sulfation position.
Fig. 3.
IPRP-UPLC chromatograms of 8 CS-derived disaccharide standards with mass and UV detection. Experimental conditions are the same as it described in Fig. 3. Detection relied on (A) total ion chromatogram (TIC), (B) EIC, (C) UV.
The 1.7 μm particle size bridged ethyl hybrid (BEH) UPLC column differs from a traditional 5-μm octadecyl-silica (C18) column. The BEH column is mechanically stronger and can be operated over an extended pH range (pH 1–12) while the C18 silica-based column begins to dissolve at pH values above 8.0, particularly at elevated temperature. The bridging of the ethyl groups in the silica matrix makes BEH columns much more resistant to high pH and elevated temperatures and, thus, is able to retain their separation characteristics for a longer time [23]. Thus, mobile phases at pH values in the range of 8.2 – 9.6 that cannot be used with silica-based C18 columns can be routinely used with BEH columns. Also the higher pH avoids presence of α-and β-anomers associated with a single disaccharide [33].
3.2 IPRP-UPLC Coupled to ESI-MS for Analysis of Chondroitin Sulfate Disaccharides in Positive Ion Mode
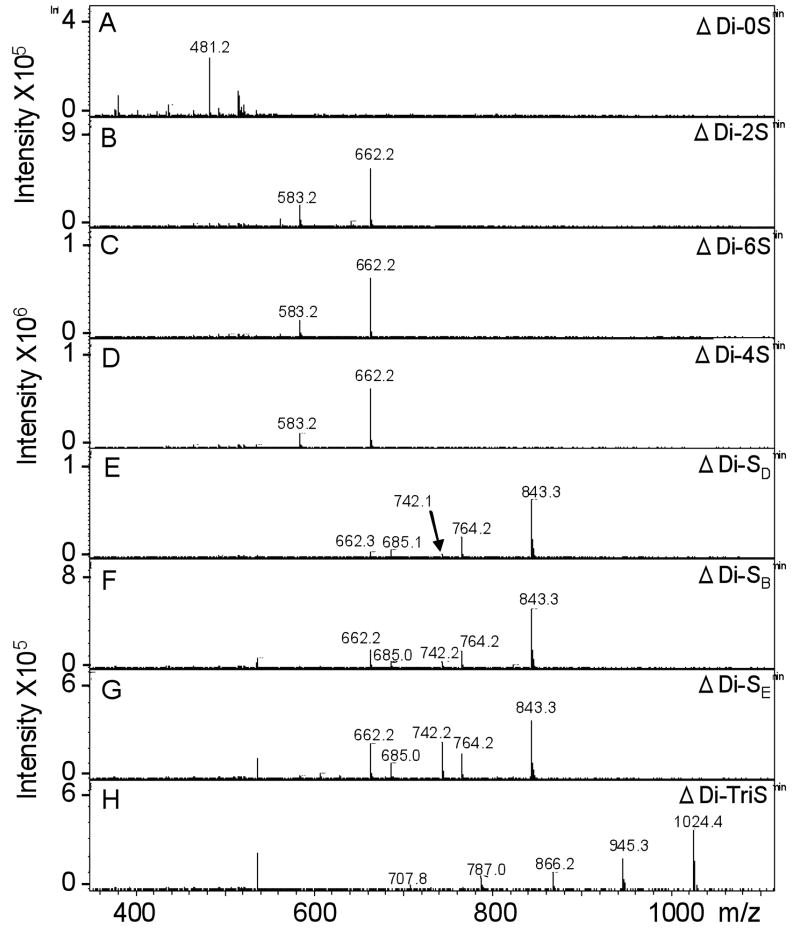
The ESI-MS analysis of CS disaccharides was performed in both positive-ion (Figure 5.) and negative-ion mode (not shown). Surprisingly, the analysis in the positive ion mode provides the best results. The number of HXAH+ moieties adducted varied based on the charge of each CS disaccharide. The non-sulfated disaccharide showed a molecular ion of m/z 481.2, corresponding to the addition of one HXAH+ and an H+ (Figure 4A). Monosulfated disaccharides (m/z 662.3) had two HXAH+ and an H+ (Figure 4B, C and D). Minor peaks at m/z 583.2, corresponding to the sodiated species [M-H+HXA+Na]+ were also observed in these spectra. Disulfated disaccharides with three HXAH+ and an H+ were observed at m/z 843.3 (Figure 4E, F and G). These spectra also showed minor molecular ions, corresponding to [M-2H+2HXA+Na]+ and [M-2H+2HXA+H]+ at m/z 764.2 and 742.2, respectively. In addition, fragment ion peaks, observed at m/z 685.0 and 662.2, corresponded to desulfonation and were assigned as [M-S-H+2HXA]+ and [M-S-2H+2HXA+Na]+, respectively. The MS spectrum of trisulfated disaccharide showed a major peak corresponding to the molecular ion with four HXAH+ and an H+ (Figure 4H). Minor peaks assigned as [M-3H+3HXA+Na]+, [M-3H+2HXA+2Na]+, [M-3H+HXA+3Na]+, and [M-3H+4Na]+ were also observed at m/z 945.3, 866.1, 787.0 and 707.8, respectively.
Fig. 5.
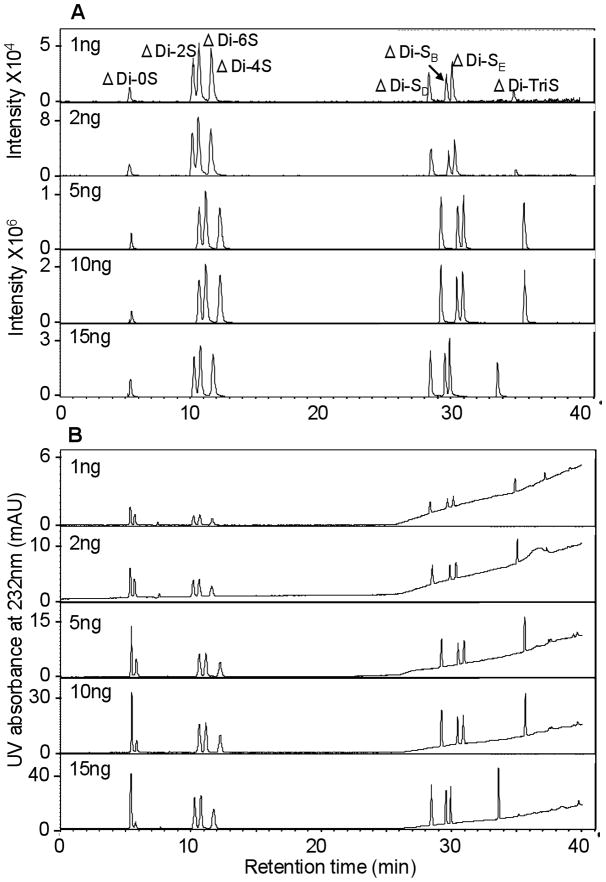
Sensitivity analysis of eight different CS disaccharide standards by mass (a) and UV detector (b) corresponding to injection of 1, 2, 5, 10, 15 ng of each of the standard disaccharides. Experimental conditions are the same as it described in Fig. 3.
Fig. 4.
Mass spectra of CS disaccharides. (A) ΔUA-GalNAc, (B) ΔUA2S-GalNAc, (C) ΔUA-GalNAc6S, (D) ΔUA-GalNAc4S, (E) ΔUA2S-GalNAc6S, (F) ΔUA2S-GalNAc4S, (G) ΔUA-GalNAc4S6S, (H) ΔUA2S-GalNAc4S6S.
CS disaccharides were prepared in sample at amounts of 1 ng, 2 ng, 5 ng, 10 ng, 15 ng and were analyzed by IPRP-UPLC-ESI-MS in the positive-ion mode to test the sensitivity and linearity of this method (Figure 5). The EIC and UV chromatograms of different amount of disaccharide standards showed less than 1 ng per disaccharide could easily be analyzed. The limit of detection (LOD) for disaccharides by EIC and UV were 150 pg and 300 pg, respectively.
4. Conclusions
This report describes an efficient separation CS-derived disaccharides relying on UPLC. This method provides excellent separation with low a limit of detection. Furthermore, there is no need for sample preparation or further purifications required for fluorescence detection. Online combination of IPRP-UPLC coupled to UV and ESI-MS offers a simple, efficient, and robust method for CS disaccharide analysis.
Acknowledgments
The authors are grateful to the National Institutes of Health (GM38060 and HL62244).
Footnotes
Publisher's Disclaimer: This is a PDF file of an unedited manuscript that has been accepted for publication. As a service to our customers we are providing this early version of the manuscript. The manuscript will undergo copyediting, typesetting, and review of the resulting proof before it is published in its final citable form. Please note that during the production process errors may be discovered which could affect the content, and all legal disclaimers that apply to the journal pertain.
References
- 1.Barroso B, Didraga M, Bischoff R. Analysis of proteoglycans derived sulphated disaccharides by liquid chromatography/mass spectrometry. J Chromatogr A. 2005;1080:43–48. doi: 10.1016/j.chroma.2005.03.020. [DOI] [PubMed] [Google Scholar]
- 2.Zaia J, McClellan JE, Costello CE. Tandem mass spectrometric determination of the 4S/6S sulfation sequence in chondroitin sulfate oligosaccharides. Anal Chem. 2001;73:6030–6039. doi: 10.1021/ac015577t. [DOI] [PubMed] [Google Scholar]
- 3.Zaia J, Li XQ, Chan SY, Costello CE. Tandem mass spectrometric strategies for determination of sulfation positions and uronic acid epimerization in chondroitin sulfate oligosaccharides. J Am Soc Mass Spectrom. 2003;14:1270–1281. doi: 10.1016/S1044-0305(03)00541-5. [DOI] [PubMed] [Google Scholar]
- 4.Sugahara K, Mikami T, Uyama T, Mizuguchi S, Nomura K, Kitagawa H. Recent advances in the structural biology of chondroitin sulfate and dermatan sulfate. Curr Opin Struct Biol. 2003;13:612–620. doi: 10.1016/j.sbi.2003.09.011. [DOI] [PubMed] [Google Scholar]
- 5.Sugahara K, Mikami T. Chondroitin/dermatan sulfate in the central nervous system. Curr Opin Struct Biol. 2007;17:536–545. doi: 10.1016/j.sbi.2007.08.015. [DOI] [PubMed] [Google Scholar]
- 6.Nandini CD, Sugahara K. Role of the sulfation pattern of chondroitin sulfate in its biological activities and in the binding of growth factors. Adv Pharmacol. 2006;53:253–279. doi: 10.1016/S1054-3589(05)53012-6. [DOI] [PubMed] [Google Scholar]
- 7.Lovu M, Dumais G, Du Souich P. Anti-inflammatory activity of chondroitin sulfate. Osteoarthritis and Cartilage. 2008;16:S14–18. doi: 10.1016/j.joca.2008.06.008. [DOI] [PubMed] [Google Scholar]
- 8.Katta J, Jin Z, Ingham E, Fisher J. Chondroitin sulphate: an effective joint lubricant? Osteoarthritis and Cartilage. 2009;17:1001–1008. doi: 10.1016/j.joca.2009.02.010. [DOI] [PubMed] [Google Scholar]
- 9.Reginster J, Heraud F, Zegels B, Bruyere O. Symptom and structure modifying properties of chondroitin sulfate in osteoarthritis. Mini-Rev Med Chem. 2007;7:1051–1061. doi: 10.2174/138955707782110088. [DOI] [PubMed] [Google Scholar]
- 10.Reichenbach S, Sterchi R, Scherer M, Trelle S, Bürgi E, Bürgi U, Dieppe PA, Jüni P. Meta-analysis: chondroitin for osteoarthritis of the knee or hip. Ann Intern Med. 2007;146:580–590. doi: 10.7326/0003-4819-146-8-200704170-00009. [DOI] [PubMed] [Google Scholar]
- 11.Lauder RM. Chondroitin sulphate: a complex molecule with potential impacts on a wide range of biological systems. Complement Ther Med. 2008;17:56–62. doi: 10.1016/j.ctim.2008.08.004. [DOI] [PubMed] [Google Scholar]
- 12.Chai W, Kogelberg H, Lawson AM. Generation and structural characterization of a range of unmodified chondroitin sulfate oligosaccharide fragments. Anal Biochem. 1996;237:88–102. doi: 10.1006/abio.1996.0205. [DOI] [PubMed] [Google Scholar]
- 13.McClellan JE, Costello CE, O’Conno PB, Zaia J. Influence of charge state on product ion mass spectra and the determination of 4S/6S sulfation sequence of chondroitin sulfate oligosaccharides. Anal Chem. 2002;74:3760–3771. doi: 10.1021/ac025506+. [DOI] [PubMed] [Google Scholar]
- 14.Doneanu CE, Chen W, Gebler JC. Analysis of oligosaccharides derived from heparin by ion-pair reversed-phase chromatography/mass spectrometry. Anal Chem. 2009;81:3485–3499. doi: 10.1021/ac802770r. [DOI] [PubMed] [Google Scholar]
- 15.Kuberan B, Lech M, Zhang L, Wu ZL, Beeler DL, Rosenberg RD. Analysis of heparan sulfate oligosaccharides with ion pair-reverse phase capillary high performance liquid chromatography-microelectrospray ionization time-of-flight mass spectrometry. J Am Chem Soc. 2002;124:8707. doi: 10.1021/ja0178867. [DOI] [PubMed] [Google Scholar]
- 16.Thanawiroon C, Rice KG, Toida T, Linhardt RJ. Liquid chromatography/mass spectrometry sequencing approach for highly sulfated heparin-derived oligosaccharides. J Biol Chem. 2004;279:2608–2615. doi: 10.1074/jbc.M304772200. [DOI] [PubMed] [Google Scholar]
- 17.Karamanos NK, Vanky P, Tzanakakis GN, Tsegenidis T, Hjerpe A. Ion-pair high-performance liquid chromatography for determining disaccharide composition in heparin and heparan sulphate. J Chromatogr A. 1997;765:169. doi: 10.1016/s0021-9673(96)00930-2. [DOI] [PubMed] [Google Scholar]
- 18.Thanawiroon C, Linhardt RJ. Separation of a complex mixture of heparin-derived oligosaccharides using reversed-phase high-performance liquid chromatography. J Chromatogr A. 2003;1014:215–223. doi: 10.1016/s0021-9673(03)00779-9. [DOI] [PubMed] [Google Scholar]
- 19.Henriksen J, Roepstorff P, Ringborg LH. Ion-pairing reversed-phased chromatography/mass spectrometry of heparin. Carbohydr Res. 2006;341:382–387. doi: 10.1016/j.carres.2005.11.030. [DOI] [PubMed] [Google Scholar]
- 20.Toyoda H, Yamamoto H, Ogino N, Toida T, Imanari T. Rapid and sensitive analysis of disaccharide composition in heparin and heparan sulfate by reversed-phase ion-pair chromatography on a 2 μm porous silica gel column. J Chromatogr A. 1999;830:197–201. [Google Scholar]
- 21.Jerkovich AD, Mellors JS, Jorgenson JW. The use of micrometer-sized particles in ultrahigh pressure liquid chromatography. LC-GC North Am. 2003;21:600–610. [Google Scholar]
- 22.MacNair JE, Lewis KC, Jorgenson JW. Ultrahigh-pressure reversed-phase liquid chromatography in packed capillary columns. Anal Chem. 1997;69:983–989. doi: 10.1021/ac961094r. [DOI] [PubMed] [Google Scholar]
- 23.Swartz ME. UPLC™: An Introduction and Review. J Liq Chromatogr Relat Technol. 2005;28:1253–1263. [Google Scholar]
- 24.Deakin JA, Lyon M. A simplified and sensitive fluorescent method for disaccharide analysis of both heparan sulfate and chondroitin/dermatan sulfates from biological samples. Glycobiology. 2008;18:483–491. doi: 10.1093/glycob/cwn028. [DOI] [PubMed] [Google Scholar]
- 25.Zaia J, Costello CE. Compositional analysis of glycosaminoglycans by electrospray mass spectrometry. Anal Chem. 2001;73:233–239. doi: 10.1021/ac000777a. [DOI] [PubMed] [Google Scholar]
- 26.Zhang Y, Kariya Y, Conrad AH, Tasheva ES, Conrad GW. Analysis of keratan sulfate oligosaccharides by electrospray ionization tandem mass spectrometry. Anal Chem. 2005;77:902–910. doi: 10.1021/ac040074j. [DOI] [PubMed] [Google Scholar]
- 27.Saad OM, Myers RA, Castleton DL, Leary JA. Analysis of hyaluronan content in chondroitin sulfate preparations by using selective enzymatic digestion and electrospray ionization mass spectrometry. Anal Biochem. 2005;344:232–239. doi: 10.1016/j.ab.2005.06.041. [DOI] [PubMed] [Google Scholar]
- 28.Murray KK. Coupling matrix-assisted laser desorption/ionization to liquid separations. Mass Spectrum Rev. 1997;16:283–295. [Google Scholar]
- 29.Pope RM, Raska CS, Thorp SC, Liu J. Analysis of heparan sulfate oligosaccharides by nano-electrospray ionization mass spectrometry. Glycobiology. 2001;11:505–513. doi: 10.1093/glycob/11.6.505. [DOI] [PubMed] [Google Scholar]
- 30.Stoll DR, Li X, Wang X, Carr PW, Porter SEG, Rutan S. Fast, comprehensive two-dimensional liquid chromatography. J Chromatogr A. 2007;1168:3–43. doi: 10.1016/j.chroma.2007.08.054. [DOI] [PMC free article] [PubMed] [Google Scholar]
- 31.Gilar M, Fountain KJ, Budman Y, Neue UD, Yardley KR, Rainville PD, Russell RJ, II, Gebler JC. Ion-pair reversed-phase high-performance liquid chromatography analysis of oligonucleotides: retention prediction. J Chromatogr A. 2002;958:167–182. doi: 10.1016/s0021-9673(02)00306-0. [DOI] [PubMed] [Google Scholar]
- 32.Vailaya A, Horvath C. Retention in reversed-phase chromatography: partition or adsorption? J Chromatogr A. 1998;829:1–27. doi: 10.1016/s0021-9673(98)00727-4. [DOI] [PubMed] [Google Scholar]
- 33.Warda M, Zhang F, Radwan M, Zhang Z, Kim N, Kim YN, Linhardt RJ, Han J. Is Human Placenta Proteoglycan Remodeling Involved in Pre-eclampsia? Glycoconj J. 2008;25:441–450. doi: 10.1007/s10719-007-9090-8. [DOI] [PMC free article] [PubMed] [Google Scholar]


