Abstract
Hepatic disposition plays a significant role in the pharmacokinetics and pharmacodynamics of a variety drugs. Sinusoidal membrane transporters have been shown to participate in the hepatic disposition of many pharmaceuticals. Two sinusoidal membrane transporters with an established role in hepatic disposition are OATP1B1 and OATP1B3. OATP1B1 and OATP1B3 have been implicated in the hepatic uptake of statin drugs and polymorphisms linked to OATP1B1 have been associated with deleterious patient endpoints. As a result, OATP1B1 and OATP1B3 represent sites for potential drug-drug interactions. Numerous methods exist for identifying potential drug-drug interactions with transporters. However, relatively few offer the convenience and speed of fluorescence-based assays. Here, a fluorescence-based assay was developed for measuring the OATP1B1 and OATP1B3 mediated transport of 8-fluorescein-cAMP (8-FcA). The OATP1B1 and OATP1B3 mediated transport of 8-FcA was time dependent and saturable (Km = 2.9 μM, Vmax = 0.20 pmol/min/cm2 and 1.8 μM and 0.33 pmol/min/cm2, respectively). Molecules known to interact with OATPs, including cyclosporin A, rifampicin, and glibenclamide, each demonstrated concentration dependent inhibition of 8-FcA transport by OATP1B1 and OATP1B3. The in vitro fluorescence-based assays described here using 8-FcA as the substrate are convenient, rapid, and have utility in screening drug candidates for potential drug-drug interactions with OATP1B1 and OATP1B3.
Keywords: Transporter, transport, fluorescence, OATP1B1, OATP1B3
Introduction
There is an ever-increasing appreciation for the role of transporters in the absorption, disposition, and excretion of pharmaceutical compounds. Organic anion transporting polypeptides 1B1 and 1B3, OATP1B1 and OATP1B3, are transporters predominately, and perhaps exclusively, localized to the liver and play an important role in the hepatic disposition of drugs [1]. Their localization and their role in hepatic disposition make OATP1B1 and OATP1B3 obvious choices for the early screening of drug candidates to eliminate molecules that may foster potential drug-drug interactions. In vitro studies of drug metabolizing enzymes have contributed to the significant reduction in the failure rate of drugs for pharmacokinetic/bioavailability reasons [2]. It is likely that similar in vitro studies of drug transporters could further reduce the failure rate of drugs [3]. A number of in vitro studies involving drug metabolizing enzymes have employed fluorescence-based methodologies, because of their speed and convenience, to identify and screen out problematic compounds early in development [4]. Fluorescence-based methods offer some advantages over traditional methods used to investigate transport; they avoid the use of radioisotopes and offer accelerated analytical measurement. Fluorescent methods have been developed for screening molecules against transporters using the fluorescent molecules, 4-(4-(dimethylamino)styryl)-N-methylpyridinium and [2-(4-nitro-2,1,3-benzoxadiazol-7-yl)aminoethyl]trimethylammonium, for organic cation transporters [5-7]; 6-carboxyfluorescein, for organic anion transporters [8]; Fluo-3 and fluoroscein-methotrexate, for OATP1B3 [9, 10]; and most recently 4’,6-diamidino-2-phenylindole for multidrug and toxin extrusion proteins [11]. However, a suitable fluorescent substrate has not been suitably characterized to screen candidate molecules against one of the primary xenobiotic transporters important to the hepatic disposition of many drugs, OATP1B1.
Two fluorescent substrates for OATP1B1 have been characterized, chenodeoxychilyl-(Nε- nitrobenz-2-oxa-1,3-diazole)-lysine, CDCA-NBD, and very recently, fluorescein-methotrexate, FMTX [12, 10]. However, the molecule characterized by Yamaguchi, et. al., CDCA-NBD, is not commercially available. Additionally, nitrobenz-2-oxa-1,3-diazole derivatives characteristically have low extinction coefficients and quantum yields making detection in some systems a concern. FMTX appeared to be a reasonable candidate substrate for OATP1B1, but the author's indicated in their discussion that the OATP1B1 assay using FMTX may need further optimization or may require a different substrate. The authors further noted that they were testing additional fluorescent substrates for OATP1B1 in order to increase the signal and to establish a reliable assay for OATP1B1. It was therefore of value to continue to search for, and identify, a suitable substrate for OATP1B1 to use in inhibition assays.
The molecule 8-FcA, 8-(2-[Fluoresceinyl] aminoethylthio) adenosine-3', 5'-cyclic monophosphate, represents a potential candidate for use as an OATP1B1 substrate in vitro. There are a number of characteristics that make 8-FcA a suitable candidate for investigating OATP1B1 mediated transport and inhibition thereof. It is commercially available and it is a derivative of fluorescein, a molecule known to have a high extinction coefficient and quantum yield and one that is widely used in fluorescence assays. Moreover it is a large multivalent anion similar to other substrates transported by OATP1B1 and OATP1B3. Additionally, being a multivalent anion, its physicochemical properties are well suited for transport assays. 8-FcA has a very high aqueous solubility and a calculated topological polar surface area of 267 [13]. These physicochemical properties suggest that 8-FcA is not lipophilic and is therefore unlikely to passively diffuse through the cell membrane resulting in a high background signal relative to transport. Previous characterization of 8-FcA transport in teleost proximal tubules and in membrane vesicles of Spodoptera frugiperda 9 (Sf9) cells transfected with human multidrug resistance associated protein 4 (MRP4) supports a relatively good signal-to-background fluorescence [14]. Thus, 8-FcA has promise as a fluorescent substrate for use in transport/inhibition assays. This report examines the utility of 8-FcA as a substrate in fluorescence-based OATP1B1 and OATP1B3 assays, analyzing its transport properties, and inhibition thereof, in CHO cells expressing OATP1B1 (CHOOATP1B1), OATP1B3 (CHOOATP1B3), and the vector control (CHOvector).
Materials and Methods
Materials
8-FcA was purchased from Biolog Life Science Institute (Bremen, Germany) via its American distributor Axxora, LLC (San Diego, CA). Technical information for 8-FcA is available from the manufacturer, Biolog Life Science Institute. All other chemicals were purchased from Sigma-Aldrich (St. Louis, MO). Hank's Balanced Salt Solution (HBSS) and cell culture reagents were purchased from Mediatech (Herndon, VA). Radiolabeled compounds, [3H] p-aminohippurate and [3H] taurocholate were purchased from American Radiolabeled Chemicals (St. Louis, MO); [14C] metformin, [3H] bromosulfophthalein, and [14C] adefovir dipivoxil were purchased from Moravek Biochemicals (Brea, CA); [3H] estrone-3-sulfate was purchased from Perkin-Elmer (Waltham, MA). Transporter cDNAs were purchased from OriGene (Rockville, MD).
Cell Culture and Transfection
CHO cells were maintained in Dulbecco's Modified Eagle Medium supplemented with 10% fetal bovine serum, 1% non-essential amino acids, and 2 mM alanyl-glutamine at 37°C in an atmosphere of 95% air and 5% CO2. For transient transfections, CHO cells were seeded at 50,000 cells/cm2 and transfected, according to manufacturer's instructions, with Lipofectamine 2000 approximately 24 hours following seeding.
CHO-OATP1B1-ERAV-neo cells (CHOOATP1B1), CHO-OATP1B3-ERAV-neo cells (CHOOATP1B3), CHO-OATP2B1-ERAV-neo cells (CHOOATP2B1), and CHO-ERAV-neo cells (CHOvector) were created by introducing, by transfection, a bicistronic vector derived from the pCI plasmid (Promega, Madison, WI). The vector was designed to encode the transporter and the neomycin resistance gene; where both constructs were cooperatively linked by a foot-and-mouth disease 2A-like sequence from equine rhinitis A virus, ERAV, to yield two independent protein products from a single promoter [15]. The transfectants were subjected to selection and maintained in media supplemented with 1.5 mg/mL of G418 (Promega, Madison, WI). The stable clones expressing the vector, OATP1B1, OATP1B3, or OATP2B1 used here were identified and characterized. For transport experiments cells were seeded at a density of 50,000 cells/cm2, in media free of G418, approximately 48 hours prior to experimentation.
Transport and Inhibition
Approximately 24 hours following transient transfection or 48 hours following seeding for stable cell lines, cells were aspirated of media and washed twice with HBSS. The cells were maintained in the second HBSS wash solution for 15 minutes to equilibrate with the buffer; inhibitor was not present during this period. Following the 15 minute equilibration period, the wash solution was aspirated, and the experiment was initiated by the administration of solutions of either substrate and vehicle (0.5% dimethyl sulfoxide) or substrate and inhibitor. For kinetic studies, the concentration of 8-FcA ranged from 0.25-25 μM. For inhibition studies, the concentration of 8-FcA used was 2.5 μM and 1.25 μM for the OATP1B1 and OATP1B3 assays, respectively. The cells were incubated in the substrate solution for ten minutes for kinetic analysis, IC50 determination, and Z’-factor analysis, or at various time points for the time course assessment. For the determination of inhibition, the inhibitors were prepared to a final vehicle concentration of 0.5% dimethyl sulfoxide. A vehicle control plus seven incremental concentrations of inhibitor separated by approximately 0.5 logarithmic units (e.g. 0.6, 2, 6, 20 μM; 100 μM maximum) distributed around an estimated IC50 value determined the concentration range used for each inhibitor in the IC50 experiments. Cellular uptake of 8-FcA was terminated by aspirating the substrate solution and washing with ice cold phosphate buffered saline three times. The cells were extracted using a 50:50 solution of methanol:Tris-EDTA (10 mM, 1 mM), pH 8.0 (an extraction solution of acetonitrile:water, 50:50, v:v was used for the radioactive substrates) for approximately 10 minutes. The buffered extraction solution was used to minimize any changes in 8-FcA fluorescence that may be sensitive to pH. An aliquot of the extract was transferred to a black OptiPlate-96 (Perkin-Elmer, Waltham, MA) for fluorescence measurements or a flexible scintillation plate (Perkin-Elmer, Waltham, MA) for radioactivity measurements. Concentrations of the extracts were determined by spectrofluorometry (λex = 485 nm/λem = 535 nm) using a Tecan Spectrafluor fluorescence plate reader (Tecan, Männerdorf, Switzerland) or scintillation counting using a Microbeta 1450 (Perkin-Elmer, Waltham, MA). Standard curves ranging from 1-100 nM 8-FcA were prepared on the day the experiment(s) to determine the Km and Vmax and were linear (r2 ≥ 0.995).
Cellular accumulation assays to assess MRP4 activity were performed in a manner similar to those described elsewhere [16, 17, 18]. Briefly, cells were seeded as described above and approximately 48 hours later the cells were washed and equilibrated as noted above. The cells were then incubated with 100 nM [14C] [2-(6-aminopurin-9-yl)ethoxymethyl-(2,2-dimethylpropanoyloxymethoxy) phosphoryl] oxymethyl 2,2-dimethylpropanoate, bis-POM-PMEA (adefovir dipivoxil), or 1.25 μM 8-FcA in the presence or absence of 100 μM indomethacin. After two hours of incubation the cells were washed, extracted, and the accumulated radioactivity or fluorescence was determined as noted above.
Microscopy
Cells were seeded, washed, exposed to 10 μM 8-FcA for 20 minutes, and washed with ice cold solution three times as indicated above. Rather than being extracted, the cells were briefly maintained in the final ice cold wash solution. Images were obtained using an Olympus IX70 fluorescent microscope (Tokyo, Japan) equipped with a Jenoptik camera (Jena, Germany) and ProgRes CapturePro Software (Jenoptic; Jena, Germany). Fluorescence images were obtained following a 2000 ms exposure.
Data Analysis
Where data is normalized to control, the cellular accumulation of substrate in cells expressing the transporter is divided by that of vector controls and the vector controls are self-divided (vector = 1). For fluorescence data showing vector controls and transporter expressing cells, the extracts of cells not exposed to 8-FcA is subtracted from both conditions.
Michaelis-Menten kinetic parameters, Km and Vmax, were determined by nonlinear regression (GraphPad Prism, GraphPad Software Inc., San Diego, CA), fit to the following equation: V = [(Vmax*[S])/(Km+[S])], where V is the measured rate of cellular accumulation, [S] is the substrate concentration, and Vmax and Km represent the maximal rate of transport and the substrate concentration at the half-maximal rate, respectively. The mean cellular accumulation of CHOvector cells was subtracted from that of the CHOOATP1B1 or CHOOATP1B3 cells prior to kinetic analysis.
Inhibition was determined from the net cellular accumulation of 8-FcA, where the cellular accumulation measured in CHOvector extracts were subtracted from CHOOATP1B1 and CHOOATP1B3 extracts, and were expressed as a percent of the vehicle control. The IC50 value was determined by nonlinear regression (GraphPad Prism, GraphPad Software Inc., San Diego, CA), fit to the following three parameter equation: V=[(V0)/((1+([I]/IC50)n))], where V is the measured transport, V0 is the transport in the absence of inhibitor, [I] is the inhibitor concentration, IC50 represents the inhibitor concentration where transport is reduced by 50%, and n is a Hill coefficient.
The Z’-factor was calculated as previously described [19].
Where appropriate, the difference between a vector control and a transporter was tested for significance using an unpaired, two-tailed t-test (GraphPad Software Inc., San Diego, CA). A P value of <0.05 was considered statistically significant.
Results
Transporter Specificity of 8-FcA Accumulation
To assess the specificity of 8-FcA as a substrate for commonly investigated drug transporters, CHO cells were transiently transfected with a vector control, NTCP, OAT1, OAT3, OATP1B1, OATP1B3, OATP2B1, OCT1, or OCT2 and subsequently exposed to 10 μM 8-FcA for 20 minutes. A relatively high concentration of 8-FcA and long exposure time was selected to provide sufficient opportunity for the dye to accumulate in cells, even if poorly transported. CHO cells transiently transfected with OATP1B1 and OATP1B3 readily accumulated 8-FcA (figure 1F, 1G). A modest accumulation of 8-FcA was seen CHO cells transfected with OAT1 (figure 1D). The untransfected cells, the vector control, and the remaining transporters were negative for the accumulation of 8-FcA (figure 1A-J). The occasional cell in a number of the transfected conditions appeared to accumulate 8-FcA (arrowheads figure 1). However, this was likely due to a few cells that may have been compromised by the transfection, because it was not apparent in the untransfected controls. Similar results were seen for DAPI accumulation in transiently transfected cells for a recently characterized fluorescence-based assay for MATE transporters [11].
Figure 1.
The cellular accumulation of 8-FcA in transiently transfected CHO cells following a 20 minute exposure to 10 μM 8-FcA. The expressed transporter for each image is as follows: untransfected CHO cells (A), control vector (B), NTCP (C), OAT1 (D), OAT3 (E), OATP1B1 (F), OATP1B3 (G), OATP2B1 (H), OCT1 (I), and OCT2 (J). All images had the same exposure time. Rare cells that accumulated 8-FcA were identified in each transfected condition (arrowheads).
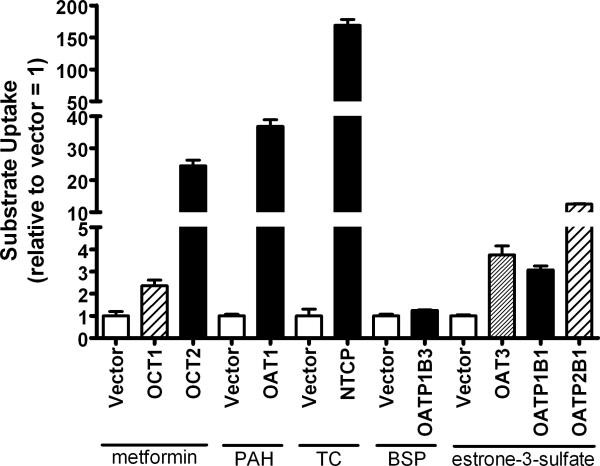
Parallel to the fluorescent experiments seen in figure 1, transport experiments, that were meant to serve as a functional test of successful transfection, were conducted. Using substrates common to the transporters transfected for the assessment of 8-FcA specificity, the transport activity associated with each transfected transporter was evaluated and compared to that of the vector contol. For each transporter/substrate there was a statistically significant increase relative to the vector control using a common substrate (P < 0.05 for each transporter, figure 2). Using 10 μM metformin as the substrate, OCT1 and OCT2 showed a mean increase over control of 2.4-fold and 24.5-fold respectively. OAT1 demonstrated a 36.8-fold increase versus control, with 2 μM p-aminohippurate as the substrate, and NTCP exhibited a 168.9-fold increase when compared to control using 2 μM taurocholate as the substrate. Two micromolar estrone-3-sulfate was used as the substrate for the transporters OAT3, OATP1B1, and OAT2B1, which showed a 3.8-fold, 3.1-fold, and 12.5-fold increase in activity, respectively, when compared to the vector control. For OATP1B3 there was only a modest increase of 1.26-fold activity versus control, but the increase was statistically significant. Furthermore, the microscopy data seen in figure 1G provided additional support that transfection of OATP1B3 was successful.
Figure 2.
The functional transport by cells transfected with a control vector, OCT1, OCT2, OAT1, NTCP, OATP1B3, OAT3, OATP1B1, or OATP2B1. Data is expressed relative to the control condition (vector). The substrate used for OCT1, OCT2, and the corresponding control was 10 μM metformin. The substrate used for OAT1 and the corresponding control was 2 μM p-aminohippurate (PAH). The substrate used for NTCP and the corresponding control was 2 μM taurocholate (TC). The substrate used for OATP1B3 and the corresponding control was 2 μM bromosulfophthalein (BSP). The substrate used for OAT3, OATP1B1, OATP2B1, and the corresponding control was 2 μM estrone-3-sulfate.
Expression and Relative Transport
To further characterize the transport of 8-FcA, two separate cell lines were generated stably expressing each of the two transporters that showed robust cellular accumulation of 8-FcA, OATP1B1 and OATP1B3 (CHOOATP1B1 and CHOOATP1B3). Additionally, cell lines were generated stably expressing the control vector to serve as a negative control (CHOvector) and OATP2B1 (CHOOATP2B1) to be used as a comparator to OATP1B1 and OATP1B3 in initial experiments. The comparison was of value because of the substantial substrate overlap and shared tissue distribution between the OATP family members OATP1B1, OATP1B3, and OATP2B1 [20]. The comparison would reflect the uniqueness of the transporters as well as 8-FcA as a substrate. The presence of each transporter transcript in its respective cell line was confirmed by RT-PCR.
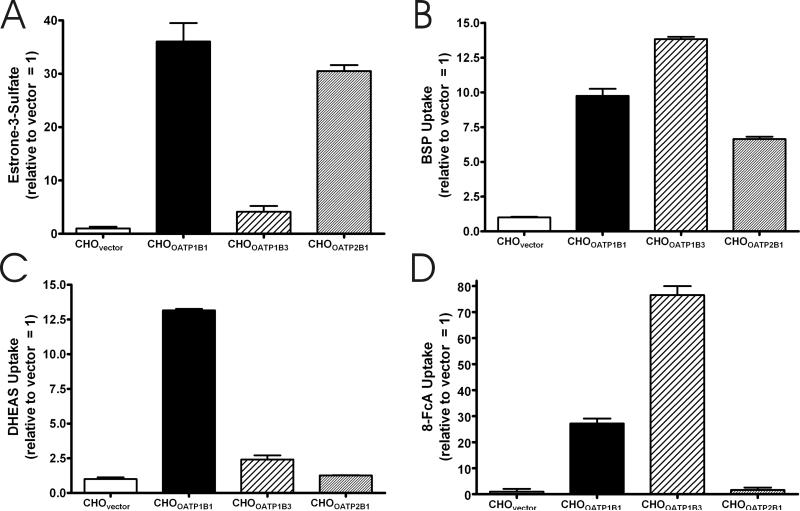
Transport experiments were used to confirm the functional expression of each gene product. Figures 3A-C compare the relative cellular accumulation of 2 μM estrone-3-sulfate, 2 μM bromosulfophthalein, and 2 μM dehydroepiandrosterone sulfate. When estrone-3-sulfate was used as a substrate, the relative increase in its cellular accumulation ranged from 4.1-fold over control for CHOOATP1B3 to 36.1-fold over control for CHOOATP1B1 (figure 3A). The increase seen, relative to control, when bromosulfophthalein was used as a substrate was more uniform for the three transporters, ranging form a 6.6-fold increase for CHOOATP2B1 to a 13.8-fold increase versus control for CHOOATP1B3 (figure 3B). For dehydroepiandrosterone sulfate, the cellular accumulation relative to control was 13.2, 2.4, and 1.3 for CHOOATP1B1 and CHOOATP1B3, and CHOOATP2B1, respectively (figure 3C). The transport of estrone-3-sulfate, bromosulfophthalein, and dehydroepiandrosterone sulfate illustrated the functionality of each cell line, and reflected the uniqueness of each transporter. The cellular accumulation of 8-FcA was then investigated. Figure 3D compares the cellular accumulation of 2 μM 8-FcA in each of the cell lines. Both CHOOATP1B1 and CHOOATP1B3 show robust accumulation of 8-FcA, whereas the accumulation of 8-FcA by CHOOATP2B1 was not statistically different from that of CHOvector (P = 0.51). The data in figure 3 further confirms the image data from the transient transfections where, despite significant substrate overlap with OATP1B1 and OATP1B3, OATP2B1 does not transport 8-FcA.
Figure 3.
The five minute cellular accumulation of 2 μM estrone-3-sulfate (A), bromosulfophthalein (BSP) (B), dehydroepiandrosterone sulfate (DHEAS) (C), and 8-FcA (D) by CHOvector, CHOOATP1B1, CHOOATP1B3, and CHOOATP2B1 cells. Data is expressed relative to the control condition, CHOvector = 1.
Assessment of MRP4 Activity
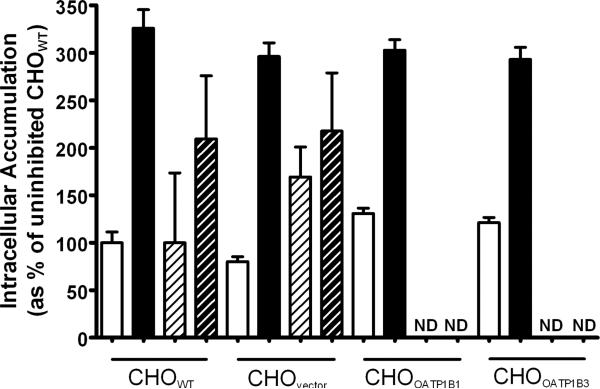
Because 8-FcA was previously characterized as an MRP4 substrate [14], it was of value to assess the CHO cells for potential endogenous hamster Mrp4 activity. Mrp4 activity was assessed by means of a drug accumulation assay using the pro-drug, bis-POM-PMEA. Bis-POM-PMEA diffuses into cells and is converted to the MRP4 substrate PMEA by endogenous esterases. The well characterized MRP4 substrate, PMEA, is then available to be transported out of the cell by MRP4 [21]. While the pro-drug bis-POM-PMEA is frequently used, a pro-drug is not necessary to investigate MRP4-mediated transport; the polar drug AZT has frequently been used as well [17, 21]. Inhibition of MRP4 activity results in the cellular accumulation of substrate. To assess the endogenous Mrp4 activity in the CHO cells, a two hour accumulation of compound was investigated in the presence or absence of the potent MRP4 inhibitor, indomethacin [22]. A two hour time point was selected to provide adequate time for 8-FcA to accumulate in the cells. Similar to AZT, the passive permeability of 8-FcA is limited and longer incubation periods are desirable when assessing its accumulation. When incubated with 100 nM bis-POM-PMEA the cellular accumulation was increased approximately three-fold in the presence of 100 μM indomethacin versus that of the respective uninhibited control, regardless of cell type (P < 0.05 for each). When 1.25 μM 8-FcA was used as the Mrp4 substrate the apparent increase in cellular accumulation in the presence of indomethacin was approximately two-fold, but was not statistically different from the uninhibited condition in each case (P=0.13 CHOWT, P=0.29 CHOvector). The accumulation of 8-FcA was not assessed in the CHOOATP1B1 and CHOOATP1B3 cells because it was thought that an increase in fluorescence accumulation due inhibition of an endogenous Mrp4 would be challenging to determine against the background of robust cellular accumulation of 8-FcA and potential inhibition of OATP-mediated transport by indomethacin.
Time Dependent Transport of 8-FcA
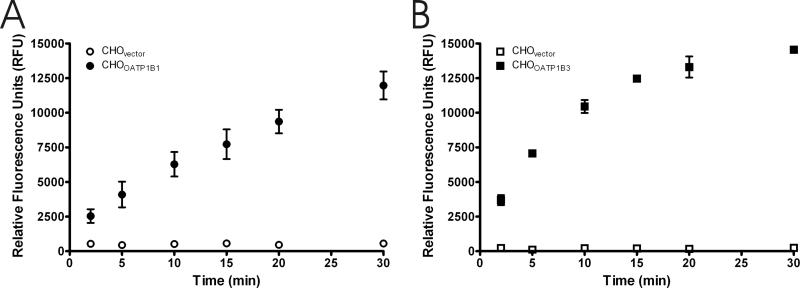
To further characterize the transport of 8-FcA, time course experiments were performed. Figures 5A and 5B demonstrate that the transport of 8-FcA by CHOOATP1B1 and CHOOATP1B3 is time dependent. Transport of 2.5 μM 8-FcA by CHOOATP1B1 was linear throughout the time course of the two experiments and did not appear to reach steady state by 30 minutes (figure 5A). The cellular accumulation of 1.25 μM 8-FcA by CHOOATP1B3 was relatively linear for the first 10 minutes and began to approach steady state by 30 minutes (figure 5B). In contrast to the CHOOATP1B1 and CHOOATP1B3 cells, the accumulation of 8-FcA by the CHOvector cells was negligible (figures 5A and 5B). A thirty minute time course experiment examining the cellular accumulation of 2.5 μM 8-FcA by CHOOATP2B1 cells compared to that of the CHOvector cells did not show a discernable difference between the two cell lines (data not shown).
Figure 5.
Time course of 8-FcA accumulation in CHO cells stably expressing the vector, OATP1B1, or OATP1B3. The 8-FcA concentration for CHOvector and CHOOATP1B1 (A) was 2.5 μM and 1.25 μM for CHOvector and CHOOATP1B3 (B). Data represent the mean and standard error of two experiments where each time point was performed in triplicate.
Transport Kinetics of 8-FcA
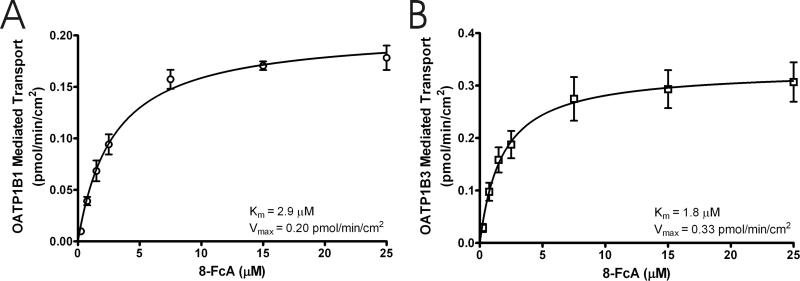
The OATP1B1 and OATP1B3 mediated transport of increasing concentrations of 8-FcA is shown in figures 6A and 6B. The mean cellular accumulation of 8-FcA by CHOvector was subtracted from that of CHOOATP1B1 and CHOOATP1B3 to determine the OATP1B1 and OATP1B3 mediated transport. Both transporters became saturated with increasing concentrations of 8-FcA. Non-linear regression analysis of the data from three experiments estimated the Km and Vmax values for OATP1B1 to be 2.9±0.40 μM and 0.20±0.01 pmol/min/cm2, respectively (mean ± standard error). The transport efficiency, as described by Vmax/Km, was 0.069 μL/min/cm2. Similarly, the Km, Vmax, and transport efficiency values for OATP1B3 were determined to be 1.8±0.47 μM, 0.33±0.02 pmol/min/cm2, and 0.183 μL/min/cm2. For subsequent inhibition assays a 10 minute time point with 8-FcA concentrations of 2.5 μM for OATP1B1 and 1.25 μM for OATP1B3 was selected. The identified time point and concentration for each assay achieved a balance between linearity, concentration relative to Km, and signal-to-background. Though the 8-FcA concentration for the OATP1B1 and OATP1B3 assays is nominally below the respective Km value for each transporter, the use of substrate at or below its Km value in an inhibition assay is consistent with published guidelines for determining inhibitory potency in vitro [23].
Figure 6.
The concentration dependent transport of 8-FcA by OATP1B1 (A) and OATP1B3 (B). The 8-FcA concentration ranged from 0.25 μM to 25 μM and the period of uptake for each transporter was 10 minutes. The Km and Vmax for each transporter is indicated in the figure. The fit of the kinetic data is shown as a solid line. Data represent the mean and standard error of three experiments where each concentration was performed in triplicate.
Inhibition of 8-FcA Transport
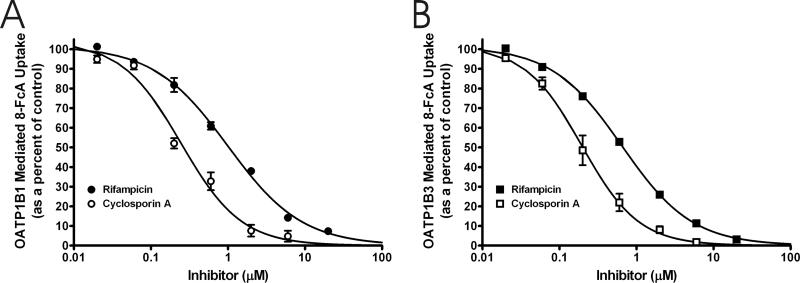
To assess the utility of 8-FcA as a substrate in a fluorescence-based inhibition assays for OATP1B1 and OATP1B3, inhibition of 8-FcA transport was performed using a series of compounds (table 1, figure 7). Each compound showed concentration dependent inhibition of OATP1B1 and OATP1B3 mediated 8-FcA transport; again, the mean cellular accumulation of 8-FcA by CHOvector was subtracted from that of CHOOATP1B1 and CHOOATP1B3 to determine the transporter mediated cellular accumulation. The IC50 value of each compound versus OATP1B1 and OATP1B3 mediated 8-FcA transport is presented in table 1 and is compared to literature Km or Ki values, where available, for each compound. Representative IC50 curves for two inhibitors that can potentially be used in clinical studies for the assessment of drug interactions with OATP1B1 and OATP1B3, rifampicin and cyclosporine A, are presented in figure 7 [3]. A substantial difference in the IC50 value was seen between the two transporters when estrone-3-sulfate was used as the inhibitor. The difference was verified by conducting one of the IC50 experiments for each transporter on the same day, serially diluting stock solutions of estrone-3-sulfate continuously throughout the entire concentration range for both transporters. The difference seen in the IC50 values was of the same magnitude as the experiments conducted on different days, illustrating that the difference in IC50 values for OATP1B1 and OATP1B3 seen for estrone-3-sulfate against 8-FcA was bona fide. A similar magnitude of difference in the IC50 between OATP1B1 and OATP1B3 of estrone-sulfate (Estropipate) was seen by Gui, et al. [10].
Table 1.
Interaction of Compounds with OATP1B1 and OATP1B3: Comparison of IC50 Values from the Fluorescence-Based Inhibition Assay with Affinity Values (Km, Ki) Reported in the Literature.
| Inhibitor | †OATP1B1 IC50 value (μM) | OATP1B1 Km or (Ki) (μM) | reference | †OATP1B3 IC50 value (μM) | OATP1B3 Km or (Ki) (μM) | reference |
|---|---|---|---|---|---|---|
| bromosulfophthalein | 0.18±0.02 | 0.3 | [27] | 0.51±0.02 | 0.4 | [27] |
| cyclosporin A | 0.25±0.03 | (0.24) | [28,29] | 0.20±0.02 | (0.573) | [28] |
| estradiol-17β-d-glucuronide | 4.88±0.87 | 5.4 | [30] | 23.5±1.59 | 15.8,(24.6) | [30],[31] |
| estrone-3-sulfate | 0.053±0.005 | 0.094/5.4, 0.23/45 | [25],[26] | 20.1±1.00 | 58 | [30] |
| glibenclamide | 1.14±0.13 | (0.75) | [28] | 2.69±0.12 | - | - |
| rifampicin | 0.99±0.07 | 13,(0.48) | [32],[28,29] | 0.65±0.02 | 2.3,(1.45) | [32],[29] |
| thyroxine | 3.85±0.88 | 3.0 | [33] | 2.13±0.17 | - | - |
Inhibition of the OATP1B1-mediated transport of 2.5 μM 8-FcA or OATP1B3-mediated transport of 1.25 μM 8-FcA. The data represent mean ± standard error from two independent experiments where each inhibitor concentration was performed in triplicate.
Figure 7.
The IC50 determination for cyclosporin A (open symbols) and rifampicin (filled symbols) versus 8-FcA for OATP1B1 (A) and OATP1B3 (B). The IC50 values for cyclosporine A and rifampicin against OATP1B1 mediated transport were 0.25 μM, and 0.99 μM, respectively. The IC50 values for the same inhibitors against OATP1B3 mediated transport were 0.20 μM, and 0.65 μM. Data represent the mean and standard error of two experiments where each concentration was performed in triplicate.
Assay Suitability
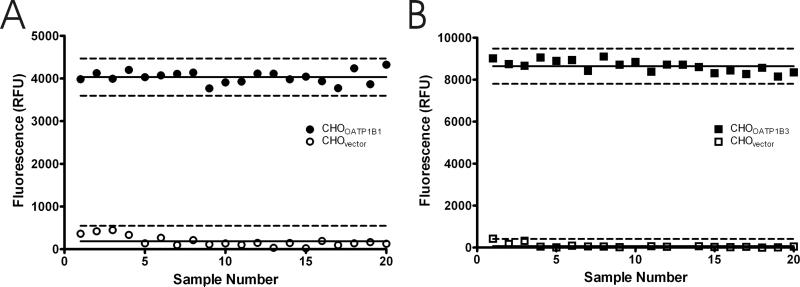
As a measure of assay suitability, 20 replicate positive control and negative control samples for the each of the OATP1B1 and OATP1B3 assays were used to determine a Z’-factor, a simple statistical parameter used to evaluate and compare bioassays [19]. The calculated Z’-factor for the OATP1B1 and OATP1B3 assays was 0.79 and 0.86, respectively (figure 8A and 8B). Both Z’-factor values indicated that the separation between the positive control and negative control values was large, suggesting that each assay is suitable for measuring inhibition of OATP1B1 and OATP1B3 mediated transport of 8-FcA.
Figure 8.
Assay data from 20 replicates of CHOvector and CHOOATP1B1 (A), and CHOvector and CHOOATP1B3 (B). The mean of each data set is indicated by the solid horizontal line. The broken lines represent three standard deviations from the mean. The calculated Z’-factor was 0.79 for the OATP1B1 assay and 0.86 for the OATP1B3 assay.
Discussion
Provided the importance of OATP1B1 and OATP1B3 in the hepatic disposition of drugs, it is essential to have in vitro assays to assess potential drug-drug interactions early in drug development. Fluorescence-based assays offer a straightforward, efficient, and rapid means for evaluating inhibition of transport, and correspondingly, the potential for drug-drug interactions.
The background cellular accumulation of 8-FcA in CHO and CHOvector cells is negligible, consistent with its physicochemical properties (figures 1, 4, and 5). The transport of 8-FcA appears to be relatively specific (figure 1). It accumulated in cells expressing OATP1B1 and OATP1B3, and to a lesser extent OAT1. The data of figure 2 suggest that the negative fluorescence seen for the other transporters in figure 1 was not due to a failure to express a functional transporter, but rather, due to a lack of 8-FcA transport. For the transporters that transported 8-FcA, the tissue expression of OAT1 and OATP1B1 and OATP1B3 is mutually exclusive, kidney for the former and liver for the latter two transporters. Moreover, for assay purposes, transporters are frequently individually expressed in cell lines, further minimizing any specificity concerns. Thus, while 8-FcA may not be absolutely specific for OATP1B1 and OATP1B3, the tissue distribution of the transporters, and the means by which transporter assays are typically conducted, the specificity of 8-FcA is suitable for investigating OATP1B1 and OATP1B3 transport.
Figure 4.
The two-hour cellular accumulation when exposed to 0.1 μM bis-POM-PMEA (solid white and solid black bars) or 1.25 μM 8-FcA (diagonal black stripe on white background and diagonal white stripe on black background) in CHOWT, CHOvector, CHOOATP1B1, CHOOATP1B3 cells in the absence (white background) or presence (black background) of 100 μM indomethacin. Data is expressed relative to the control condition, CHOWT uninhibited = 100%. ND = Not Determined.
The data presented in figure 4 suggested the presence of an endogenous MRP4 transporter, or similar mechanism, in the CHO cells. The cellular accumulation seen when the cells were incubated with bis-POM-PMEA was significantly increased by the presence of the MRP4 inhibitor, indomethacin. However, the effect on 8-FcA was not significant, especially when considering the negligible accumulation in the CHOvector cells relative to the robust cellular accumulation seen in the CHOOATP1B1 and CHOOATP1B3 cells at much shorter time periods (figures 3 and 8). The apparent increase of 8-FcA in the control cells did not represent a deterrent to characterization of 8-FcA transport in the CHO cells, particularly when the time point for OATP-mediated transport was assessed at a much shorter time point than that used for the Mrp4 assessment and because the data was corrected by utilization of the vector control cells, similar to that published for characterization of the MRP4 substrate PMEA by OAT1 in CHO cells [24]. It is also unlikely that the Mrp4 activity impacted the microscopy results of figure 1. If 8-FcA was transported by one of the introduced transporters, the modest and variable effect of the endogenous Mrp4 is likely indistinguishable from the background signal and therefore unlikely to reverse a potentially positive result in the images of figure 1. The variability seen in the 8-FcA Mrp4 assessment is reflective of the variability seen in the evaluation of its transport kinetics when characterizing it as a substrate of MRP4 [14]. This is in contrast to the data of the well established MRP4 substrate, PMEA, which showed substantially less variability, so while 8-FcA may be a substrate of MRP4, it is quite possibly poorly transported by hamster Mrp4 or perhaps saturates the process at the 1.25 μM concentration examined.
An OATP1B3 assay has been described in the literature using Fluo-3 as the substrate [9]. However, because OATP1B3 transfected cells showed accumulation of 8-FcA, it was of value to characterize the transport of 8-FcA by OATP1B3 and compare it to that of OATP1B1, perhaps providing a fluorescence-based assay to compliment the previously described Fluo-3 assay. The transport of 8-FcA by OATP1B1 and OATP1B3 was time dependent, saturable, and inhibitable (figures 5, 6, and 7), each characteristic of a transporter mediated process. The OATP1B3 assay described here has a time advantage over the previously described Fluo-3 assay, 10 minutes for 8-FcA versus one hour for Fluo-3 [9]. Additionally, Fluo-3 appears to be a poor substrate for OATP1B1 [10]. Recently, fluorescence-based assays for OATP1B1 and OATP1B3 were described using FMTX [10]. The authors were content with the utility of FMTX in the OATP1B3 assay, but appeared dissatisfied with the corresponding OATP1B1 assay using FMTX noting that the assay needed improvement and that additional fluorescent substrates were being tested for the OATP1B1 assay. The fluorescent substrate tested here, 8-FcA, is sufficiently transported by both transporters that further screening of fluorescent substrates for OATP1B1 may not be necessary.
OATP1B1 and OATP1B3 each show robust transport of 8-FcA and have excellent dynamic range relative to control (figure 8). The broad dynamic range, when combined with a narrow variability, facilitates the determination of IC50 values. The determined IC50 values and the corresponding inhibition curves (table 1, figure 7), illustrate that the measurement of 8-FcA transport is qualitatively and quantitatively suitable for investigating inhibition of OATP1B1 and OATP1B3. However, because the substrate concentration is not substantially less than the Km value for each transporter, the IC50 values cannot be equated to the Km or Ki values presented in table 1. Nevertheless, the IC50 values presented in table 1 do compare favorably with Km or Ki values identified in the literature for each respective compound and the corresponding transporter, suggesting that the experimental conditions used are adequate for IC50 determination. One notable standout in the determination of IC50 values was that of estrone-sulfate against OATP1B1. The IC50 value was comparatively low, 0.053 μM, relative to the other molecules tested and when compared to the estrone-sulfate value versus OATP1B3. A similar IC50 value for estrone-sulfate was reported recently for OATP1B1, 0.06 μM [10]. Additionally, kinetic analysis of estrone-sulfate as a substrate of OATP1B1 previously showed a biphasic response with a high affinity and a low affinity component [25, 26]. The interaction between 8-FcA and estrone-sulfate may be uniquely associated with the high affinity component, though this was not investigated beyond the IC50 determination presented.
In summary, fluorescence-based assays for OATP1B1 and OATP1B3 were developed utilizing 8-FcA as the substrate. The transport of 8-FcA by OATP1B1 and OATP1B3 was time dependent, saturable, and inhibitable. Moreover, the accumulation of 8-FcA in the cells not expressing OATP1B1 or OATP1B3 was both qualitatively and quantitatively small, providing very good signal-to-background for assay purposes. It is therefore concluded that 8-FcA has utility as a probe for in vitro fluorescence-based assays. The assays described here using 8-FcA are convenient, rapid, and have utility for screening drug candidates for potential drug-drug interactions with OATP1B1 and OATP1B3.
Acknowledgments
This work was supported by the National Institutes of Health Small Business Innovation Research Grant [Grant R43GM086970]. The author would like to thank Dr. Stephen H. Wright at the University of Arizona for his critical review of the manuscript.
Footnotes
Publisher's Disclaimer: This is a PDF file of an unedited manuscript that has been accepted for publication. As a service to our customers we are providing this early version of the manuscript. The manuscript will undergo copyediting, typesetting, and review of the resulting proof before it is published in its final citable form. Please note that during the production process errors may be discovered which could affect the content, and all legal disclaimers that apply to the journal pertain.
References
- 1.Ho RH, Kim RB. Transporters and drug therapy: implications for drug disposition and disease. Clin. Pharmacol. Ther. 2005;78:260–277. doi: 10.1016/j.clpt.2005.05.011. [DOI] [PubMed] [Google Scholar]
- 2.Kola I, Landis J. Can the pharmaceutical industry reduce attrition rates? Nat. Rev. Drug Discov. 2004;3:711–716. doi: 10.1038/nrd1470. [DOI] [PubMed] [Google Scholar]
- 3.International Transporter Consortium KM, Giacomini SM, Huang DJ, Tweedie LZ, Benet KL, Brouwer X, Chu A, Dahlin R, Evers V, Fischer KM, Hillgren KA, Hoffmaster T, Ishikawa D, Keppler RB, Kim CA, Lee M, Niemi JW, Polli Y, Sugiyama PW, Swaan JA, Ware SH, Wright SW, Yee MJ, Zamek-Gliszczynski L. Zhang, Membrane transporters in drug development. Nat. Rev. Drug. Discov. 2010;9:215–236. doi: 10.1038/nrd3028. [DOI] [PMC free article] [PubMed] [Google Scholar]
- 4.Crespi CL, Stresser DM. Fluorometric screening for metabolism-based drug-drug interactions. J. Pharmacol. Toxicol. Methods. 2000;44:325–331. doi: 10.1016/s1056-8719(00)00112-x. [DOI] [PubMed] [Google Scholar]
- 5.Ahlin G, Karlsson J, Pedersen JM, Gustavsson L, Larsson R, Matsson P, Norinder U, Bergström CAP. Artursson, Structural requirements for drug inhibition of the liver specific human organic cation transport protein. J. Med. Chem. 2008;51:5932–5942. doi: 10.1021/jm8003152. [DOI] [PubMed] [Google Scholar]
- 6.Bednarczyk D, Mash EA, Aavula BR, Wright SH. NBD-TMA: a novel fluorescent substrate of the peritubular organic cation transporter of renal proximal tubules. Pflugers Arch. 2000;440:184–192. doi: 10.1007/s004240000283. [DOI] [PubMed] [Google Scholar]
- 7.Bhasker RA, Ali MA, Mash EA, Bednarczyk D, Wright SH. Synthesis and fluorescence of N,N,N-trimethyl-2-[methyl(7-nitrobenzo[c][l,2,5]oxadiazol-4-yl)amino]ethanaminium iodide, a pH-insensitive reporter of organic cation transport. Synthetic Commun. 2006;36:701–705. [Google Scholar]
- 8.Cihlar T, Ho ES. Fluorescence-based assay for the interaction of small molecules with the human renal organic anion transporter. Anal. Biochem. 2000;283:49–55. doi: 10.1006/abio.2000.4633. [DOI] [PubMed] [Google Scholar]
- 9.Baldes C, Koenig P, Neumann D, Lenhof HP, Kohlbacher O, Lehr CM. Development of a fluorescence-based assay for screening of modulators of human organic anion transporter 1B3 (OATP1B3) Eur. J. Pharm. Biopharm. 2006;62:39–43. doi: 10.1016/j.ejpb.2005.06.001. [DOI] [PubMed] [Google Scholar]
- 10.Gui C, Obaidat A, Chaguturu R, Hagenbuch B. Development of a Cell-Based High-Throughput Assay to Screen for Inhibitors of Organic Anion Transporting Polypeptides 1B1 and 1B3. Curr. Chem. Genomics. 2010;4:1–8. doi: 10.2174/1875397301004010001. [DOI] [PMC free article] [PubMed] [Google Scholar]
- 11.Yasujima T, Ohta KY, Inoue K, Ishimaru M, Yuasa H. Evaluation of DAPI as a Fluorescent Probe Substrate for Rapid Assays of the Functionality of Human Multidrug and Toxin Extrusion Proteins. Drug Metab. Dispos. 2010;38:715–721. doi: 10.1124/dmd.109.030221. [DOI] [PubMed] [Google Scholar]
- 12.Yamaguchi H, Okada M, Akitaya S, Ohara H, Mikkaichi T, Ishikawa H, Sato M, Matsuura M, Saga T, Unno M, Abe T, Mano N, Hishinuma T, Goto J. Transport of fluorescent chenodeoxycholic acid via the human organic anion transporters OATP1B1 and OATP1B3. J. Lipid Res. 2006;47:1196–1202. doi: 10.1194/jlr.M500532-JLR200. [DOI] [PubMed] [Google Scholar]
- 13.Ertl P, Rohde B, Selzer P. Fast calculation of molecular polar surface area as a sum of fragment-based contributions and its application to the prediction of drug transport properties. J. Med. Chem. 2000;43:3714–3717. doi: 10.1021/jm000942e. [DOI] [PubMed] [Google Scholar]
- 14.Reichel V, Masereeuw R, van den Heuvel JJMW, Miller DS, Fricker G. Transport of a fluorescent cAMP analog in teleost proximal tubules. Am. J. Physiol. 2007;293:R2382–R2389. doi: 10.1152/ajpregu.00029.2007. [DOI] [PubMed] [Google Scholar]
- 15.Donnelly ML, Hughes LE, Luke G, Mendoza H, ten Dam E, Gani D, Ryan MD. The ‘cleavage’ activities of foot-and-mouth disease virus 2A site-directed mutants and naturally occurring ‘2A-like’ sequences. J. Gen. Virol. 2001;82:1027–1041. doi: 10.1099/0022-1317-82-5-1027. [DOI] [PubMed] [Google Scholar]
- 16.Hoque MT, Cole SP SP. Down-regulation of Na+/H+ exchanger regulatory factor 1 increases expression and function of multidrug resistance protein 4. Cancer Res. 2008;68:4802–4809. doi: 10.1158/0008-5472.CAN-07-6778. [DOI] [PubMed] [Google Scholar]
- 17.Abla N, Chinn LW, Nakamura T, Liu L, Huang CC, Johns SJ, Kawamoto M, Stryke D, Taylor TR, Ferrin TE, Giacomini KM, Kroetz DL. The human multidrug resistance protein 4 (MRP4, ABCC4): functional analysis of a highly polymorphic gene. J. Pharmacol. Exp. Ther. 2008;325:859–868. doi: 10.1124/jpet.108.136523. [DOI] [PMC free article] [PubMed] [Google Scholar]
- 18.Ming X, Thakker DR. Role of basolateral efflux transporter MRP4 in the intestinal absorption of the antiviral drug adefovir dipivoxil. Biochem. Pharmacol. 2010;79:455–62. doi: 10.1016/j.bcp.2009.08.029. [DOI] [PubMed] [Google Scholar]
- 19.Zhang J, Chung TDY, Oldenburg KR. A simple statistical parameter for use in elvaluation and validation of high throughput screening assays. J. Biomol. Screen. 1999;4:67–73. doi: 10.1177/108705719900400206. [DOI] [PubMed] [Google Scholar]
- 20.Hagenbuch B, Gui C. Xenobiotic transporters of the human organic anion transporting polypeptides (OATP) family. Xenobiotica. 2008;38:778–801. doi: 10.1080/00498250801986951. [DOI] [PubMed] [Google Scholar]
- 21.Schuetz JD, Connelly MC, Sun D, Paibir SG, Flynn PM, Srinivas RV, Kumar A, Fridland A. MRP4: A previously unidentified factor in resistance to nucleoside-based antiviral drugs. Nat. Med. 1999;5:1048–1051. doi: 10.1038/12487. [DOI] [PubMed] [Google Scholar]
- 22.Nozaki Y, Kusuhara H, Kondo T, Iwaki M, Shiroyanagi Y, Nakayama H, Horita S, Nakazawa H, Okano T, Sugiyama Y. Species difference in the inhibitory effect of nonsteroidal anti-inflammatory drugs on the uptake of methotrexate by human kidney slices. J. Pharmacol. Exp. Ther. 2007;322:1162–1170. doi: 10.1124/jpet.107.121491. [DOI] [PubMed] [Google Scholar]
- 23.Bjornsson TD, Callaghan JT, Einolf HJ, Fischer V, Gan L, Grimm S, Kao J, King SP, Miwa G, Ni L, Kumar G, McLeod J, Obach RS, Roberts S, Roe A, Shah A, Snikeris F, Sullivan JT, Tweedie D, Vega JM, Walsh J, Wrighton SA. The conduct of in vitro and in vivo drug-drug interaction studies: a Pharmaceutical Research and Manufacturers of America (PhRMA) perspective. Drug Metab Dispos. 2003;31:815–832. doi: 10.1124/dmd.31.7.815. [DOI] [PubMed] [Google Scholar]
- 24.Ho ES, Lin DC, Mendel DB, Cihlar T. Cytotoxicity of antiviral nucleotides adefovir and cidofovir is induced by the expression of human renal organic anion transporter 1. J. Am. Soc. Nephrol. 2000;11:383–393. doi: 10.1681/ASN.V113383. [DOI] [PubMed] [Google Scholar]
- 25.Tamai I, Nozawa T, Koshida M, Nezu J, Sai Y, Tsuji A. Functional characterization of human organic anion transporting polypeptide B (OATP-B) in comparison with liver-specific OATP-C. Pharm. Res. 2001;18:1262–1269. doi: 10.1023/a:1013077609227. [DOI] [PubMed] [Google Scholar]
- 26.Noé J, Portmann R, Brun ME, Funk C. Substrate-dependent drug-drug interactions between gemfibrozil, fluvastatin and other organic anion-transporting peptide (OATP) substrates on OATP1B1, OATP2B1, and OATP1B3. Drug Metab. Dispos. 2007;35:1308–1314. doi: 10.1124/dmd.106.012930. [DOI] [PubMed] [Google Scholar]
- 27.Kullak-Ublick GA, Ismair MG, Stieger B, Landmann L, Huber R, Pizzagalli F, Fattinger K, Meier PJ, Hagenbuch B. Organic anion-transporting polypeptide B (OATP-B) and its functional comparison with three other OATPs of human liver. Gastroenterology. 2001;120:525–533. doi: 10.1053/gast.2001.21176. [DOI] [PubMed] [Google Scholar]
- 28.Hirano M, Maeda K, Shitara Y, Sugiyama Y. Drug-drug interaction between pitavastatin and various drugs via OATP1B1. Drug Metab. Dispos. 2006;34:1229–1236. doi: 10.1124/dmd.106.009290. [DOI] [PubMed] [Google Scholar]
- 29.Matsushima S, Maeda K, Ishiguro N, Igarashi T, Sugiyama Y. Investigation of the inhibitory effects of various drugs on the hepatic uptake of fexofenadine in humans. Drug Metab. Dispos. 2008;36:663–669. doi: 10.1124/dmd.107.017814. [DOI] [PubMed] [Google Scholar]
- 30.Gui C, Miao Y, Thompson L, Wahlgren B, Mock M, Stieger B, Hagenbuch B. Effect of pregnane X receptor ligands on transport mediated by human OATP1B1 and OATP1B3. Eur. J. Pharmacol. 2008;584:57–65. doi: 10.1016/j.ejphar.2008.01.042. [DOI] [PMC free article] [PubMed] [Google Scholar]
- 31.Hirano M, Maeda K, Shitara Y, Sugiyama Y. Contribution of OATP2 (OATP1B1) and OATP8 (OATP1B3) to the hepatic uptake of pitavastatin in humans. J. Pharmacol. Exp. Ther. 2004;311:139–146. doi: 10.1124/jpet.104.068056. [DOI] [PubMed] [Google Scholar]
- 32.Vavricka SR, Van Montfoort J, Ha HR, Meier PJ, Fattinger K. Interactions of rifamycin SV and rifampicin with organic anion uptake systems of human liver. Hepatology. 2002;36:164–172. doi: 10.1053/jhep.2002.34133. [DOI] [PubMed] [Google Scholar]
- 33.Abe T, Kakyo M, Tokui T, Nakagomi R, Nishio T, Nakai D, Nomura H, Unno M, Suzuki M, Naitoh T, Matsuno S, Yawo H. Identification of a novel gene family encoding human liver-specific organic anion transporter LST-1. J. Biol. Chem. 1999;274:17159–17163. doi: 10.1074/jbc.274.24.17159. [DOI] [PubMed] [Google Scholar]


