Abstract
Megavoltage cone-beam computed tomography (MY CBCT) is a highly promising technique for providing volumetric patient position information in the radiation treatment room. Such information has the potential to greatly assist in registering the patient to the planned treatment position, helping to ensure accurate delivery of the high energy therapy beam to the tumor volume while sparing the surrounding normal tissues. Presently, CBCT systems using conventional MV active matrix flat-panel imagers (AMFPIs), which are commonly used in portal imaging, require a relatively large amount of dose to create images that are clinically useful. This is due to the fact that the phosphor screen detector employed in conventional MV AMFPIs utilizes only ~2% of the incident radiation (for a 6 MV x-ray spectrum). Fortunately, thick, segmented scintillating detectors can overcome this limitation, and the first prototype imager has demonstrated highly promising performance for projection imaging at low doses. It is therefore of definite interest to examine the potential performance of such thick, segmented scintillating detectors for MV CBCT. In this study, Monte Carlo simulations of radiation energy deposition were used to examine reconstructed images of cylindrical CT contrast phantoms, embedded with tissue-equivalent objects. The phantoms were scanned at 6 MV using segmented detectors having various design parameters (i.e., detector thickness, as well as scintillator and septal wall materials). Due to constraints imposed by the nature of this study, the size of the phantoms was limited to ~6 cm. For such phantoms, the simulation results suggest that a 40 mm thick, segmented CsI detector with low density septal walls can delineate electron density differences of ~2.3% and 1.3% at doses of 1.54 and 3.08 cGy, respectively. In addition, it was found that segmented detectors with greater thickness, higher density scintillator material, or lower density septal walls exhibit higher contrast-to-noise performance. Finally, the performance of various segmented detectors obtained at a relatively low dose (1.54 cGy) was compared to that of a phosphor screen similar to that employed in conventional MV AMFPIs. This comparison indicates that, for a phosphor screen to achieve the same contrast-to-noise performance as the segmented detectors, ~18 to 59 times more dose is required, depending on the configuration of the segmented detectors.
Keywords: active matrix flat-panel imager, segmented scintillating detectors, megavoltage cone-beam CT, soft tissue visualization, contrast-to-noise ratio
I. INTRODUCTION
Technical advances in radiation therapy, such as three-dimensional conformal1 and intensity modulated radiation therapy2, have created the possibility of delivering treatment beams ever more precisely, leading to increased dose to tumor volumes and significant dose reduction to surrounding normal tissues and critical structures. However, the successful execution of high precision radiation treatments relies on accurate patient set-up in the treatment room so as to ensure the dose is delivered as intended.3 For this reason, a variety of volumetric imaging techniques are under investigation to provide tumor volume visualization in the treatment room immediately before the treatment.4-17 One such technique that has been clinically implemented involves acquiring cone-beam computed tomography (CBCT) images with a kilovoltage (kV) x-ray source and a diagnostic active matrix flat-panel imager (AMFPI), both orthogonally mounted to the treatment gantry.5-11 This system can produce useful CT images at clinically acceptable doses (i.e., a few cGy, which is approximately equal to the dose for one portal image).8-10
Another CT imaging technique that is also under investigation for soft tissue visualization involves the use of the megavoltage (MV) therapy beam and an electronic portal imaging device (EPID).5-8,11,18-32 Although the intrinsic contrast of human anatomical structures is lower at MV energies compared to kV energies, it has been demonstrated that soft tissues can be visualized on MV CBCT images obtained using conventional, as well as investigational, imagers.8,24,30,33 In addition, MV CBCT can offer some advantages over the kV technique. For example, MV CBCT makes use of the therapy beam itself and of a MV AMFPI that has already been installed for portal imaging, without need for additional equipment.34 Also, MV CBCT images can, in principle, be directly used for high accuracy dose calculation16,22,35 and inhomogeneity corrections36. Furthermore, MV CBCT is almost free of the “streak artifacts” that can occur at kV energies when metal objects, such as dental fillings and hip prostheses, are present in the imaged volume.21,37 Finally, MV CBCT is much less subject to scatter radiation which can degrade the image quality of kV CBCT.22
Despite these advantages, clinical implementation of MV CBCT is constrained by the relatively low quantum efficiency (i.e., less than 2% at 6 MV) of the phosphor screen + metal plate x-ray detectors used in conventional megavoltage AMFPIs.38,39 As a result, the dose needed for soft tissue visualization with such conventional imagers is relatively high. For example, Groh et al. have reported the use of 32 cGy to delineate ~4% density differences.8 Also, Morin et al. have reported using 14.4 cGy to obtain pelvic images with visible soft tissues (e.g., prostate, rectum, fat, and muscle)22, and 9 MU to obtain pelvic images having sufficient soft tissue information to guide 3D positioning23. If the x-ray detector quantum efficiency could be greatly improved, it is reasonable to expect that soft tissues could be visualized at considerably lower, clinically acceptable doses using megavoltage cone-beam (or fan-beam) CT. For this reason, high efficiency x-ray detectors have been widely investigated. For example, one-dimensional linear, as well as arc, detectors incorporating thick Xenon gas ionization chambers32,33,40 and thick crystalline scintillating detectors have been constructed and evaluated.41-45 Moreover, a two-dimensional (2D) matrix of 10 mm thick crystalline CsI(T1) scintillating detector coupled with a TV camera has been examined.46,47 In addition, an AMFPI-based system incorporating a 2D matrix of 8 mm thick CsI(T1) crystals (but with a much finer pitch and larger area than the camera system) has been developed,25 and recently used for lung tumor imaging and respiratory gating.26-28 Also, the feasibility of using thick optical fibers to detect Cerenkov radiation has been discussed.48 An alternative means for improving MV CBCT performance is to modify the treatment beam so as to generate lower energy X rays for imaging. This is currently under investigation through replacement of the usual tungsten target with a target made of low Z material (e.g., carbon) and removing the flattening filter during image acquisition.49
Towards greatly increasing the x-ray detector efficiency of megavoltage imagers, initial theoretical and empirical investigations of up to 40 mm thick, segmented crystalline scintillating detectors have recently been reported by our group.50,51 A prototype AMFPI incorporating such a detector design has been constructed and demonstrated highly promising performance at low doses.51 These promising early results motivate the present investigation of the potential performance of such detector designs for MV CBCT.
In this paper, Monte Carlo methods simulating x-ray energy deposition are used to theoretically examine the contrast, noise and contrast-to-noise performance of MV CBCT systems incorporating various segmented scintillating detector designs. The resulting performance is then compared to that from a simulated MV CBCT system employing a phosphor screen detector. The simulations suggest that soft tissue visualization can be achieved in MV CBCT images at clinically acceptable doses. Finally, prospects for realization of optimized detector configurations for low dose MV CBCT are discussed.
II. METHODS
In order to quantify the performance of MV CBCT systems incorporating a variety of hypothetical segmented scintillating detector configurations, Monte Carlo simulation of energy deposited by the incident radiation was employed. (Optical transport simulation was beyond the scope of this study.)
A. Simulation set-up
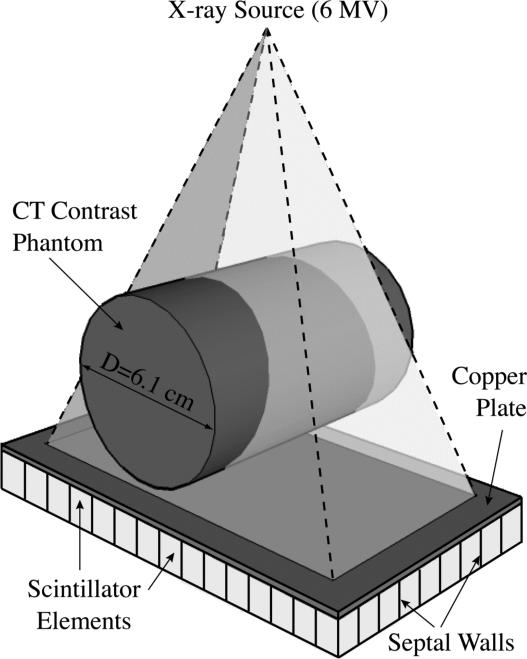
Figure 1 illustrates the simulated MV CBCT system. A point x-ray source and a segmented scintillating detector were used to scan a cylindrical CT contrast phantom tomographically. The x-ray source employed a 6 MV photon beam representing a typical spectral output along the central axis of a Varian linear accelerator.52 Any changes in the spectral output across the radiation field caused by the shape of the accelerator's flattening filter were not considered in the present simulations. However, for the small field size used in the study, these changes are minimal53 and would not significantly affect the results of the simulation. The center of the phantom and the entrance surface of the detector were 126 and 130 cm from the source, respectively. The detector had an area of 9.14 × 4.12 cm2. The beam size at the entrance of the detector was 8.46 × 3.17 cm2, which covered the whole CT contrast phantom in the radial direction. The segmented scintillating detector consisted of a matrix of 180 × 81 scintillator elements separated by septal walls and a 1 mm thick copper plate coupled to the x-ray side of the scintillator matrix acting as a radiation buildup layer. In this study, 10 and 40 mm thick, segmented CsI and BGO detectors, separated with low density (polystyrene), equivalent density (scintillator material) and high density (tungsten) septal walls were examined, for a total of 12 detector configurations. The detector element-to-element pitch was chosen to be 0.508 mm, equal to the pixel pitch of an indirect-detection MV AMFPI array54 that has been used in empirical evaluation of a recent prototype51. The width of the septal walls was chosen to be 0.05 mm, corresponding to the minimum value that can be achieved with present fabrication techniques. In the simulations, the energy deposited in the septal walls was not considered to contribute to the imaging signal, even in the cases where the septal walls were assumed to be the same material as the scintillator. The use of the three septal wall types allowed examination of detector performance when the scintillator and the septal walls have greatly different, as well as similar, radiation attenuation properties. Ideally, the scintillator elements should be focused towards the x-ray source,50 so as to reduce the loss of spatial resolution induced by the X rays incident at oblique angles. For the present study however, due to the large source-to-detector distance and the limited detector size, the maximum incident angle of the X rays is only ~2°. Therefore, the simulated system does not suffer greatly from the effect of oblique incidence of radiation, and thus, for reasons of simplicity, a non-focused geometry was used.
FIG. 1.
Three-dimensional schematic view of the simulated, megavoltage cone-beam CT (MV CBCT) system.
For comparison, CBCT simulations were also performed with a conventional MV AMFPI incorporating a phosphor screen detector, which consisted of a Gd2O2S:Tb screen (surface density of 133 mg/cm2) and an overlying 1 mm thick copper plate.39 The screen had the same area as the segmented scintillators, and was considered to consist of 180 × 81 voxels, with a voxel pitch of 0.508 mm. The energy deposited in each voxel was taken as the imaging signal.
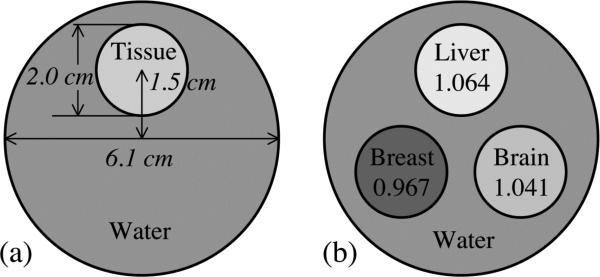
Figure 2 schematically illustrates the simulated CT contrast phantoms, each of which consists of one or three cylindrical tissue-equivalent objects embedded in a large “background” water cylinder. The diameters of the object cylinders and the large water cylinder were 2.03 and 6.10 cm, respectively. The center of each object cylinder was positioned 1.52 cm from the center of the water cylinder. The length of all phantoms was 4.06 cm. In this study, due to a limitation on the maximum number of array elements allowed by the simulation codes, it was not feasible to use segmented detectors with an element pitch of 0.508 mm to perform tomographic scans of CT contrast phantoms of human dimensions (e.g., 20 to 30 cm). Fig. 2(a) illustrates a phantom with a single embedded object. This phantom, which was used in six sets of simulations involving six tissue-equivalent materials, was scanned with a 40 mm thick, segmented CsI detector with low density septal walls. The chemical compositions and physical properties of these materials are summarized in Table I. Fig. 2(b) shows a phantom with three objects which was scanned with the various x-ray detectors. The three tissue equivalent objects were liver, brain, and breast, whose properties appear in Table I. The use of the three-object phantom to perform simulations involving these three materials considerably reduced the total amount of computational time required for this part of the study.
FIG. 2.
Cross-sectional view of the cylindrical CT contrast phantoms simulated in this study. (a) Illustration of a phantom with a single tissue-equivalent object. This phantom, using various tissue-equivalent objects, was employed in the performance evaluation of a 40 mm thick, segmented CsI detector with low density septal walls. (b) Illustration of a phantom with three specific tissue-equivalent objects. The relative electron densities of these objects relative to water are indicated in the figure. This phantom was employed in the performance evaluation of all x-ray detectors examined in this study.
TABLE I.
Chemical compositions by percentage of element weight, physical density and relative electron density of the tissue-equivalent materials examined in this study.
| Tissue-equivalent Material | Element Weight (%) | Physical Density (g/cm3) | Relative Electron Density | |||||||||
|---|---|---|---|---|---|---|---|---|---|---|---|---|
| H | C | N | O | Na | P | S | Cl | K | Ca | |||
| Breast (BR12)* | 8.68 | 69.95 | 2.37 | 17.91 | 0.14 | 0.95 | 0.990 | 0.967 | ||||
| Lipoma** | 10.90 | 71.90 | 3.00 | 13.80 | 0.10 | 0.20 | 0.10 | 0.980 | 0.977 | |||
| Mammary Gland (Adult #1)** | 10.90 | 50.60 | 2.30 | 35.80 | 0.10 | 0.10 | 0.10 | 0.10 | 0.990 | 0.987 | ||
| Skin (Fetus)** | 10.80 | 5.10 | 1.20 | 82.10 | 0.20 | 0.10 | 0.10 | 0.30 | 0.10 | 1.020 | 1.016 | |
| Brain (SR2)* | 10.83 | 72.54 | 1.69 | 14.86 | 0.08 | 1.045 | 1.041 | |||||
| Liver (mix)* | 8.09 | 67.00 | 2.47 | 19.99 | 0.14 | 2.31 | 1.095 | 1.064 | ||||
B. Monte Carlo simulations
EGSnrc57 and DOSXYZnrc58 Monte Carlo codes were used to simulate radiation energy deposition in various x-ray detectors. In the simulations, the parameters of PCUT and ECUT (corresponding to cutoff energies for photons and electrons) were chosen to be 0.01 and 0.521 MeV (corresponding to a kinetic energy of 0.01 MeV), respectively. The EXACT boundary crossing algorithm, PRESTA-II electron-step algorithm, and NIST bremsstrahlung cross sections were used. The simulations were performed using a total of 264 CPUs on two 64-bit Linux clusters with 1.8 and 2.2 GHz AMD Opteron processors, respectively, as well as a 64-bit Apple cluster with 2.0 GHz G5 processors. This study required a total of ~700,000 CPU hours.
1. X-ray fluence to dose correspondence
In this study, the amount of radiation used in the CBCT simulations was quantified in terms of the x-ray fluence (i.e., the number of X rays per unit area) incident on the phantom. In order to allow comparison of the irradiation conditions used in the simulations to those reported in other publications concerning MV CBCT, the equivalence between the x-ray fluence and the irradiation time [in monitor units (MU)] for a therapy machine was established through a calibration simulation of the absorbed dose (in cGy) at a depth of 10 cm, in a 30 × 30 × 30 cm3 water phantom. The surface of the water phantom was positioned 100 cm from the source, and the field size at the surface was 10 × 10 cm2. Under such calibration conditions and for an irradiation time of 1 MU, a medical linac is typically calibrated so as to deposit ~0.8 to 1 cGy of dose at 6 MV. Therefore, the doses reported in this paper correspond to the irradiation time (in monitor units) for therapy machines so calibrated, and thus represent equivalent calibration doses. (For simplicity, in this paper, such equivalent calibration doses will be referred to, simply, as doses.) The calibration simulation was performed using 20 × 109 X rays crossing the 10 × 10 cm2 field at 100 cm and yielded a dose of ~0.09 cGy, with a statistical uncertainty of ~0.6%. The x-ray fluence used in this calibration simulation corresponds to a value for 3.17 × 10⁹ X rays over the 8.46 × 3.17 cm2 field at 130 cm (where the CBCT simulations were performed). Thereafter, for a given CBCT simulation using N X rays, the corresponding dose is given by:
| (1) |
For example, for the simulations involving the segmented scintillating detectors, 0.6 × 10⁹ X rays were used for each of 180 projection images, resulting in a total scan dose of 3.08 cGy. For the simulations involving the phosphor screen detector, 19.8 × 10⁹ X rays were used per projection, resulting in a total scan dose of 101.64 cGy.
2. Cupping artifact removal
A cupping artifact, arising from radiation scattering,9,59,60 was observed on the reconstructed images. This artifact was manifested as a general increase in signal along the radial direction from the center to the edge of the cylindrical CT phantom. A standard method to remove this artifact involves determination and subtraction of correction factors based on the averaged radial signal in the reconstructed image of a uniform water phantom having the same dimensions as the contrast phantom and obtained using the same simulation set-up.61 However, this method was impractical to implement for all detector configurations studied. Since each configuration required its own correction, which consumes as much computational time as scanning the contrast phantom, an additional ~500,000 CPU hours would have been required for all configurations. This was beyond the resources available to the study. For that reason, a simplified determination method was developed. Instead of simulating an additional uniform water phantom, the simplified method involved the use of the water region in the reconstructed image of the contrast phantom itself to obtain the correction factors. For validation purpose, both methods were examined and compared for the case of a 40 mm thick, segmented CsI detector with low density septal walls.
3. Performance evaluation
The Monte Carlo investigations presented in this paper consist of evaluation of MV CBCT systems incorporating various segmented scintillating detectors and a phosphor screen detector. A 40 mm thick, segmented CsI detector with low density septal walls was chosen to examine system performance as a function of slice thickness ranging from 1 mm to 20 mm, as well as for total scan doses ranging from 1.54 to 6.16 cGy. The same detector was also used to study a variety of tissue-equivalent materials at 1.54 and 3.08 cGy. In addition, three tissue-equivalent materials (i.e., liver, brain and breast) were chosen to be scanned using the various segmented detectors with different detector thicknesses, scintillator materials and septal wall materials, at 3.08 cGy. The same three materials were also studied at much higher doses (up to 101.64 cGy) using the phosphor screen detector, the performance of which was compared to that of the segmented detectors at 1.54 cGy.
C. Analysis methods
Each CT contrast phantom was scanned over 360 degrees, at 2-degree intervals, resulting in a total of 180 projection images. A Feldkamp-based algorithm using a ramp filter,62 which employs attenuation line integrals (l) along straight pathways from the source to the imager pixels, was used to reconstruct the spatial distribution of attenuation coefficients for the CT phantoms. At each projection angle, l can be calculated using the exponential attenuation formula,
| (2) |
where I1 and I0 are x-ray intensity signals obtained from projection images with and without the phantom, respectively. In order to minimize the statistical error induced by I0, 30 flood-field images (i.e., images acquired without a phantom), each obtained with the same dose as that used for a phantom image, were averaged. For each scan, one averaged flood-field image was used for all projection angles. The reconstructed voxel pitch and single slice thickness were chosen to be 0.508 mm, matching the pixel pitch of the AMFPI array.54 From the reconstructed image, a number of single slices were averaged to obtain a slice image with better statistics (e.g., 5.08 mm for 10 slices).
In the reconstructed images, the mean signals in the water background (μwater) and in the object (μobj) were extracted to evaluate performance. The selection of the regions from which data were extracted excluded the edges of the objects and the phantom, as well as the center of the phantom where the cupping artifact correction induced non-negligible statistical uncertainties. [See Eq. (A5) in the Appendix.]
The deduced signal and noise are expressed in units of MV CT number, assuming a value of 0 Hounsfield Units (HU) in water, and –1000 HU in air (or vacuum). Metrics evaluated in this study include contrast (Contrast), noise (Noise), and contrast-to-noise ratio (CNR) of the tissue-equivalent objects in the reconstructed images. The Contrast of the object can be expressed as
| (3) |
Similarly, the Noise in the object can be expressed as
| (4) |
where σobj is the standard deviation of the voxel signal in the object. Therefore, the CNR of the object can be expressed as
| (5) |
The statistical uncertainties in the performance metrics were examined using a previously described method for CT imaging.63 The details of the statistical uncertainty analysis can be found in the Appendix.
III. RESULTS
A. Cupping artifact removal
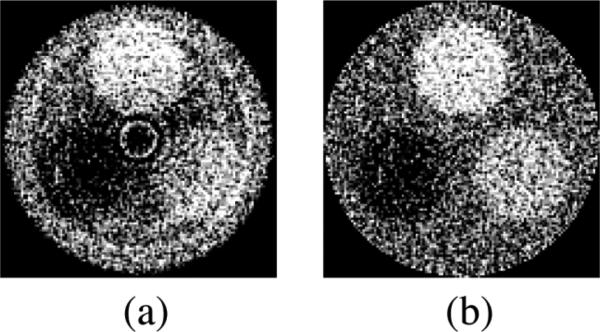
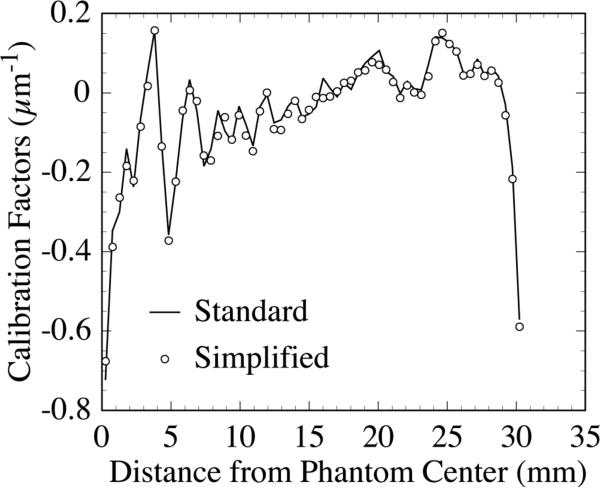
Figure 3 shows reconstructed images of a three-object phantom [as illustrated in Fig. 2(b)] before and after the application of the standard method for cupping artifact removal. The reconstructed images and the correction factors for cupping artifact removal were obtained using a 40 mm thick, segmented CsI detector with low density septal walls. Since the standard method requires the acquisition of independent CT scans with a uniform water cylinder so as to obtain correction factors, it was not practical to apply to all detector configurations. Instead, a simplified method based on acquiring the correction factors from the CT phantom images themselves was employed. In order to validate this simplified method, the correction factors obtained using this method were compared to those obtained using the standard method, as illustrated in Fig. 4. The factors obtained using both methods are very similar, indicating that they are equally effective in removing the cupping artifact. Moreover, the CNR results calculated from images corrected with both methods differed by only ~2%, which is much lower than the ~7% statistical error in the CNR results. Therefore, the simplified method can be used as a valid estimation for removing the cupping artifact. In the remainder of the Results section, the simplified method will be applied unless otherwise stated.
FIG. 3.
Reconstructed images of a three-object CT contrast phantom (a) before and (b) after the correction for a cupping artifact using the standard method (described in the text). The results were obtained using the 40 mm thick segmented CsI detector with low density septal walls. The orientation of the objects in the phantom is the same as that in Fig. 2(b). Note that the same window level was selected for both images.
FIG. 4.
Comparison of cupping artifact correction factors obtained with the standard method and with the simplified method (described in the text). The results were obtained using the same detector as that used in Fig. 3. The factors are illustrated as a function of the radial distance from the center of the phantom.
B. Performance evaluation
1. Slice thickness and total scan dose
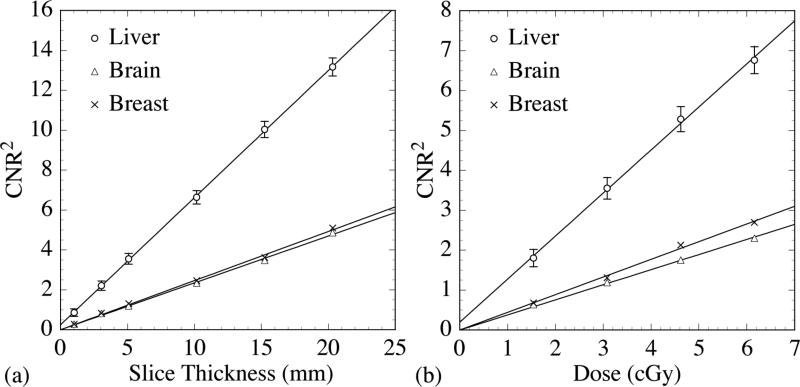
The 40 mm thick, segmented CsI detector with low density septal walls was selected to demonstrate the square of CNR (CNR2) performance as a function of the slice thickness and total scan dose. Fig. 5(a) illustrates CNR2 performance as a function of slice thickness (up to 20 mm) at a total scan dose of 3.08 cGy. The CNR2 results are shown to exhibit a linear increase with increasing slice thickness. Fig. 5(b) illustrates CNR2 performance as a function of total scan dose (up to 6.16 cGy) for a slice thickness of 5.08 mm. These CNR2 results also exhibit a linear increase with increasing total scan dose. The linear behaviors observed in Figs. 5(a) and 5(b) are both due to the linear decrease in the square of Noise (Noise2) in the objects with increasing number of sampled quanta - resulting in improved statistics. In the remainder of the Results section, performance metrics will be examined with a 5.08 mm thick reconstructed slice (obtained by averaging 10 consecutive, individual slices), and the segmented detectors will be examined at 1.54 and 3.08 cGy.
FIG. 5.
CNR2 as a function of (a) reconstructed slice thickness and (b) total scan dose obtained using the 40 mm thick segmented CsI detector with low density septal walls. The solid lines indicate linear fits to the data. For clarity of presentation, error bars are only shown for the liver-equivalent object. For a given slice thickness or dose, the relative errors in CNR2 for the other two objects are approximately the same as that for the liver-equivalent object. Note that in this figure and in the remaining figures, the label “dose” refers to the equivalent calibration dose as defined in Sec. II. B. 1.
2. Tissue-equivalent objects
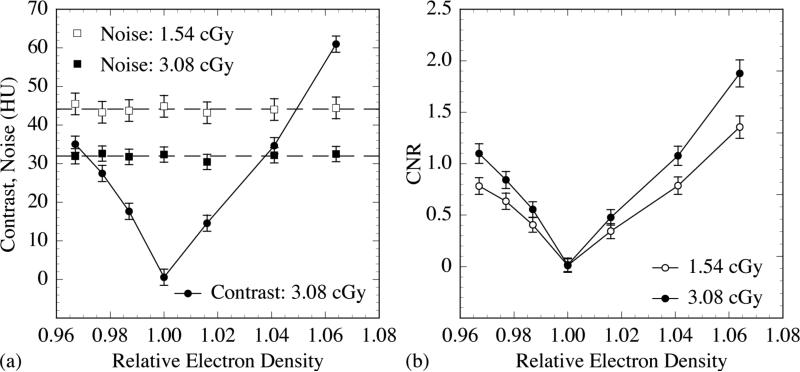
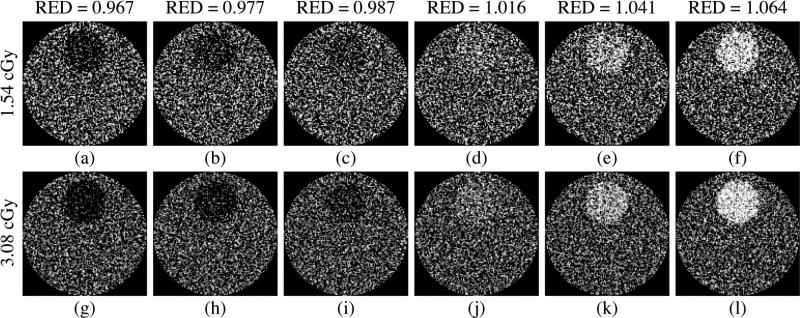
The CT contrast phantoms embedded with various tissue-equivalent objects [as illustrated in Fig. 2(a)] were examined using the 40 mm thick, segmented CsI detector with low density septal walls. In this case, the effect of the cupping artifact was removed using the standard method. Fig. 6(a) illustrates results for Contrast at 3.08 cGy and Noise at 1.54 and 3.08 cGy, plotted as a function of the relative electron density of the various tissue-equivalent objects. The Contrast results at 1.54 cGy are almost the same as those at 3.08 cGy, and are not plotted for reasons of clarity of presentation. For the low contrast tissue-equivalent objects that have been examined, the Contrast results increase approximately linearly with increasing difference in relative electron density between the objects and the water background, due to the dominant effect of Compton scattering at megavoltage energies. The slight deviations from linear behavior are due to the presence of lower probability interactions caused by pair production, whose probability is not proportional to the electron density. In addition, it is found that within the range of statistical uncertainty, the Noise performance is independent of the relative electron density for the tissue-equivalent objects studied. The reduced level of Noise for the higher dose is due to the larger number of X rays sampled. Fig. 6(b) illustrates the CNR performance of the tissue-equivalent objects. The CNR results increase in a pattern similar to that observed for the Contrast results. The improvement in CNR at the higher dose is due to a reduced level of Noise. Fig. 7 shows the reconstructed images of the CT contrast phantoms incorporating the various objects at 1.54 and 3.08 cGy. As illustrated, it is possible for the segmented detector to delineate 2.3% [Fig. 7(b)] and 1.3% [Fig. 7(i)] electron density difference at 1.54 and 3.08 cGy, respectively. Also, it is observed that the visibility of the tissue-equivalent objects improves with dose and with the relative electron density difference between each object and water, as expected and in line with the CNR results of Fig. 6(b).
FIG. 6.
Simulation results plotted as a function of the relative electron density of the various tissue-equivalent objects examined in this study. (a) Contrast at 3.08 cGy, as well as Noise results at 1.54 and 3.08 cGy. The solid line joining the Contrast data points is drawn to guide the eye, whereas the dashed lines indicate the mean levels of the Noise results at two doses. (b) CNR at 1.54 and 3.08 cGy. The solid lines joining the CNR data points are drawn to guide the eye.
FIG. 7.
Reconstructed images of the CT contrast phantoms embedded with various tissue-equivalent objects. For each phantom, a pair of images obtained at 1.54 cGy and 3.08 cGy is shown. The relative electron densities (RED) of the objects are indicated for each image pairs. The same window level was selected for the images obtained at the same dose, whereas different window levels were selected for different doses in order to maximize the visibility of the objects.
3. Segmented scintillating detector configurations
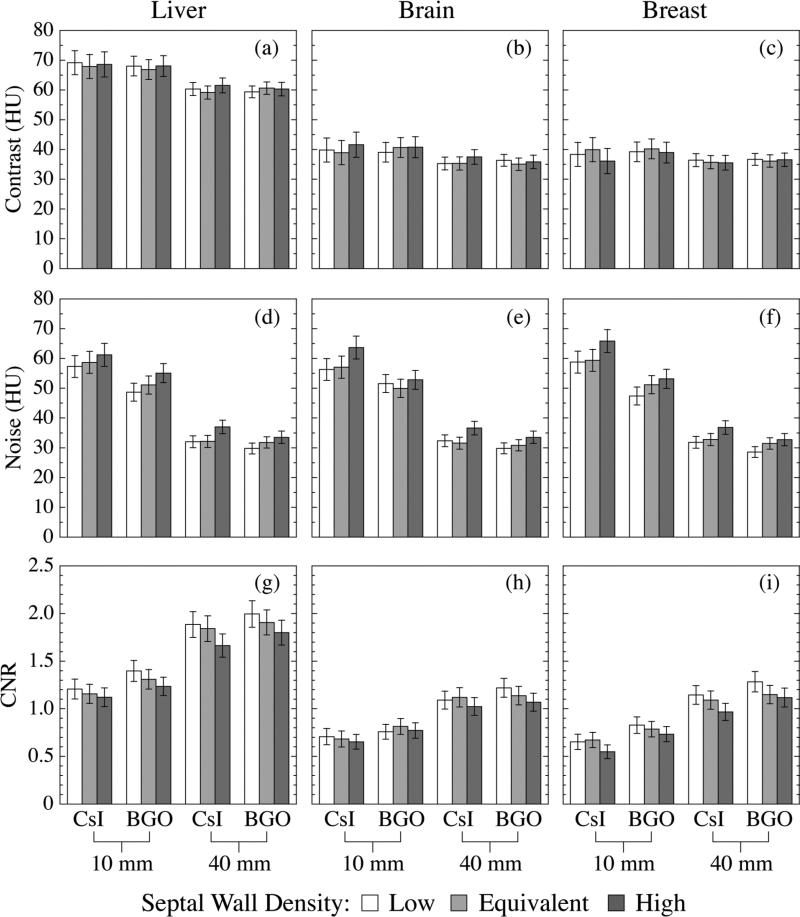
Segmented scintillating detectors with different detector thicknesses, scintillator materials and septal wall materials were examined at 3.08 cGy using the three-object CT contrast phantom [as illustrated in Fig. 2(b)]. Fig. 8 illustrates Contrast, Noise and CNR performance of the three tissue-equivalent objects. The Contrast performance is mainly determined by the relative electron density of the object. It is observed that the thicker detectors exhibit slightly lower Contrast, probably due to the increased relative contribution of phantom scatter radiation to detector signal. Since scatter radiation is lower in energy compared to the primary radiation, it is more efficiently absorbed as detector thickness increases. The effect of the scintillator and septal wall materials on Contrast is not pronounced. The Noise performance is mainly determined by the detector properties. In general, detectors with greater thickness, higher density scintillator and lower density septal walls, provide lower Noise. The Noise values of the three objects scanned with the same detector are observed to be equivalent within the range of statistical uncertainty. Generally, it is found that detectors with greater thickness, higher density scintillator and lower density septal walls offer higher CNR performance for a given object, mainly due to the reduced level of Noise.
FIG. 8.
Contrast, Noise and CNR results for the liver-, brain- and breast-equivalent objects obtained using various segmented scintillating detectors. In each figure, the results obtained using the detectors with the same thickness and scintillator material are illustrated in one group. Moreover, in each group, detector designs with different septal wall materials are indicated by columns with different shadings.
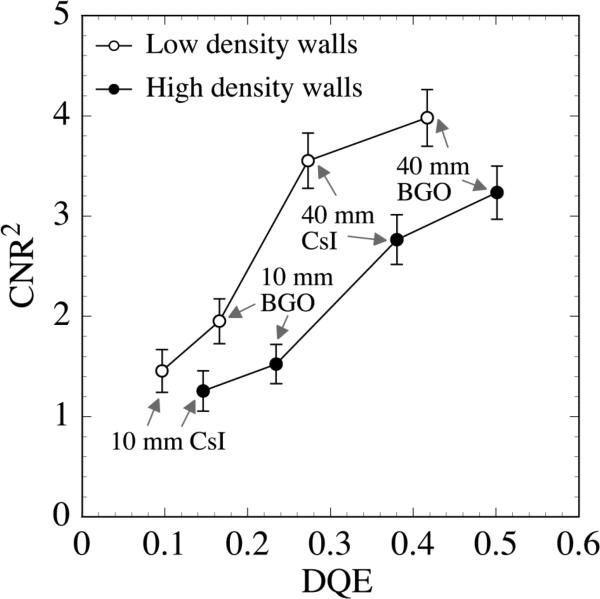
Figure 9 shows CNR2 results for the liver-equivalent object obtained using segmented detectors with low and high density septal walls. These results, obtained at 3.08 cGy, are plotted as a function of the zero frequency DQE of the corresponding detectors. These DQE values were reported in a previous Monte Carlo-based study.50 As shown in the figure, for detectors with the same septal wall density (i.e., low or high), CNR2 increases with increasing DQE. Moreover, it is found that, for a given combination of detector thickness and scintillator material (e.g., 40 mm BGO), the detectors with higher density septal walls exhibit lower CNR2 performance, despite providing a higher DQE. This behavior is a consequence of the fact that higher density septal walls provide a higher degree of radiation attenuation. On the one hand, this higher attenuation results in higher x-ray quantum efficiency, leading to a better DQE performance. On the other hand, the higher attenuation also limits the lateral spread of the radiation and reduces the effect of statistical averaging, leading to larger variation of the voxel signals in the reconstructed image (i.e., Noise2), and thus lower CNR2 performance.
FIG. 9.
CNR2 results for the liver-equivalent object. These results were obtained using the segmented detectors with low and high density septal walls. The data are plotted as a function of zero frequency DQE of the corresponding segmented scintillating detectors. The detector thickness and scintillator material are indicated for each detector. The lines joining the data points are drawn to guide the eye.
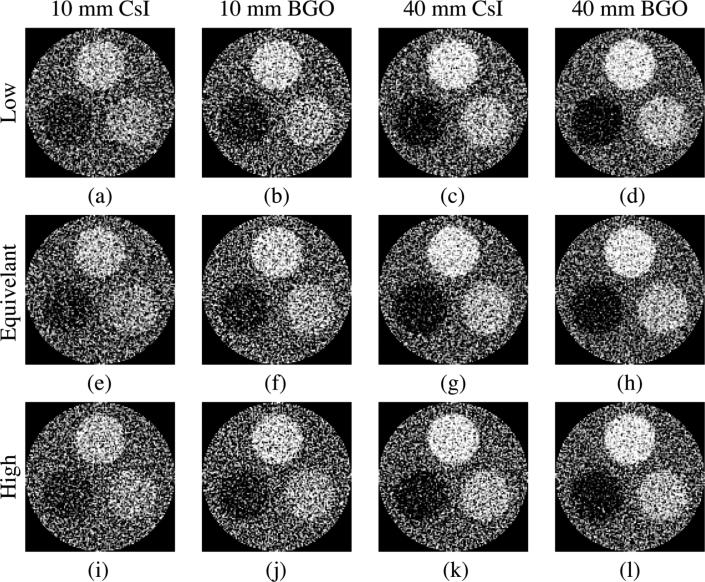
Figure 10 shows reconstructed images of the three-object phantom obtained using the various segmented scintillating detectors at 3.08 cGy. As illustrated, the three objects are clearly visible on all reconstructed images. In addition, the visibility of the objects improves with increasing detector thickness and scintillator density, and with decreasing septal wall density, in line with the CNR results of Fig. 8.
FIG. 10.
Reconstructed images of the three-object phantom obtained using various segmented detectors at 3.08 cGy. Each column represents detectors with a given detector thickness and scintillator material, whereas each row represents detectors with a given type of septal wall density (i.e., “Low”, “Equivalent” and “High”). The orientation of the objects in the phantom is the same as in Fig. 2(b). The same window level was selected for the images in the same column, while different window levels were selected for different columns to maximize the objects visibility.
4. Segmented detectors versus phosphor screen
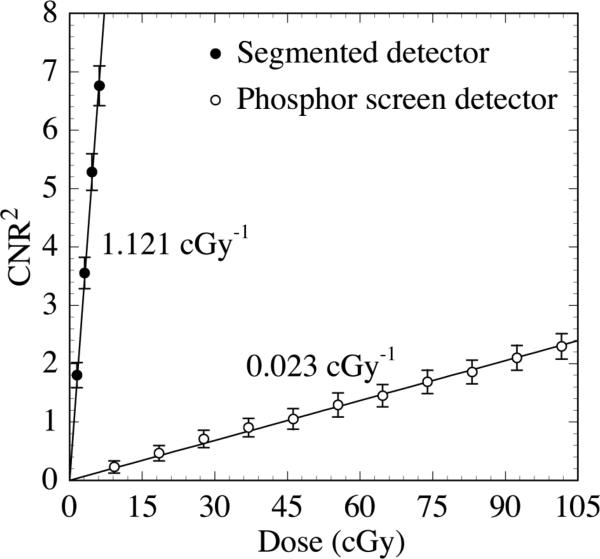
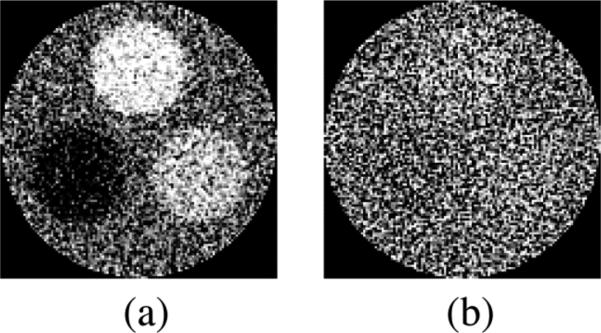
In this section, the performance obtained using the various segmented scintillating detectors is compared to that obtained using a phosphor screen detector whose composition is representative of those used in conventional MV AMFPIs. The simulations were performed using the three-object phantom. Fig. 11 shows the CNR2 performance for the liver-equivalent object as a function of the total scan dose for the 40 mm thick, segmented CsI detector with low density septal walls. The results are compared to those obtained from the phosphor screen detector. The segmented detector exhibits impressive performance, with CNR2 increasing ~49 times faster with dose than with the phosphor screen detector (1.121 cGy-l compared to 0.023 cGy-l, respectively). Figs. 12(a) and 12(b) show reconstructed images obtained at 4.62 cGy using the same pair of detectors used in Fig. 11. All three objects are clearly visible in Fig. 12(a) (segmented detector), but are almost invisible in Fig. 12(b) (phosphor screen detector).
FIG. 11.
CNR2 results for the liver-equivalent object as a function of total scan dose. Results are shown for the 40 mm thick segmented CsI detector with low density septal walls. Results are also shown for a phosphor detector representative of the type used in conventional MV AMFPIs. The solid lines indicate linear fits to the data. The slope of the linear fit, representing the sensitivity of CNR2 to dose, is indicated for each detector.
FIG. 12.
Reconstructed images of the three-object phantom obtained at 4.62 cGy using (a) the 40 mm thick segmented CsI detector with low density septal walls, and (b) the phosphor screen detector.
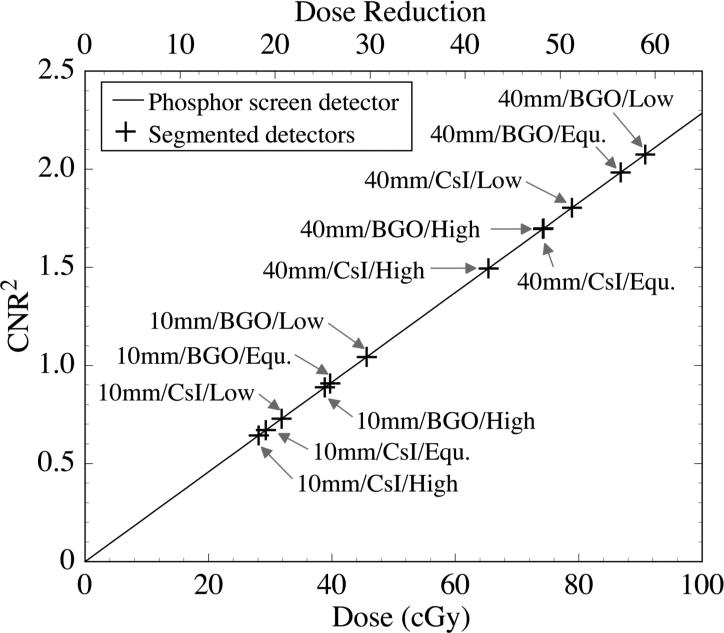
For the liver-equivalent object, CNR2 performance of all the segmented scintillating detectors is compared to that of the phosphor screen detector in Fig. 13. The phosphor screen detector performance (solid line) corresponds to the linear fit to the phosphor screen detector results in Fig. 11, and is illustrated as a function of dose (bottom x-axis scale). The plotted values of CNR2 obtained for the various segmented scintillating detectors at a constant dose of 1.54 cGy (cross symbols) have been positioned along the x-axis direction so as to overlie the phosphor screen detector performance curve. With this plotting convention, the degree of dose reduction provided by the segmented detectors compared to the phosphor screen detector, for an equivalent level of CNR2 performance, is given by the top x-axis scale. For example, to achieve a CNR2 performance equivalent to that of the 40 mm thick, segmented BGO detector with low density septal walls at 1.54 cGy, the phosphor screen requires a dose of ~90 cGy. Thus, if the phosphor screen were replaced by such a segmented detector, ~59 times less dose would be required to achieve equivalent CNR2 performance.
FIG. 13.
Comparison of the CNR2 performance obtained using the various segmented detectors at 1.54 cGy with that obtained using the phosphor screen detector at much higher doses. The solid line represents the CNR2 performance of the phosphor screen plotted as a function of dose (bottom x-axis scale). The cross symbols, which represent the CNR2 values obtained using the various segmented detectors at 1.54 cGy, are positioned along the x-axis direction so as to fall on the phosphor screen performance line. Thus the degree of dose reduction offered by the segmented detectors compared to the phosphor screen is represented by the top x-axis scale. For each segmented detector result, the design parameters of the corresponding detector (“detector thickness/scintillator material/ septal wall density”) are indicated in the figure. Note that “Low”, “Equ.” and “High” refer to the low, equivalent and high density walls used in the simulations. Also note that the results for “40mm/BGO/High” and “40mm/CsI/Equ.” almost exactly overlap.
IV. DISCUSSION AND CONCLUSIONS
In this paper, a theoretical evaluation of the performance of thick, segmented scintillating detectors for the visualization of low contrast, soft tissues using MV CBCT at clinically acceptable doses (e.g., ~3 cGy) for a 6 MV x-ray energy spectrum has been reported. Reconstructed images of a water phantom embedded with various tissue-equivalent objects were obtained through simulation of the energy deposited in the scintillating material. The Contrast, Noise and CNR performance were examined as a function of slice thickness, total scan dose, relative electron density of the tissue-equivalent materials and various design parameters of the segmented scintillating detectors. The performance of various segmented detector configurations obtained at a relatively low dose (1.54 cGy) was compared to that of a phosphor screen detector whose composition is representative of those used in conventional MV AMFPIs.
Within the limitation of this study (discussed below), the results indicate that the Contrast of a tissue-equivalent object is mainly determined by the difference in relative electron density between the tissue-equivalent object and the water background, due to the dominant effect of Compton scattering at megavoltage energies. The Contrast is not largely affected by the properties of the detector. In addition, for the low contrast tissue-equivalent objects that have been examined, and for a given detector, the Noise results appear to be independent of the relative electron density within the range of statistical uncertainty. The CNR2 performance for a tissue-equivalent object exhibits an approximately linear increase with increasing slice thickness and scan dose, due to the reduced Noise2 values induced by the increasing number of X rays sampled. In addition, with the same slice thickness and scan dose, the segmented detectors with greater thickness, higher density scintillators, or lower density septal walls result in lower Noise, and thus enhanced CNR performance. As seen from the reconstructed images, for the size of the phantoms studied, a 40 mm thick, segmented CsI detector with low density septal walls allows resolution of electron density differences of ~2.3% and 1.3% at 1.54 and 3.08 cGy, respectively. Moreover, all examined segmented detectors can delineate 3.3% electron density difference at 3.08 cGy. In addition, the results also indicate that for a phosphor screen detector to achieve the same CNR2 performance as the segmented detectors, ~18 to 59 times more dose is required, depending on the configuration of the segmented detector.
Due to constraints imposed by the simulation codes (see Sec. II. A.), the contrast phantoms examined were relatively small (~6 cm in diameter). For larger phantoms, there would be more radiation attenuation and scatter which would be expected to degrade CNR performance, so that a higher dose would be required to maintain the same performance obtained from the smaller phantoms. (Additional, exploratory simulations performed on simpler, unsegmented, scintillating detectors suggest that ~3 to 4 times more dose would be required to maintain the same CNR performance for a 20 cm phantom.) Nevertheless, it is suspected that, had a larger phantom been used, the CNR performance of the segmented detectors relative to the phosphor screen detector would not be significantly affected, since the degree of radiation attenuation and scattering are largely determined by the phantom.
In order to create images that are clinically useful, the CBCT system must have sufficient contrast-to-noise and spatial resolution performance. Table II lists the CNR values at 3.08 cGy obtained from this study and the modulation transfer function (MTF) values at 0.5 and 1 line pair/mm obtained for the same segmented detector configurations from previous Monte Carlo studies.50 For comparison, MTF values obtained from measurements with a conventional MV AMFPI, with a pixel pitch of 0.508 mm and employing a Lanex Fast B (Eastman Kodak) phosphor screen equivalent to that simulated in the present study, are also shown.38 The MTF values of the segmented detectors are all observed to be higher than that of the phosphor screen at both spatial frequencies, except for the case of the 40 mm thick, segmented CsI detector with low density septal walls at 0.5 line pair/mm. Note that the MTF values of the segmented detectors represent the spatial resolution at the center of the detector, where the incident radiation is perpendicular to the detector. The spatial resolution at oblique angles will degrade for detectors with non-focused geometries.64 Due to the limited area of the radiation field (~8.5 × 3.2 cm2), the CNR results represent radiation incident at very small oblique angles (less than 2°), and is not expected to differ greatly from what would be achieved if focused detector geometries were employed. Therefore, it is anticipated that segmented detectors with focused geometries would provide significantly improved CNR, as well as equivalent, or enhanced spatial resolution performance compared to the phosphor screen detectors used in conventional MV AMFPIs.
TABLE II.
For the various segmented detectors (columns 2 –9) and the phosphor screen detector (column 10), CNR results for the liver-equivalent object at 3.08 cGy (CNRLiver) are shown. The CNR result for the phosphor screen detector was interpolated from the slope of CNR2 versus dose results illustrated in Fig. 11. Also shown are MTF results at 0.5 and 1.0 line pair/mm (MTF0.5 and MTF1.0) obtained from a previous study of Monte Carlo simulations of radiation energy deposition involving the same segmented detector configurations.48 For comparison, MTF results obtained from measurements36 with an MV AMFPI employing a phosphor screen (Lanex Fast B, Eastman Kodak) equivalent to that simulated in the present study are also listed in the last column. Note that, for segmented detectors, the first row indicates the detector thickness and scintillator material, and the second row indicates the septal wall density.
| X-ray Detector | 10 mm CsI | 40 mm CsI | 10 mm BGO | 40 mm BGO | Phosphor Screen | ||||
|---|---|---|---|---|---|---|---|---|---|
| Low | High | Low | High | Low | High | Low | High | ||
| CNRLiver | 1.21 | 1.12 | 1.88 | 1.66 | 1.40 | 1.23 | 2.00 | 1.80 | 0.27 |
| MTF0.5 | 0.41 | 0.55 | 0.33 | 0.46 | 0.49 | 0.58 | 0.39 | 0.48 | 0.37 |
| MTF1.0 | 0.20 | 0.29 | 0.15 | 0.26 | 0.25 | 0.33 | 0.19 | 0.27 | 0.12 |
It must be emphasized that the present study does not include simulation of optical transport in the scintillator. Inclusion of optical transport will certainly affect the CNR and MTF performance predicted by radiation transport only. For segmented detectors, if the septal walls are made to be optically opaque, the spatial resolution will not be affected by optical transport, but CNR will degrade due to optical Swank noise, which originates from depth-dependent variation in the x-ray-to-photon conversion gain. Investigation of this noise source using a recently implemented Monte Carlo package (MANTIS)65 combining a radiation transport code (PENELOPE-2005)66 and an optical transport code (DETECT-II)67 is presently underway. It is anticipated that the optical Swank factor can be made relatively high (>90%) through optimization of detector designs. If the septal walls are not perfectly opaque, element-to-element optical crosstalk will occur, and the spatial resolution of the resulting CT images will degrade. However, the noise level will decrease with increasing optical crosstalk due to increased blurring, resulting in an increase in CNR. For the phosphor screen detector, inclusion of optical transport would lead to two competing effects on the Noise performance. While lateral spread of optical photons will result in more statistical averaging in the reconstructed images, thereby reducing Noise, the corresponding optical Swank factor, which is less than unity, will result in an increase in Noise. Therefore, the net effect on CNR performance will be determined by the relative magnitude of these two competing effects.
In summary, the results of this study indicate that MV CBCT systems employing thick, segmented scintillating detectors can potentially be used to visualize soft tissue structures at clinically acceptable doses. In order for such detectors to achieve optimum performance for low dose MV CBCT, many design aspects and detector properties will need to be further investigated and optimized – which we believe will be greatly assisted by Monte Carlo simulations of radiation and optical transport.
ACKNOWLEDGEMENTS
The authors would like to thank Dr. Jeffrey Fessler for providing the cone-beam CT reconstruction algorithm used in this study. We also appreciate Dr. Mahdokht Behravan for her assistance in proofreading. This work was supported by NIH Grant RO1 CA51397.
APPENDIX
For a Monte Carlo simulation using a given detector and phantom combination, the statistical uncertainty in the signal of voxels in a reconstructed image (Δμ) can be estimated from the statistical uncertainties in the signal of pixels in projection images (ΔI), using a previously described method.63 The Monte Carlo simulation can output the pixel signal (I(x,y,θ)) and the relative statistical uncertainty associated with that signal for a projection image, where x and y indicate the coordinates of the pixel and θ indicates the projection angle. It is found that, in a projection image, the values of were relatively similar for all the pixels in the region of interest. Therefore, a mean value of statistical uncertainty , obtained by averaging for all the pixels in the region of interest, was used to represent the statistical uncertainty for all the pixels in this projection image. Also, it is observed that, at all projection angles, the values of were almost identical. Therefore, a mean value of statistical uncertainty , obtained by averaging for all the projection angles, was used to represent the statistical uncertainty in the pixel signals in the projection images at all the angles for this simulation.
The line integral (l), as shown in Eq. (2), was obtained from the phantom image signal (I1) and the averaged flood-field image signal (I0). Due to the effect of this averaging, the relative statistical uncertainty in I0 is much smaller than that in I1. Therefore, the statistical uncertainty in the line integrals (Δl) can be estimated68 from:
| (A1) |
As shown in Eq. (13) of Ref.63, the root mean square error of the reconstructed voxel signal (Δμ) can be expressed using the statistical uncertainty in the line integrals:
| (A2) |
where D is the diameter of the reconstructed cylinder (60.96 mm), d is the voxel pitch in the reconstructed image (0.508 mm), and n is the number of coplanar paths, which is equal to the product of the number of projections (180) and the number of AMFPI pixels covering the phantom in the scanning direction (128). With these parameter values and using Eq. (A1), Eq. (A2) becomes:
| (A3) |
In this study, multiple reconstructed slices were averaged to obtain better statistics. The statistical uncertainty in an averaged slice image (Δμs) can be expressed as:
| (A4) |
where ns is the number of slices averaged.
In addition, the cupping artifact was removed in the averaged slice image using the correction factors μc(r), where r indicate the radial distance from the center of the phantom. The statistical uncertainty in these correction factors [Δμc(r)] can be expressed as:
| (A5) |
where nc(r) is the number of voxels averaged for obtaining the correction factor at a radial distance r. In the region selected for evaluation, nc(r) is at least 32, resulting in values for Δμc(r) that are much smaller than for Δμs. The statistical uncertainty in the voxel signal after cupping artifact removal (Δμvox) can be estimated from Δμs and Δμc(r):
| (A6) |
Therefore, the statistical uncertainties in the mean signal of water background (Δμwater) and object (Δμobj) can be expressed as:
| (A7) |
and
| (A8) |
where nwater and nobj are the number of voxels in the region of the water background and the object, respectively. Note that nwater is equal to 7756 for the one-object phantom and 4508 for the three-object phantom, while nobj is equal to 912 for all the examined objects. Moreover, the statistical uncertainty in the standard deviation of the voxel signals in the region of the object (Δσobj) can be expressed as:
| (A9) |
Therefore, the relative error in the Contrast of the object can be expressed as:
| (A10) |
Furthermore, the relative error in the Noise in the region of the object can be expressed as:
| (A11) |
Finally, the relative error in the CNR of the object can be expressed as:
| (A12) |
REFERENCES
- 1.Purdy JA. Advances in three-dimensional treatment planning and conformal dose delivery. Semin. Oncol. 1997;24:655–671. [PubMed] [Google Scholar]
- 2.Purdy JA. Intensity-modulated radiation therapy. Int. J. Radiat. Oncol., Biol., Phys. 1996;35:845–846. doi: 10.1016/0360-3016(96)00223-4. [DOI] [PubMed] [Google Scholar]
- 3.Mackie TR, et al. Image guidance for precise conformal radiotherapy. Int. J. Radiat. Oncol., Biol., Phys. 2003;56:89–105. doi: 10.1016/s0360-3016(03)00090-7. [DOI] [PubMed] [Google Scholar]
- 4.Jaffray DA, Drake DG, Moreau M, Martinez AA, Wong JW. A Radiographic and Tomographic Imaging System Integrated into a Medical Linear Accelerator for Localization of Bone and Soft-Tissue Targets. Int. J. Radiat. Oncol., Biol., Phys. 1999;45:773–789. doi: 10.1016/s0360-3016(99)00118-2. [DOI] [PubMed] [Google Scholar]
- 5.Jaffray DA, Siewerdsen JH. Cone-beam computed tomography with a flat-panel imager: initial performance characterization. Med. Phys. 2000;27:1311–1323. doi: 10.1118/1.599009. [DOI] [PubMed] [Google Scholar]
- 6.Siewerdsen JH, Jaffray DA. Cone-beam computed tomography with a flat-panel imager: magnitude and effects of x-ray scatter. Med. Phys. 2001;28:220–231. doi: 10.1118/1.1339879. [DOI] [PubMed] [Google Scholar]
- 7.Jaffray DA, Siewerdsen JH, Wong JW, Martinez AA. Flat-panel cone-beam computed tomography for image-guided radiation therapy. Int. J. Radiat. Oncol., Biol., Phys. 2002;53:1337–1349. doi: 10.1016/s0360-3016(02)02884-5. [DOI] [PubMed] [Google Scholar]
- 8.Groh BA, Siewerdsen JH, Drake DG, Wong JW, Jaffray DA. A performance comparison of flat-panel imager-based MV and kV cone-beam CT. Med. Phys. 2002;29:967–975. doi: 10.1118/1.1477234. [DOI] [PubMed] [Google Scholar]
- 9.Graham SA, Moseley DJ, Siewerdsen JH, Jaffray DA. Compensators for dose and scatter management in cone-beam computed tomography. 2007;34:2691–2703. doi: 10.1118/1.2740466. [DOI] [PubMed] [Google Scholar]
- 10.Oelfke U, et al. Linac-integrated kV-cone beam CT: technical features and first applications. Med. Dosim. 2006;31:62–70. doi: 10.1016/j.meddos.2005.12.008. [DOI] [PubMed] [Google Scholar]
- 11.Letourneau D, et al. Cone-beam-CT guided radiation therapy: technical implementation. Radiother. Oncol. 2005;75:279–286. doi: 10.1016/j.radonc.2005.03.001. [DOI] [PubMed] [Google Scholar]
- 12.Barker JL, Jr., et al. Quantification of volumetric and geometric changes occurring during fractionated radiotherapy for head-and-neck cancer using an integrated CT/linear accelerator system. Int. J. Radiat. Oncol., Biol., Phys. 2004;59:960–970. doi: 10.1016/j.ijrobp.2003.12.024. [DOI] [PubMed] [Google Scholar]
- 13.Kuriyama K, et al. A New Irradiation Unit Constructed of Self-Moving Gantry-CT and Linac. Int. J. Radiat. Oncol., Biol., Phys. 2003;55:428–435. doi: 10.1016/s0360-3016(02)03987-1. [DOI] [PubMed] [Google Scholar]
- 14.Balter JM, et al. Daily Targeting of Intrahepatic Tumors for Radiotherapy. Int. J. Radiat. Oncol., Biol., Phys. 2002;52:266–271. doi: 10.1016/s0360-3016(01)01815-6. [DOI] [PubMed] [Google Scholar]
- 15.Lattanzi J, McNeeley S, Hanlon A, Schultheiss TE, Hanks GE. Ultrasound-Based Stereotactic Guidance of Precision Conformal External Beam Radiation Therapy in Clinically Localized Prostate Cancer. Urology. 2000;55:73–78. doi: 10.1016/s0090-4295(99)00389-1. [DOI] [PubMed] [Google Scholar]
- 16.Langen KM, et al. The use of megavoltage CT (MVCT) images for dose recomputations. Phys. Med. Biol. 2005;50:4259–4276. doi: 10.1088/0031-9155/50/18/002. [DOI] [PubMed] [Google Scholar]
- 17.Meeks SL, et al. Ultrasound-Guided Extracranial Radiosurgery: Technique and Application. Int. J. Radiat. Oncol., Biol., Phys. 2003;55:1092–1101. doi: 10.1016/s0360-3016(02)04406-1. [DOI] [PubMed] [Google Scholar]
- 18.Simpson RG, Chen CT, Grubbs EA, Swindell W. A 4-MV CT Scanner for Radiation Therapy: The Prototype System. Med. Phys. 1982;9:574–579. doi: 10.1118/1.595102. [DOI] [PubMed] [Google Scholar]
- 19.Swindell W, Simpson RG, Oleson JR, Chen C, Grubbs EA. Computed Tomography with a Linear Accelerator with Radiotherapy Applications. Med. Phys. 1983;10:416–420. doi: 10.1118/1.595391. [DOI] [PubMed] [Google Scholar]
- 20.Mosleh-Shirazi MA, Evans PM, Swindell W, Webb S, Partridge M. A cone-beam megavoltage CT scanner for treatment verification in conformal radiotherapy. Radiother. Oncol. 1998;48:319–328. doi: 10.1016/s0167-8140(98)00042-5. [DOI] [PubMed] [Google Scholar]
- 21.Pouliot J, et al. Low-dose megavoltage cone-beam CT for radiation therapy. Int. J. Radiat. Oncol., Biol., Phys. 2005;61:552–560. doi: 10.1016/j.ijrobp.2004.10.011. [DOI] [PubMed] [Google Scholar]
- 22.Morin O, et al. Megavoltage cone-beam CT: system description and clinical applications. Med. Dos. 2006;31:51–61. doi: 10.1016/j.meddos.2005.12.009. [DOI] [PubMed] [Google Scholar]
- 23.Morin O, et al. Patient dose considerations for routine megavoltage cone-beam CT imaging. Med. Phys. 2007;34:1819–1827. doi: 10.1118/1.2722470. [DOI] [PubMed] [Google Scholar]
- 24.Ford EC, et al. Cone-beam CT with megavoltage beams and an amorphous silicon electronic portal imaging device: potential for verification of radiotherapy of lung cancer. Med. Phys. 2002;29:2913–2924. doi: 10.1118/1.1517614. [DOI] [PubMed] [Google Scholar]
- 25.Seppi EJ, et al. Megavoltage cone-beam computed tomography using a high-efficiency image receptor. Med. Phys. 2003;55:793–803. doi: 10.1016/s0360-3016(02)04155-x. [DOI] [PubMed] [Google Scholar]
- 26.Chang J, et al. Integrating respiratory gating into a megavoltage cone-beam CT system. Med. Phys. 2006;33:2354–2361. doi: 10.1118/1.2207136. [DOI] [PubMed] [Google Scholar]
- 27.Sillanpaa J, et al. Developments in megavoltage cone beam CT with an amorphous silicon EPID: reduction of exposure and synchronization with respiratory gating. Med. Phys. 2005;32:819–829. doi: 10.1118/1.1861522. [DOI] [PubMed] [Google Scholar]
- 28.Sillanpaa J, et al. Low-dose megavoltage cone-beam computed tomography for lung tumors using a high-efficiency image receptor. Med. Phys. 2006;33:3489–3497. doi: 10.1118/1.2222075. [DOI] [PubMed] [Google Scholar]
- 29.Hansen EK, et al. Image-guided radiotherapy using megavoltage cone-beam computed tomography for treatment of paraspinous tumors in the presence of orthopedic hardware. Int. J. Radiat. Oncol., Biol., Phys. 2006;66:323–326. doi: 10.1016/j.ijrobp.2006.05.038. [DOI] [PubMed] [Google Scholar]
- 30.Ghelmansarai FA, et al. Soft Tissue Visualization Using a Highly Efficient Megavoltage Cone Beam CT Imaging System. Proc. SPIE. 2005;5745:159–170. [Google Scholar]
- 31.Midgley S, Millar RM, Dudson J. A feasibility study for megavoltage cone beam CT using a commercial EPID. Phys. Med. Biol. 1998;43:155–169. doi: 10.1088/0031-9155/43/1/010. [DOI] [PubMed] [Google Scholar]
- 32.Pang G, Mei X, Rowlands JA. Development of a Novel High Quantum Efficiency Flat Panel Detector for Megavoltage Cone Beam CT/DT: Construction and Evaluation of a Prototype Single-Row Detector. Med. Phys. 2006;33:2281. [Google Scholar]
- 33.Keller H, et al. Monte Carlo study of a highly efficient gas ionization detector for megavoltage imaging and image-guided radiotherapy. Med. Phys. 2002;29:165–175. doi: 10.1118/1.1445414. [DOI] [PubMed] [Google Scholar]
- 34.Amols H, Jaffray DA, Orton CG. Image-guided radiotherapy is being overvalued as a clinical tool in radiation oncology. Med. Phys. 2006;33:3583–3586. doi: 10.1118/1.2211707. [DOI] [PubMed] [Google Scholar]
- 35.Morin O, et al. Dose Calculation Using Megavoltage Cone Beam CT Imaging. Int. J. Radiat. Oncol., Biol., Phys. 2005;63:S62–S63. doi: 10.1016/j.ijrobp.2006.10.048. [DOI] [PubMed] [Google Scholar]
- 36.Guan H, Yin FF, Kim JH. Accuracy of inhomogeneity correction in photon radiotherapy from CT scans with different settings. Phys. Med. Biol. 2002;47:N223–N231. doi: 10.1088/0031-9155/47/17/402. [DOI] [PubMed] [Google Scholar]
- 37.Yin FF, Guan H, Lu W. A technique for on-board CT reconstruction using both kilovoltage and megavoltage beam projections for 3D treatment verification. Med. Phys. 2005;32:2819–2826. doi: 10.1118/1.1997307. [DOI] [PubMed] [Google Scholar]
- 38.El-Mohri Y, Jee K-W, Antonuk LE, Maolinbay M, Zhao Q. Determination of the Detective Quantum Efficiency of a Prototype, Megavoltage Indirect Detection, Active Matrix Flat-Panel Imager. Med. Phys. 2001;28:2538–2550. doi: 10.1118/1.1413516. [DOI] [PubMed] [Google Scholar]
- 39.Antonuk LE. Electronic portal imaging devices: A review and historical perspective of contemporary technologies and research. Phys. Med. Biol. 2002;47:R3l–R65. [PubMed] [Google Scholar]
- 40.Pang G, Rowlands JA. Development of high quantum efficiency, flat panel, thick detectors for megavoltage x-ray imaging: a novel direct-conversion design and its feasibility. Med. Phys. 2004;31:3004–3016. doi: 10.1118/1.1803771. [DOI] [PubMed] [Google Scholar]
- 41.Morton EJ, Swindell W, Lewis DG, Evans PM. A linear array, scintillation crystal-photodiode detector for megavoltage imaging. Med. Phys. 1991;18:681–691. doi: 10.1118/1.596661. [DOI] [PubMed] [Google Scholar]
- 42.Lewis DG, Swindell W, Morton EJ, Evans PM, Xiao ZR. A megavoltage CT scanner for radiotherapy verification. Phys. Med. Biol. 1992;37:1985–1999. doi: 10.1088/0031-9155/37/10/013. [DOI] [PubMed] [Google Scholar]
- 43.Nakagawa K, et al. Real-time beam monitoring in dynamic conformation therapy. Int. J. Radiat. Oncol., Biol., Phys. 1994;30:1233–1238. doi: 10.1016/0360-3016(94)90334-4. [DOI] [PubMed] [Google Scholar]
- 44.Rathee S, Tu D, Monajemi TT, Rickey DW, Fallone BG. A bench-top megavoltage fan-beam CT using CdWO4-photodiode detectors. I. System description and detector characterization. Med. Phys. 2006;33:1078–1089. doi: 10.1118/1.2181290. [DOI] [PubMed] [Google Scholar]
- 45.Monajemi TT, Tu D, Fallone BG, Rathee S. A bench-top megavoltage fan-beam CT using CdWO4-photodiode detectors. II. Image performance evaluation. Med. Phys. 2006;33:1090–1100. doi: 10.1118/1.2181291. [DOI] [PubMed] [Google Scholar]
- 46.Mosleh-Shirazi MA, Swindell W, Evans PM. Optimization of the Scintillation Detector in a Combined 3D Megavoltage CT Scanner and Portal Imager. Med. Phys. 1998;25:1880–1890. doi: 10.1118/1.598377. [DOI] [PubMed] [Google Scholar]
- 47.Mosleh-Shirazi MA, et al. Rapid Portal Imaging with a High-Efficiency, Large Field-of-View Detector. Med. Phys. 1998;25:2333–2346. doi: 10.1118/1.598443. [DOI] [PubMed] [Google Scholar]
- 48.Mei X, Rowlands JA, Pang G. Electronic portal imaging based on Cerenkov radiation: A new approach and its feasibility. Med. Phys. 2006;33:4258–4270. doi: 10.1118/1.2362875. [DOI] [PubMed] [Google Scholar]
- 49.Ostapiak OZ, O'Brien PF, Faddegon BA. Megavoltage imaging with low Z targets: implementation and characterization of an investigational system. Med. Phys. 1998;25:1910–1918. doi: 10.1118/1.598380. [DOI] [PubMed] [Google Scholar]
- 50.Sawant A, et al. Segmented Crystalline Scintillators: An Initial Investigation of High Quantum Efficiency Detectors for Megavoltage X-Ray Imaging. Med. Phys. 2005;32:3067–3083. doi: 10.1118/1.2008407. [DOI] [PubMed] [Google Scholar]
- 51.Sawant A, et al. Segmented Crystalline Scintillators: Empirical and Theoretical Investigation of a High Quantum Efficiency EPID Based on an Initial Engineering Prototype CsI(Tl) Detector. Med. Phys. 2006;33:1053–1066. doi: 10.1118/1.2178452. [DOI] [PubMed] [Google Scholar]
- 52.Sheikh-Bagheri D. Ph.D. Thesis. Department of Physics, Carleton University; 1999. Monte Carlo Study of Photon Beams from Medical Linear Accelerators: Optimization, Benchmark and Spectra. [Google Scholar]
- 53.Yu MK, Sloboda RS, Murray B. Linear accelerator photon beam quality at off-axis points. 1997;24:233–239. doi: 10.1118/1.598069. [DOI] [PubMed] [Google Scholar]
- 54.Antonuk LE, et al. Initial Performance Evaluation of an Indirect-Detection, Active Matrix Flat-Panel Imager (AMFPI) Prototype for Megavoltage Imaging. Int. J. Radiat. Oncol., Biol., Phys. 1998;42:437–454. doi: 10.1016/s0360-3016(98)00210-7. [DOI] [PubMed] [Google Scholar]
- 55.Data sheet of tissue characterization phantom (Gammex 467) Gammex RMI Inc.; Wisconsin, U.S.A.: 2006. [Google Scholar]
- 56.International Commission on Radiation Units and Measurements (ICRU) Report 46, Photon, Electron, Proton and Neutron Interaction Data for Body Tissues. ICRU Publications; Bethesda, Maryland: 1992. [Google Scholar]
- 57.Kawrakow I, Rogers DWO. Technical Report PIRS-701. National Research Council of Canada; Ottawa, Canada: 2000. The EGSnrc Code System: Monte Carlo Simulation of Electron and Photon Transport. [Google Scholar]
- 58.Treurniet JA, Walters BRB, Rogers DWO. NRC Report PIRS 0623. National Research Council of Canada; Ottawa, Canada: 2001. BEAMnrc, DOSXYZnrc and BEAMDP GUI User's Manual. [Google Scholar]
- 59.Glover GH. Compton scatter effects in CT reconstructions. Med. Phys. 1982;9:860–867. doi: 10.1118/1.595197. [DOI] [PubMed] [Google Scholar]
- 60.Ning R, et al. Flat panel detector-based cone-beam volume CT angiography imaging: system evaluation. IEEE Trans. Med. Imaging. 2000;19:949–963. doi: 10.1109/42.887842. [DOI] [PubMed] [Google Scholar]
- 61.Kachelriess M, Sourbelle K, Kalender WA. Empirical cupping correction: a first-order raw data precorrection for cone-beam computed tomography. Med. Phys. 2006;33:1269–1274. doi: 10.1118/1.2188076. [DOI] [PubMed] [Google Scholar]
- 62.Feldkamp LA, Davis LC, Kress JW. Practical cone-beam algorithm. J. Opt. Soc. Am. A. 1984;1:612–619. [Google Scholar]
- 63.Huesman RH. The effects of a finite number of projection angles and finite lateral sampling of projections on the propagation of statistical errors in transverse section reconstruction. Phys. Med. Biol. 1977;22:511–521. doi: 10.1088/0031-9155/22/3/012. [DOI] [PubMed] [Google Scholar]
- 64.Monajemi TT, Fallone BG, Rathee S. Thick, segmented CdWO4-photodiode detector for cone beam megavoltage CT: a Monte Carlo study of system design parameters. Med. Phys. 2006;33:4567–4577. doi: 10.1118/1.2370503. [DOI] [PubMed] [Google Scholar]
- 65.Badano A, Sempau J. MANTIS: combined x-ray, electron and optical Monte Carlo simulations of indirect radiation imaging systems. Phys. Med. Biol. 2006;51:1545–1561. doi: 10.1088/0031-9155/51/6/013. [DOI] [PubMed] [Google Scholar]
- 66.Salvat F, Fernández-Varea JM, Sempau J. PENELOPE, A code system for monte carlo simulation of electron and photon transport. Issy-les-Moulineaux; France: 2003. [Google Scholar]
- 67.Badano A. Ph.D. Thesis. Center for Integrated Microsystems, University of Michigan; 1999. Image quality degradation by light scattering processes in high performance display devices for medical imaging. [Google Scholar]
- 68.Taylor JR. An Introduction to Error Analysis: The Study of Uncertainties in Physical Measurements. 2nd ed. University Science Books; California: 1997. [Google Scholar]


