

Abstract
Heme is emerging as a key player in the synchrony of circadian-coupled transcriptional regulation. Current evidence suggests that levels of circadian-linked transcription are regulated in response to both the availability of intracellular heme and by heme-based sensing of carbon monoxide and possibly nitric oxide. The protein CLOCK is central to the regulation and maintenance of circadian rhythms in mammals. CLOCK comprises two PAS domains, each with a heme binding site. Our studies focus on the functionality of the Murine CLOCK PAS–A domain (residues 103-265). We show that CLOCK PAS–A binds Fe(III) protoporhyrin IX to form a complex with 1:1 stoichiometry. Optical absorbance and resonance Raman studies reveal that the heme of ferric CLOCK PAS–A is a six-coordinate, low spin complex whose resonance Raman signature is insensitive to pH over the range of protein stability. Ferrous CLOCK PAS–A is a mixture of five-coordinate, high spin and six-coordinate, low spin complexes. Ferrous CLOCK PAS–A forms complexes with CO and NO. Ferric CLOCK PAS–A undergoes reductive nitrosylation in the presence of NO to generate a CLOCK PAS–A–NO, which is a pentacoordinate {FeNO}7 complex. Formation of the highly stable {FeNO}7 heme complex from either ferrous or ferric heme makes possible the binding of NO at very low concentration, a characteristic of NO sensors. Comparison of the spectroscopic properties and CO binding kinetics of CLOCK PAS–A with other CO sensor proteins reveals that CLOCK PAS–A exhibits chemical properties consistent with a heme-based gas sensor protein.
Introduction
The cyclic nature of circadian-coupled gene regulation has long been the subject of intense study. Many of the circadian-linked genes are known and many proteins have been identified as important players in the transcriptional regulation of those genes. Crucial to that regulation are negative feedback pathways wherein the products of circadian-linked genes serve to inhibit their own transcription. The timing of this negative feedback is influenced exogenously by the solar cycle through sensitivity of some circadian proteins to ambient light and endogenously through the availability of metabolic intermediates and products necessary for circadian-linked processes. Thus, the negative feedback into transcriptional regulation provides the biochemical basis for the periodicity of many enzyme activities, biological functions, and responses while both internal and external input from metabolism and ambient light synchronizes the cycle to the solar day and availability of fuel, respectively.1
Although recent years have seen tremendous expansion in genetically-based knowledge of the circadian systems, molecular level insight into the regulatory mechanisms has been slower to emerge. However, that insight is likely to grow substantially with the ongoing growth in biophysical studies of the circadian regulatory proteins. A more complete understanding of circadian-coupled transcriptional regulation is of general as well as biomedical interest. It has been suggested, for example, that the toxicity of pharmaceutical agents, and the stresses of damaging therapies, could vary within the cycle of the circadian clock. If the genetics and biochemistry of those variations can be understood, it may be possible to optimize the timing of certain therapies or perhaps even exogenously manipulate all or part of the circadian cycle to minimize the deleterious effects of physiologically and/or psychologically harsh clinical treatments. The present contribution offers a brief account of the bioinorganic aspects of circadian regulation along with the results of a study carried out in the authors laboratories to (a) characterize CLOCK, a key metalloprotein in the central circadian oscillator and (b) address its potential role as a diatomic gas sensor.
Heme is emerging as a key cofactor in circadian-coupled transcriptional regulation. Recent literature accounts have revealed a number of regulatory proteins whose functions depend on either containing or binding heme. They include the nuclear hormone receptors (NHRs), E75, Rev–erbα and Rev–erbβ,2-5 the transcription factors, NPAS2 (Neuronal Period-Aryl hydrocarbon receptor n6uclear translocator-Simple minded protein 2), CLOCK, and mPer2 (mouse Period protein 2). The roles of heme in the contributions of these proteins to periodic behaviors appears to fall into two classes, sensing of heme and sensing of one or more of the diatomic gas molecules CO, NO, and O2.
For the NHRs, E75, Rev–erbα and Rev–erbβ, heme is a signaling molecule and target for binding.2-5 Current evidence suggests that, through a redox-coupled, ligand switching mechanism, wherein the axial heme ligands have recently been revealed,6,7 heme binding to the NHR modulates its association with a corepressor protein complex containing a histone deacetylase (HDAC).1 This complex represses transcription of the Bmal1 (Brain and Muscle Arnt-Like 1) gene. The bHLH (basic Helix-Loop-Helix) protein encoded on Bmal1 is known to form heterodimeric complexes with CLOCK and with NPAS2, which are also members of the bHLH class. These proteins, each comprise two heme-binding PAS (Period-Aryl hydrocarbon receptor nuclear transplocator-Simple minded) domains. In the presence of NAD(P)H, both CLOCK:BMAL1 and NPAS2:BMAL1 target E-box promoter sequences, which activates transcription of circadian linked genes.8 Thus, the availability of BMAL1, as regulated by the heme-binding NHRs, in conjunction with CLOCK and NPAS2, modulates the transcription of circadian-linked genes.
Circadian-linked enzyme activities include aminolevulinic acid synthase (ALAS) and nitric oxide synthase (NOS). The enzyme ALAS catalyzes the synthesis of aminolevulinic acid from glycine and the tricarboxylic (citric) acid (TCA) cycle intermediate, succinyl-CoA. The reaction catalyzed by ALAS is the rate-limiting step in heme biosynthesis. Thus, it has been suggested that the heme-dependent feedback control of ALAS activity constitutes the time-dependent coupling between metabolism and circadian rhythms.3,5,9 The timing of BMAL1-dependent transcriptional activation is important in the central, CLOCK-dependent and the peripheral, NPAS2-dependent circadian oscillators.
The second likely role of heme in circadian regulation is the sensing of changes in availability of one or more diatomic ligands. Interchangeable heme axial ligand sets analogous to those of the bacterial heme-based redox/CO sensors, RrCooA and BxRcoM have been identified in NPAS2,10 E75 and Rev–erbβ6,7 and all have been shown to bind CO and most bind NO in their ferrous states. It is also interesting to consider the coupling between the sensing of heme by the E75 and Rev–erbβ NHRs and their possible sensing of the ligands, CO and/or NO, by reversible binding to the heme-loaded NHRs.6,7 Whereas binding of heme to the NHRs would serve to repress transcription of Bmal1, NO and/or CO could modulate that repression either by changing the affinities of the NHRs for heme or, more likely, by driving the formation of one or more NHR conformational states that modulate their affinities for the corepressor. These behaviors of the NHRs with heme suggest the possibility for multiple modes of sensing in circadian-linked transcriptional regulation by these proteins, giving their function sensitivity to both heme availability and P(XO) (XO=CO or NO). While there is evidence of a role for CO in transcriptional activity of NPAS2, to date no direct influence of CO or NO on transcriptional activity of CLOCK or the NHRs has been reported.6,7 Nevertheless, given the considerable affinities of heme for CO and NO and the fact that availabilities of CO and NO are cyclic and circadian coupled,11-13 the possibility that the PAS domains of CLOCK are sensors for CO and/or NO was investigated in the present study.
The protein CLOCK is central to the regulation and maintenance of circadian rhythms. CLOCK is a member of the bHLH–PAS family of transcription factors. The family of PAS folds comprises domains ranging from 100 to 160 amino acids which, in the case of these bHLH proteins, are located downstream of the bHLH domain involved in DNA binding.14 A number of PAS domains are known to bind cofactors that sense changes in their chemical environment, such as P(O2), P(CO), and electrochemical potential. The sensing reactions, which can involve reversible binding of a diatomic ligand or reversible oxidation and reduction of a heme or other cofactor (vide supra), modulate biochemical responses to changing conditions. Enzyme activities in sensor kinases and phosphodiesterases are modulated by heme-based O2 and redox sensors in bacteria.15 Additionally, transcription of genes encoding the enzymes necessary for CO metabolism are directly regulated by CooA in response to the availability of CO.16 In the case of NPAS2, evidence suggests that binding of CO by the heme cofactor modulates its association with BMAL1 to regulate gene transcription in the forebrain.17 In the suprachiasmatic nucleus, binding of the heterodimeric complex between CLOCK and BMAL1 to E-box elements of the respective promoter/enhancer regions activates transcription of Period (PER) 1 and 2 and Cryptochrome (CRY) 1 and 2.
CLOCK shares its heterodimeric partner, BMAL1, with NPAS2, a transcription factor concentrated in the somatosensory cerebral cortex.18 CLOCK and NPAS2 have significant sequence similarity, and both proteins contain two PAS domains (PAS–A and PAS–B).19,20 In NPAS2, the first eukaryotic heme-containing PAS domain protein reported, each PAS domain binds a single heme. It has been proposed that heme-binding to NPAS2 generates a CO-specific sensor responsible for regulating its DNA binding activity.17 In vitro CO ligation of the heme in NPAS2 inhibits formation of the NPAS2:BMAL1 complex; this heterodimeric complex is required for transcription of NPAS2/BMAL1 regulated target genes. For NPAS2–PAS–A, a redox-sensitive heme ligand switch has been reported.10 The Cys170 and His119 residues constitute the axial ligand set for ferric NPAS2 PAS–A; upon reduction, Cys170 is replaced with His171. Binding of CO yields a 6c complex, but it is unclear which of the endogenous His ligands is displaced by CO.
Two bacterial heme-based CO sensors, RcoM from B. xenovorans and the CooAs from R. rubrum and C. hydrogenoformans, have been reported.21-24 BxRcoM–2, a recently discovered heme-based CO sensor, consists of a heme-binding PAS domain and a LytR DNA-binding domain.25 It, like the eukaryotic NPAS2–PAS–A, appears to undergo a redox-coupled exchange of endogenous heme ligands. When BxRcoM–2 binds ferric heme, the heme axial ligand set comprises a Cys thiolate side chain and the imidazole group of a His residue. Upon reduction, Cys is replaced by Met104 which is replaced when CO binds.24 In contrast, RrCooA does not contain a PAS domain. However, it is the most extensively characterized of the heme-based CO sensor proteins. Binding of CO by RrCooA activates transcription of the genes necessary for utilization of CO for anaerobic respiration in R. rubrum. RrCooA comprises two domains, an N-terminal heme-containing regulatory domain and a C-terminal DNA-binding domain; it functions as a homodimer.26 In this homodimer, each regulatory domain binds one heme and the axial ligation depends upon the iron oxidation state. In the ferric form, the hemes are each ligated by a Cys and a Pro residue.27 Upon reduction, a ligand switch occurs in which the Cys is replaced by a His residue.28,29 When the CO complex forms, the Pro residue is displaced by CO. It has been proposed that this CO binding event initiates a global conformational change that communicates the axial heme ligand exchange reaction to the DNA binding domain.30,31
In addition to the NPAS2 and BxRcoM CO sensors already described, heme-binding PAS domains are found in several other proteins in which they detect environmental signals via small molecule binding to their heme. For example, oxygen binding to heme-binding PAS domain proteins like FixL, a histidine kinase, EcDOS, a phosphdiesterase, and AxPDEA1, a cyclic-di-GMP phosphodiesterase, controls their enzymatic activities and thus, their respective cellular signal transduction pathways which determine responses to environmental changes.32
The circadian control of nitric oxide synthase expression11 suggests that the product of its enzymatic reaction, NO, might be sensed to provide negative feedback as input to the circadian cycle. Therefore, there is a potential role for any of the candidate heme-based circadian sensors in NO sensing. Despite the well known coordination chemistry of both ferric and ferrous hemes with NO and, although the phenomenon of heme-based NO sensing has been widely studied, no heme-based NO sensors have been identified to date as being involved in circadian regulation.
Here we report the initial biophysical examination of the PAS–A domain of murine CLOCK (CLOCK PAS–A), whose sequence is 65% identical to that of NPAS2 PAS–A, and consider its potential function as a heme-based NO and/or CO sensor. Optical absorbance and resonance Raman spectroscopy confirm that the isolated CLOCK PAS–A domain (CLOCK PAS–A, residues 103-265) has a heme binding site. The ferric, ferrous, ferrous–CO and ferrous–NO forms of holoCLOCK PAS–A have been characterized spectroscopically and are herein compared to those of the analogous complexes reported for NPAS2 and other heme-based sensor proteins. Ferrous CLOCK PAS–A–NO, {FeNO}7, was identified upon reaction of either ferric or ferrous CLOCK PAS–A with NO. The results of this study reveal that CLOCK PAS–A binds heme and has spectroscopic properties similar to those of other PAS domain proteins that are known to be heme-based sensors.
Materials and Methods
Cloning
A cDNA fragment corresponding to amino acids 103-265 of murine CLOCK PAS–A (CLOCK PAS–A) was cloned into an expression vector encoding an N-terminal H6-tag followed by a TEV protease cleavage site. Correct plasmid sequence was verified by DNA sequencing.
Expression and Purification
E. coli BL21 (DE3) competent cells were transformed with the CLOCK PAS–A plasmid. Cells were grown in LB media at 37 °C. At an OD600 of about 0.8, the temperature was changed to 15 °C. After 45 minutes, cells were induced with 1 mM IPTG for overnight protein expression. Cells were harvested by centrifugation at 4000×g for 30 minutes, then resuspended in 50 mM sodium phosphate, pH 7.5, 300 mM NaCl pH 7.5 (Buffer 1) with 5 mM imidazole and lysed using an EmulsiFlex C5 homogenizer (Avestin). Centrifugation at 20,000×g for 45 minutes separated a lysate that was then loaded onto a Ni2+–NTA column (Qiagen). Buffer 1 with 20 mM and 500 mM imidazole were used to wash the column and elute the protein, respectively. Fractions containing CLOCK PAS–A were pooled and passed through a Superdex 75 column (GE Healthcare). Pure apo-CLOCK PAS–A was then concentrated and dialyzed in 50 mM Tris·HCl, pH 7.5, 50 mM, KCl (Buffer 2). To prepare holo-CLOCK PAS–A, a fresh solution of 500 μM hemin was added to apo-CLOCK PAS–A and incubated in the dark for 30 minutes at 4 °C. Alternatively, aqueous hemin was added to the cell lysate. Unbound hemin was removed by passing the mixture through a Superdex 75 column.
Hemin CLOCK PAS–A Titration
Spectrophotometric titrations for determining thermodynamic stability of the holoCLOCK PAS–A complex were carried out using a Carry 300 UV-visible spectrometer. A 2 μM solution of hemin was typically titrated with a 110 μM solution of apoCLOCK PAS–A. The ΔA spectrum for each titration point was obtained by digital subtraction of the reference hemin spectrum from the heme-protein spectrum. The stability constant was determined by global nonlinear least squares fitting of the data to a thermodynamic model in which apoCLOCK PAS–A binds a single heme chromophore in a single step.
The aqueous heme stock solution was prepared by dissolving 1.125 mg of hemin in 2 mL of 10 mM aqueous NaOH and then mixing for 10 minutes. The solution was clarified by centrifugation at 4000×g for 10 minutes, followed by filtration through a 0.45 μm membrane. Appropriate dilutions were made with Buffer 2. The heme concentration was calculated based on the measured absorbance at 385 nm (∊ = 5.84×10⁴ M−1·cm−1) and 406 nm (∊ = 2.42×10⁵ M−1·cm−1).
Resonance Raman spectroscopy
Resonance Raman (rR) spectra were obtained with 413.1 nm excitation from a Kr+ laser via backscattering from 20 to 90 μM CLOCK PAS–A samples. The spectrometer was calibrated with toluene, DMF, acetone, dimethylsulfoxide, and methylene bromide as frequency standards. Data was collected at ambient temperature from samples in spinning 5 mm NMR tubes. Laser power at the sample was between 6 and 16 mW with 413.1 nm excitation; at these powers no spectral artifacts due to photoinduced chemistry, including photolysis of the PAS–A–CO complex, were observed. UV-visible spectra were obtained before and after rR experiments to insure that the samples were not irreversibly altered in the laser beam.
Preparation of Ferrous CLOCK PAS–A and CLOCK PAS–A–CO
Ferrous CLOCK PAS–A was generated anaerobically at 20 °C by treatment of ferric CLOCK PAS–A with an excess of buffered stock sodium dithionite solution. The corresponding CO adducts were prepared by flushing the ferrous proteins with CO or a mixture of CO and N2 gas in which the ratio of gases was controlled by two flowmeters. The CO pressure above the protein solution was determined by Henry’s law. The solubility of CO in the protein solution was taken to be the same as that in the water. The concentration of CO in solution was calculated from the partial pressure of CO corrected for water vapor (1 atm CO = 1.58 mM CO in solution at 0 °C). Protein samples were in 100 mM Tris/HCl buffer, pH 7.5, and 50 mM NaCl.
Measurement of CO Recombination Kinetics
All rate measurements were carried out under pseudo-first order conditions with CO in large excess. Protein concentrations were between 2 and 6 μM. The CO ligand was photodissociated with a 5 ns laser flash at 532 nm from a Q-switched Nd:YAG laser. The sample was probed with a Xe flash lamp to obtain the absorbance difference spectra. Decay in ΔA spectra with increasing delay between laser photolysis and probe pulses was monitored with a gated CCD camera. The observed rate constants, kobs1 and kobs2, were obtained by global nonlinear least squares fitting of the ΔA spectra to a two-term exponential function. Data processing was carried out using a commercial global analysis software package.
The reaction of six-coordinate CLOCK PAS–A with exogenous CO is given in Scheme 1. The rate constants kL and k−L are for the formation and dissociation of the 6c heme with endogenous protein ligands. The rate constant for formation of the PAS–A–CO is k’CO.
Scheme 1.

Top: Illustration of the biphasic relaxation model used to determine kobs1 and kobs2 by global nonlinear least squares analysis. Bottom: Elementary reaction steps involved in the rebinding of CO after photolysis by a 5 ns laser flash. Middle: Expressions relating the observed and elementary rate constants.33
Time courses were obtained at multiple CO concentrations, fitted to exponential expressions, and analyzed in terms of the CO dependences of the fast and slow phase rates, as described by Hargrove for six-coordinate plant Hb–CO systems. (Sum (kobs1+kobs2) of exponential terms from two exponential fit versus [CO] has a slope equal to k’CO and an intercept equal to(kL+k−L). The product (kobs1×kobs2) versus [CO] has a slope equal to k−H k’CO.33
Modeling of CLOCK PAS–A
Homology modeling was applied to predict the structure of CLOCK PAS–A (residues 103-265). The CLOCK PAS–A model was generated with MODELLER 9.6,34 which aligns the amino acid sequence of the target (CLOCK) with a known 3D structure (dPER). From this alignment, the distances and dihedral angles restrains are extracted and a spatial model is created. The optimized 3D model is then obtained using molecular dynamics with simulated annealing. The choice of the 3D structure of dPer PAS–AB (PDB accession code 1WA9) as the template was based on the sequence homology of CLOCK with other PAS domains. Only the PAS–A domain of the template protein was used to generate the homology model of CLOCK PAS–A.
Results
Heme binding to CLOCK PAS–A
The affinity of CLOCK PAS–A for ferric heme was determined by spectrophotometric titration of aqueous heme with apo-CLOCK PAS–A. The experimental difference spectra for each titration point are shown in Figure 1. These data were analyzed using global nonlinear least squares fitting to a single step binding model. The experimental and calculated titration curves based on ΔA at 276 (tryptophan band), 415 (heme Soret (S0←S2) band), and 536 nm (heme Q(0,1) (S0←S1) band) are shown in inset A. The quality of these fits is consistent with formation of a 1:1 heme:CLOCK PAS–A complex having dissociation constant, Kd=1.05±0.33×10⁻⁶ M. Inset B shows the calculated speciation of the heme and protein. The stability of holoCLOCK PAS–A is consistent with heme being a natural cofactor of CLOCK PAS–A. Interestingly, holoCLOCK PAS–A is only slightly more stable than the heme:REV–ERBα and heme:REV–ERBβ.35
Figure 1.

Determination of heme:CLOCK PAS–A stoichiometry by spectrophotometric titration. The main panel shows ΔA spectra for each addition of apoCLOCK PAS–A to a solution of FeIIIPPIX. A buffered FeIIIPPIX solution of the same concentration was used as the reference sample. The ΔA spectra were obtained by digital subtraction of the reference spectrum from that of the titrated sample. Inset A shows a small subset of the titration curves at the indicated wavelengths. The open symbols represent experimental ΔAs plotted as a function of total CLOCK PAS–A concentration. The solid lines were calculated using the results of the global nonlinear least squares fit to a single step binding reaction to yield a 1:1 complex. Inset B shows the calculated speciation plot wherein concentrations of free FePPIX, heme:CLOCK PAS–A and apoCLOCK PAS–A are plotted as a function of total CLOCK PAS–A added during the titration.
Ferric CLOCK PAS–A
The UV-visible spectrum of ferric CLOCK PAS–A has its Soret maximum at 412 nm and α/β bands at 535 and 565 nm (Figure 2, Table 1). This spectrum is quite similar to those observed for six-coordinate bis-His heme proteins like hemopexin36 and cytochrome b5 37 (413, 532, and 561 nm) and differs from those typically observed for ferric hemes ligated by a Cys and a second ligand (N or O) (425, 542, and 574 nm).38 CLOCK PAS–A has been examined by UV-visible absorbance from pH 5.2 to 10.0. (Data not shown.) The Soret and α/β band maxima are unaltered over this pH range, consistent with the axial ligand field being independent of pH.
Figure 2.

UV-visible spectra of ferric (blue), ferrous (red), and ferrous nitrosyl (green) forms of CLOCK PAS–A.
Table 1.
Absorbance and vibrational data for select ferric and ferrous heme-binding PAS sensor domains
| UV-vis absorbance max. (nm) | heme Raman frequencies (cm−1) | ||||||||
|---|---|---|---|---|---|---|---|---|---|
| Fe(III) | axial ligands | CN,a spin state | Soret | β | α | ν 4 | ν 3 | ν 2 | Ref. |
| CLOCK PAS–A | 6cLS | 413 | 535 | 565 | 1373 | 1502 | 1583 | this work | |
| NPAS2 PAS–A | His/Cys | 6cHS/5cHS/ 6cLS |
412 | 538 | 1373 | 1474/1490/ 1504 |
10,43 | ||
| NPAS2 PAS–B | His/? | 6cHS/6cLS | 419 | 536 | 1373 | 1468/1502 | 1550/1581 | 64 | |
| NPAS2 bHLH–PAS–A | 5cHS/6cLS | 421 | 543 | 1374 | 1492/1504 | 1552/1579 | 43 | ||
| mPER2 PAS–A | ?/Cys | 5cHS/6cLS | 421 | 536 | 1372 | 1470/1501 | 1553/1585 | 42 | |
| BxRcoM–2 | His/Cys | 6cLS | 423 | 541 | 565 | 1371 | 1500 | 1579 | 24 |
| EcDos PAS | His/H2O | 6cLS | 416 | 530 | 564 | 1370 | 1501 | 1576 | 73-75 |
| SmFixLN | His | 5cHS | 395 | 514 | 1370 | 1493 | 1562 | 44,76,77 | |
| Fe(II) | |||||||||
| CLOCK PAS–A | His/? | 5cHS/6cLS | 423 | 527 | 559 | 1358 | 1470/1491 | 1556/1584 | this work |
| NPAS2 PAS–A | His/His | 5cHS/6cLS | 423 | 530 | 558 | 1360 | 1471/1493 | 1557/1584 | 10,43 |
| NPAS2 PAS–B | 5cHS/6cLS | 424 | 529 | 557 | 1359 | 1470/1492 | 64 | ||
| NPAS2 bHLH–PAS–A | 5cHS/6cLS | 426 | 530 | 559 | 1359 | 1471/1493 | 1555/1582 | 43 | |
| mPER2 PAS–A | 5cHS/6cLS | 425 | 529 | 558 | 1358 | 1468/1491 | 1554/1586 | 42 | |
| BxRcoM–2 | 6cLS | 425 | 532 | 562 | 1359 | 1490 | 1580 | 24 | |
| EcDos PAS | His/Met | 6cLS | 427 | 532 | 563 | 1353 | 1493 | 1580 | 73-75 |
| SmFixLN | His | 5cHS | 434 | 558.5 | 1354 | 1470 | 1557 | 51,78 | |
CN, coordination number.
The oxidation state and coordination number of ferric CLOCK PAS–A are confirmed by the high frequency window of the rR spectra shown in Figure 3. The oxidation state marker band (ν4) is observed at 1373 cm−1 which is typical for Fe(III) hemes. For Fe(III) hemes, the ν3 band, often referred to as the heme spin-state marker, falls in characteristic frequency ranges for ferric hemes having the following permutations of spin state and coordination number: 1475-1485 cm−1 for 6c HS, 1490-1500 cm−1 for 5c HS, and 1500-1510 cm−1 for 6c LS hemes. For CLOCK PAS-A at pH 7.8, the ν3 band is observed at 1502 cm−1 consistent with a 6c LS heme. The ν2 band is also sensitive to spin state and coordination number. In CLOCK PAS–A, it is tentatively assigned at 1583 cm−1 which is also consistent with a 6c LS heme (ν2 frequency ranges: 1570-1575 cm−1 for 5c HS, 1560-1565 cm−1 for 6c HS, and 1580-1590 cm−1 for 6c LS hemes). The high frequency rR spectrum of CLOCK PAS–A differs from that reported for NPAS2 PAS–A in that all of CLOCK PAS–A is in a 6c LS form; for NPAS2 PAS–A, three bands were observed in the ν3 region of the spectrum indicating that there are multiple spin states and coordination numbers for the ferric NPAS2 PAS–A. The concentration of 5c HS NPAS2 PAS–A decreases as the pH is lowered from pH 8.0 to 7.0.10 In contrast, high frequency rR spectra of CLOCK PAS–A show that it is 6c LS from pH 5.2 to 10 (Figure S1). Comparison of coordination number and spin state of ferric CLOCK PAS–A with other PAS domain proteins are summarized in Table 1.
Figure 3.

Soret-excited resonance Raman spectra of ferric (blue) and ferrous (red) CLOCK PAS–A. Both samples contained 50 μM protein in 50 mM potassium phosphate, pH 7.8, 50 mM NaCl. Spectra were excited with 413.1 nm emission from a Kr+ laser.
The vibrational signature of this 6c LS protein in the low frequency window of the rR spectrum is shown in Figure 3. The bending modes observed for the peripheral heme propionate, (δ(CβCcCd), and vinyl, (δ(CβCaCb), groups in CLOCK PAS–A have been assigned at 378 and 417 cm−1 by comparison with rR spectra for other 6c LS heme proteins.39,40 The frequencies of heme propionate bending modes are sensitive to their hydrogen-bonding environment.41 The fact that they occur at the same frequency in ferric CLOCK PAS–A and ferric NPAS2 PAS–A10 suggest that the peripheral heme substitutents in both PAS–A domains could be in similar hydrogen bonding environments and, as a consequence, have similar conformations.
Ferrous CLOCK PAS–A
Spectroscopic data for ferrous CLOCK PAS–A generated by reduction with a ten-fold molar excess of sodium dithionite are shown in Figures 2 and 3 and summarized in Table 1. In the high-frequency rR spectrum of the ferrous CLOCK PAS–A, the ν4 band is observed at 1358 cm−1, confirming that the protein has been reduced. While its 423-nm Soret maximum is closer in wavelength to those observed for 6c LS ferrous hemes than for 5c HS ferrous hemes, both forms are observed in the rR spectrum. This mixture of states hinders straightforward interpretation of the visible spectrum as a fingerprint for axial heme ligation. The ν3 bands observed at 1470 and 1491 cm−1 have been assigned to 5c HS Fe(II) and 6c LS Fe(II), respectively. Hence, reduced CLOCK PAS–A exists as an equilibrium mixture of two coordination states. Based on rR data, the ferrous forms of CLOCK PAS–A, NPAS2 PAS–A10 and mPER242 are all mixtures of 5c HS and 6c LS hemes. Resonance Raman data reported for BxRocM–2 indicate that it is 6cLS in the ferrous state; however, these spectra were recorded at 77 K24, a temperature at which the 6cLS heme would be favored over the 5c HS form.
The low frequency region of the ferrous CLOCK–PAS–A rR spectrum was examined in two ways in attempts to observe a νFe–His band between 200 and 250 cm−1. First, the rR spectrum of pure CLOCK–PAS–A was excited with 413.1- and 441.6-nm light under equilibrium conditions. While the 413.1-nm spectrum exhibited a very small band near 200 cm−1, no bands could be observed in the 441.6-nm spectrum. If the 200 cm−1 band in the 413.1-nm spectrum was the νFe–His band, its relative intensity would be expected to increase dramatically in the 441.6-nm spectrum because scattering by the Fe–His stretching mode is known to be well enhanced in 5cHS ferrous heme proteins with this excitation wavelength. However, as the fluorescence background was high in the 441.6-nm spectrum, it is not clear from these experiments whether there is no Fe–His bond in the 5cHS fraction of ferrous CLOCK–PAS–A or whether it was simply unobservable due to the high fluorescence background. Alternatively, it is possible that under violet irradiation one of the axial ligands is photodissociated. In this situation, the high frequency, in-plane modes for the resulting pentacoordinate ferrous CLOCK PAS–A would be apparent, but the νFe–His band would be much less so due to its poor enhancement with violet excitation. If the photolysis efficiency tracks the Soret cross section, then the pentacoordinate photoproduct would not even be formed with blue irradiation.
This study has shown that the heme in CLOCK–PAS–A–CO most likely has a His ligand trans to the CO (vide infra). Thus, we attempted to observe a νFe–His band by recording the Soret-excited rR spectrum of CLOCK–PAS–A–CO under steady state CO photolysis conditions as a function of continuous laser power. No power-dependent bands attributable to a νFe–His mode could be identified. As will be discussed below, however, the 5cHS heme produced by photolysis is rapidly trapped by an endogenous ligand to form a 6cLS heme, whose νFe–His modes are poorly enhanced. Therefore, even though the Fe–His bond is almost certainly present in CLOCK–PAS–A–CO, it did not build up to a steady state concentration that was observable by rR spectroscopy. So, due most likely to the intrinsic axial ligand dynamics of the protein, a νFe–His could not be assigned.
Ferrous CLOCK PAS–A–CO
After reduction of CLOCK PAS–A with dithionite, the formation of a CO complex upon the addition of natural abundance CO or 13CO was confirmed by its UV-visible spectrum. The CO complex was stable over the course of the spectroscopic experiments, as judged by the lack of change in its UV-visible spectrum. Figure 4 shows the high-frequency region of the CLOCK PAS–A–CO rR spectrum. The Fe(II)–CO spectrum was examined with 6 and 16 mW power at the sample; photolysis product(s) did not accumulate to detectable levels in either case, as judged by the unchanging shape and relative intensity of the ν4 band at 1371 cm−1, which is typical for ferrous hemes coordinated to the strongly π-backbonding ligands CO and NO. However, at an incident laser power of 30 mW, CO photolysis was apparent by a low-frequency shoulder near 1360 cm−1 on the ν4 band. This frequency is typical of HS and LS ferrous hemes that do not have π-backbonding ligands bound. As previously mentioned, despite the laser power-dependent evidence for CO photolysis, no bands attributable to a νFe–His mode were observed.
Figure 4.

High frequency rR spectrum of CLOCK PAS–A–CO obtained with Soret excitation. Protein concentration of 8 μM, 413.1 nm excitation wavelength, 6 mW laser power at sample. Inset: UV-visible absorbance spectrum of CLOCK PAS–A–CO.
Low-frequency spectra of CLOCK PAS–A–CO are shown in Figure 5A. Based on their isotope sensitivities, the bands at 498 and 576 cm−1 are assigned to the Fe–C stretching mode, νFe–CO, and the FeCO bending mode, δFeCO, respectively. The νFe–CO band shifts 5 cm−1 to 493 cm−1 in the 13CO complex. A 21-cm−1 shift is observed for the FeCO bending mode which is at 555 cm−1 in the 13CO complex. The C–O stretching vibration is revealed in Figure 5B by its shift from 1960 cm−1 in the spectrum of natural abundance CLOCK PAS–A–CO to 1916 cm−1 in its 13CO complex.
Figure 5.

Resonance Raman spectra of CLOCK PAS–A–CO and its 13CO isotopologue. A) Low frequency window. B) High frequency window. Protein was in 50 mM potassium phosphate buffer, pH 7.8, 50 mM NaCl. Spectra were recorded at room temperature with 413.1 nm excitation.
The inverse correlation between νFe–CO and νC–O frequencies for heme proteins and model complexes is useful in assessing the electrostatic landscape of the distal heme environment. Figure 6 illustrates this correlation for a number of heme–CO complexes. The height of a correlation line on the νFe–CO axis is biased by the σ donor strength of the trans (proximal) ligand. Anionic proximal ligands like imidazolate and thiolate lower the π backbonding correlation line on the νFe–CO axis due to weakened Fe–CO σ bonding. For CLOCK PAS–A, the CO complex falls on the imidazole backbonding line, consistent with a neutral, proximal imidazole ligand. The position of a point on a given correlation line reflects the degree of π backbonding in the FeCO moiety, which is governed by both Fe–C–O geometry and the distal electrostatic field. An off-axis FeCO geometry precludes favorable overlap of the CO-based π* and d-π orbitals. In this situation π backbonding is weakened relative to a linear FeCO moiety and, absent other factors such as hydrogen bonding, is characterized by positions to the right (low) on the correlation line. Interaction of the CO ligand with positively charged or hydrogen-bond donating residues on the distal side of the heme are known to enhance π back bonding. Distal H-bond interactions are characterized by points high on the correlation line. Offsetting contributions from H-bonding and off-axis FeCO distortions tend to place the heme-CO points between these extremes of the plot in Figure 6. It has been suggested that points falling above νFe–CO > 520 cm−1 and νC–O < 1935 cm−1 have distal H-bonds. Since the data for CLOCK PAS–A–CO falls well below these frequencies on the correlation line, it suggests that it most likely contains a non-hydrogen bonded FeCO unit. The νFe–CO and νC–O frequencies for CLOCK PAS–A–CO, NPAS2–CO,10,43 and SmFixLH–CO44,45 place them in the region of the νFe–CO/νC–O correlation line that is indicative of a CO ligand that is in a neutral, nonpolar environment.46 These data are summarized in Table 2.
Figure 6.
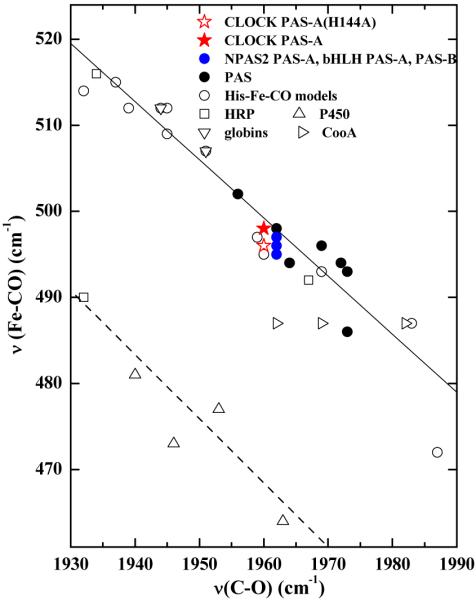
ν(Fe–CO)/ν(C–O) correlation plot for iron porphyrin carbonyl complexes.47 CLOCK PAS–A,  ; globins, ▽; cytochrome P450s, △; Horseradish peroxidases, ○; CooA, □; PAS domain proteins, ● (listed in Table 2); NPAS2, Pas A and Pas B domains,
 . The dashed line correlates ν(Fe–CO) with ν(C–O) for 6c FeCO complexes in which the sixth ligand is thiolate or imidazolate; the solid line represents FeCO adducts with histidine having a neutral imidazole side chain as the sixth ligand. References for the PAS domains are listed in Table 2.
Table 2.
Absorbance and vibrational data for ferrous heme-containing PAS domains of selected heme sensor proteinsa
| visible absorbance maxima (nm) | heme Raman frequencies (cm−1) | |||||||||
|---|---|---|---|---|---|---|---|---|---|---|
| Fe(II)–CO Protein | Soret | β | α | ν 4 | ν 3 | ν 2 | ν(Fe–C) | ν(C–O) | δ(FeCO) | Ref. |
| CLOCK PAS–A | 420 | 540 | 570 | 1371 | 1497 | 1583 | 498 | 1960 | 576 | this work |
| NPAS2 PAS–A | 420 | 530 | 568 | 1372 | 1468 1497 |
1556 1583 |
496 | 1962 | 572 | 10,43 |
| NPAS2 PAS-B | 420 | 536 | 571 | 1372 | 1467 1498 |
1558 1583 |
497 | 1962 | 577 | 64 |
| NPAS2 bHLH–PAS–A | 422 | 538 | 566 | NR | NR | NR | 495 | 1962 | nr | 43 |
| mPER2 PAS–A | 420 | 539 | 565 | 1370 | 1465 1497 |
1554 1586 |
494 | 1964 | 575 | 42 |
| BxRcoM-2 | 423 | 540 | 570 | 1368 | 1494 | 1575 | 485 | 1965 | 565 | 24 |
| EcDos PAS | 423 | 540 | 570 | 1370 | 1496 | 1581 | 486 487 |
1973 1969 |
nr 575 |
73,74 75 |
| SmFixLN | 425 | 545 | 576 | 1370.5 | 1494 | 1577 | 502 | 1956 | 572 | 44,45,76 |
NR, not reported.
The kinetic parameters of CO association with ferrous CLOCK PAS–A were investigated by flash photolysis of CLOCK PAS–A–CO followed by tracking the CO recombination by transient absorbance (TA) spectroscopy. A typical set of transient ΔA spectra is shown in Figure 7A. This series of spectra exhibits two sets of isosbestic points, one set on the ΔA=0 line and one above that line at 400 nm. This behavior is consistent with the rebinding reaction proceeding via multiple steps. In support of this notion, the ΔA time course following CO photolysis is biphasic. The respective observed rate constants, kobs1 and kobs2, are both CO-dependent with the second phase having a considerably steeper dependence than the first (Figure S2). Figure 7B shows the plots from which rate constants for the elementary reaction steps in Scheme 1 were determined. The data were analyzed by global nonlinear least squares fitting. Figure 7C shows the calculated speciation of three heme species, the prompt photoproduct (black squares), an intermediate (red circles), and the equilibrium CO complex (blue triangles).
Figure 7.

CO recombination following flash photolysis using a 5 ns, 532 nm laser pulse from a Q-switched Nd:YAG laser. A) Transient ΔA spectra recorded between 6 μs to 300 ms following photolysis of CLOCK PAS–A–CO. The spectra were accurately modeled with a two-phase recombination of CO with CLOCK PAS–A at 22 °C. Spectra were referenced against the spectrum of CLOCK PAS–A–CO. For the data shown in this figure, [CLOCK PAS–A–CO]=2.5 μM and [CO]=890 μM. B) CO dependence of kobs1+kobs2 and kobs1·kobs2 used to determine rate constants for the elementary CO recombination steps.33 C) Calculated speciation plot showing the time evolution of ■, prompt photoproduct;  , intermediate;
  , CO complex. Inset: Concentrations are plotted on an expanded time axis from 0 to 6 ms in order to more clearly show the appearance of the 6c intermediate at the expense of the pentacoordinate photoproduct.
The global nonlinear least squares analysis further yields component ΔA spectra. These are the spectra of the kinetic intermediates, the number of which is defined by the fitting model. These ΔA spectra along with their dissection by peak fitting analysis are shown as insets in Figure 8. In carrying out that analysis, the negative features were fixed to the absorbance bands of the equilibrium CLOCK PAS–A–CO spectrum while the frequencies, band widths and areas of the positive difference features were allowed to vary. The best-fit positive bands constitute the visible spectra of the aforementioned intermediates in the recombination reaction. The 5c HS ferrous (prompt) photoproduct and the 6c LS intermediate formed by intramolecular ligand association are shown in the main panels of Figures 8A and 8B, respectively. The bands calculated from the component ΔA spectrum of the prompt photoproduct show its Soret maximum at 431 nm and a broad Q band centered at 548 nm, consistent with its assignment as a 5cHS ferrous heme. This first, coordinatively unsaturated intermediate gives way to a second intermediate with a Soret maximum at 423 nm and α/β bands at 534 and 557 nm, consistent with a 6cLS heme complex. Thus, in summary, photolysis generates a pentacoordinate ferrous heme whose open coordination site is trapped by a sixth ligand to yield a hexacoordinate, low spin complex. Finally, in a reaction that is rate limited by dissociation of the axial ligand, the CO rebinds to regenerate the thermodynamic CLOCK PAS–A–CO complex. This course of events, along with the global analysis model is illustrated in Scheme 1. The magnitude of ΔA at the earliest times accessible by the spectrometer after the photolysis flash indicated a second order recombination yield of only ~20%. The fast recombination of the geminate heme:CO pair responsible for the 20% yield, in conjunction with the efficient trapping of the 5cHS ferrous CLOCK PAS–A photoproduct, is consistent with the lack of a νFe–His band in the rR spectrum of CLOCK PAS–A–CO, even under strong laser irradiation.
Figure 8.

Visible spectra of the intermediates observed in the CO photolysis experiment. A) Calculated visible spectrum of the prompt photoproduct. B) Calculated spectrum of the intermediate that results when a second endogenous ligand binds to the heme. These visible spectra were determined by peak fitting the features of the ΔA component spectra, as shown in the respective insets. ΔA component spectra were obtained from the two-phase global fit of the ΔA spectra in Figure 7A. Original data, red; global fit, black; positive individual Gaussian bands attributable to the intermediates, black; and negative Gaussian bands due to starting CO complex, blue. The peak parameters of width, relative intensity and frequency for the negative features that arise due to disappearance of the CO complex were held constant at their experimentally determined values during the peak fitting. The parameters for the unknown bands of the intermediates were allowed to vary.
Analysis of the kinetic data using the approach presented by Hargrove33 yielded the composite CO association rate constant k’CO of 3.1×10⁶ M−1·s−1 for CLOCK PAS–A. The rate constants for the association and dissociation of the trapping endogenous ligand, kL and k−L were determined in the same analysis to be 4.3×10³ s−1 and 3.3×10² s−1, respectively (see Figure 7B). Table 5 lists rate constants for other hexacoordinate systems for comparison. The values of k−L and kL constitute a dissociation constant of 7.6×10⁻². Taking this value as an indicator of the approximate 6cLS:5cHS population ratio (~13) for equilibrium ferrous CLOCK PAS–A, the strong similarity between the UV-visible spectrum of equilibrium ferrous CLOCK PAS–A in Figure 2 and that typical of 6cLS ferrous hemes is as expected. In other words, the spectrum looks like that of ferrous 6cLS heme because the fraction of the protein in that state is >90%. Since we do not know the relative rR scattering cross sections of the marker bands for the 5cHS and 6cLS states, it is not absolutely clear whether the rR data are consistent with this equilibrium ratio. As suggested earlier, the substantial intensity of the 5cHS ν3 in the top trace of Figure 3 may be attributable to photolysis of an endogenous ligand. Nevertheless, our lack of success in observing a νFe–His band is certainly consistent with only a small fraction (~8%) of the heme being present as 5cHS ferrous CLOCK PAS–A.
Table 5.
Rate constants for CO and endogenous ligand binding to CLOCK PAS–A and six-coordinate Hbs
| Protein | 10−6×k’CO(M−1·s−1) | kL (s−1) | k−L (s−1) | kd (kL/k−L) | k’CO · Kd | reference |
|---|---|---|---|---|---|---|
| CLOCK PAS-A | 3.1 | 4368 | 331 | 7.6×10⁻² | 2.4×10⁵ | this work |
| CooA | 32 | 4000 | 0.2 | 5×10⁻⁵ | 1.6×10³ | 82 |
| Synechocystis Hb | 90 | 4200 | 14 | 3.3×10⁻³ | 3×10⁵ | 83 |
| Ngb | 40 | ≥2000 | 2.3(70%) 0.2(30%) |
~10−3 ~10−4 |
~4×10⁻⁴ ~4×10³ |
83 |
| Cgb | 5.6 | 430 | 0.5(70%) 9×10⁻²(30%) |
1×10⁻³ 2×10⁻⁴ |
6×10³ 1×10³ |
83 |
| barley Hb | 2.0 | 170 | 62 | 0.36 | 7.2×10⁵ | 84 |
| Histoglobin | 5.6 | 430 | 5 | 1×10⁻² | 5.6×10⁴ | 85 |
| rice Hb1 | 6.0 | 517 | 1911 | 3.70 | 2.2×10⁷ | 33 |
| rice Hb1 | 6.8 | 75 | 40 | 0.5 | 3.4×10⁶ | 83 |
| rice Hb2 | 1.8 | 6.7 | 15 | 2.2 | 4.0×10⁶ | 83 |
| Maize Hb1 | 1.4 | 22 | 25 | 1.1 | 1.5×10⁶ | 83 |
| Maize Hb2 | 44 | 43 | 19 | 0.44 | 1.9×10⁷ | 83 |
CLOCK PAS–A reacts with NO
Both ferric and ferrous CLOCK PAS–A react with NO to yield the same ferrous {FeNO}7 CLOCK PAS–A–NO product. This is substantiated by UV-visible and rR spectra of the product of these two reactions. The UV-visible spectra obtained for the product of both reactions are identical and shown in Figure 2. The broad Soret has a maximum at 396 nm and is consistent with those reported for 5c ferrous heme–NO complexes.43,48-51 Isotopomers of NO were reacted with both ferric and ferrous CLOCK PAS–A. The Fe–NO stretching frequencies of {FeNO}7 hemes occur between 510 and 590 cm−1 and are sensitive to the coordination number of the heme. The 5c heme nitrosyls fall between 510 and 530−1 (see references in Figure 11 caption) while the 6c complexes lie between 560 and 590 cm−1. Figures 9A and 9B show the low frequency rR spectra for both reactions. The 14NO complex has an isotopically-sensitive band at 525 cm−1 which shifts to 513 cm−1 in the corresponding 15NO complex. This band is typical of the νFe–NO mode of a 5c {FeNO}7 heme complex.51,52
Figure 11.
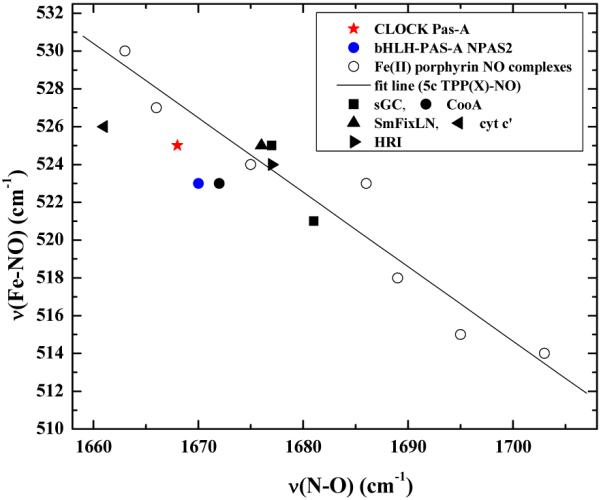
Plot showing the inverse correlation between the frequencies of ν(Fe–NO) and ν(N–O) for pentacoordinate {FeNO}7 porphyrinates.60 CLOCK PAS–A–NO and NPAS2 bHLH–PAS–A–NO are indicated by a red star and blue circle, respectively. References for protein complexes are listed in Table 3.
Figure 9.

Low frequency rR spectra for 14N and 15N isotopomers of CLOCK PAS–A–NO. A) Ferrous CLOCK PAS–A + NO. B) Ferric CLOCK PAS–A + NO. Protein was in 100 mM sodium phosphate, pH 7.1, 100 mM NaCl. Spectra were obtained with 406.7 nm excitation (14 mW at the sample). Red spectra represent the products of the reaction with 14NO; green spectra represent the 15NO counterparts; the blue traces are the difference spectra generated by digital subtraction of the 15NO spectra from the respective 14NO spectra. The broad band at ~440 cm−1 is due to Raman scattering by the glass NMR tube, in which the samples were contained. To avoid the introduction of artifacts into the difference spectra from baseline corrections, no effort was spent to remove this band from the spectra.
The corresponding high-frequency rR spectra for the product of ferric CLOCK PAS–A and NO are shown in Figure 10A. The analogous spectra for the reaction of ferrous CLOCK PAS–A with the isotopomers of NO are identical to those illustrated in Figure 9. The difference feature revealed upon subtraction of the 15NO spectrum from the 14NO spectrum indicates that CLOCK PAS–A–NO has a νN–O band at 1667 cm−1. The estimated isotopic shift for the 15NO stretching band is approximately 30 cm−1. This is consistent with the shift from 1667 to 1636 cm−1 in CLOCK PAS–A–15NO. Comparison of the νFe–NO and νN–O in the rR spectra for the reaction of ferric and ferrous CLOCK PAS–A with NO with heme–NO complexes listed in Table 3 and shown in the correlation plot in Figure 11 confirm that the CLOCK PAS–A NO product is a 5c {FeNO}7 complex.
Figure 10.

Reaction of ferric CLOCK PAS–A with NO yields ferrous CLOCK PAS–A–NO as judged by rR and absorption spectroscopy. A) High-frequency, Soret-excited rR spectra of the isotopologues of CLOCK PAS–A–NO generated by the reaction of ferric CLOCK PAS–A with NO. Spectra were obtained with 406.7 nm excitation and 14 mW power at the sample. The black spectrum was recorded from ferric CLOCK PAS–A; the red spectrum from CLOCK PAS–A–14NO; the green spectrum from the CLOCK PAS–A–15NO isotopologue; and the blue line is the difference spectrum generated by digital subtraction of the CLOCK PAS–A–15NO spectrum from the CLOCK PAS–A–14NO spectrum. The spectra of products produced from reaction of NO with ferrous CLOCK PAS–A are identical. B) Absorption spectra tracking the reaction of ferric CLOCK PAS–A with NO. Spectra were monitored at 30 second intervals. The protein solution was 100 mM in sodium phosphate and in NaCl, pH 7.1. The reaction is characterized by clean isosbestic behavior at four points in the spectra, 400, 460, 517 and 563 nm.
Table 3.
Absorbance and vibrational data for ferrous CLOCK PAS–A–NO and selected heme protein nitrosyl complexesa
| visible absorbance maxima (nm) | heme Raman frequencies (cm−1) | |||||||||
|---|---|---|---|---|---|---|---|---|---|---|
| Fe(II)–NO Protein | Soret | β | α | ν 4 | ν 3 | ν 2 | ν(Fe–N) | ν (N–O) | CNb | Ref. |
| CLOCK PAS-A | 396 | 541 | 577 | 1374 | 1508 | 1588 | 525 | 1668 | 5 | this work |
| NPAS2 bHLH–PAS–A | 394 | NR | NR | 1376 | 1508 | 1584 | 523 | 1670 | 5 | 43 |
| CooA | 399 | 544 | 572 | 1376 | 1506 | 1582 | 523 | 1672 | 5 | 48 |
| sGC | 398 | 537 | 572 | 1376 1375 |
1508 1509 |
1585 1584 |
521 525 |
1681 1677 |
5 5 |
49,50,52,79 |
| Cytochrome c’ | 397 | 541 | 565 | 1373 | 1506 | 1592 | 526 | 1661 | 5 | 80 |
| HRI | 398 | 538 | NR | NR | NR | 524 | 1677 | 5 | 81 | |
| SmFixLN | 404 420 |
553 546 |
583 578 |
1373 1373 |
1507 1498 |
525 558 |
1676 1676 |
5 6 |
51,57 | |
| BxRcoM-2 | 422 | 544 | 577 | 1371 | 1496 | 1575 | 565 | 1631 | 6 | 24 |
| EcDos PAS | 419 | 537 | 563 | NR | NR | NR | 563 | 1632 1576 |
6 | 75 |
NR, not reported.
CN, coordination number.
The ferrous heme nitrosyl complex produced in the reaction of ferric CLOCK PAS–A with NO indicates that CLOCK PAS–A undergoes reductive nitrosylation.53 This reaction has been reported for other ferric 6c LS heme proteins like cytochrome c, human neuroglobin, and hemopexin. It is also known for O2-binding proteins like myoglobin (Mb), hemoglobin (Hb), and SmFixL.54-59 These ferric heme protein nitrosyls undergo nucleophilic attack by OH− or H2O, followed by reductive elimination of HNO2. The resulting, coordinatively unsaturated ferrous hemes then react with excess NO to yield their respective {FeNO}7 complexes. This mechanism is illustrated in Figure S3.
Homology structure of CLOCK PAS-A
Amino acid sequence alignment of CLOCK PAS–A with other heme binding PAS domains are shown in Figure 12. Sequence identity of 65% has been reported between mCLOCK PAS-A and mNPAS2 PAS–A.19 Although sequence similarity between CLOCK PAS–A, NPAS2 PAS–A, and PER PAS–A from various sources has been pointed out previously,19 here it is used to identify possible heme binding site(s) in CLOCK PAS–A. Hemes are commonly bound to proteins through coordinate covalent bonds between atoms of amino acid side chains and the iron atom. The most common side chain ligands are the imidazole, thiolate, thioether, and phenolate side chains of histidine, cysteine, methionine, and tyrosine. Of the three cysteine residues found in the CLOCK PAS–A domain, two of them (Cys195 and Cys250, CLOCK PAS–A numbering) are conserved in the CLOCK PAS–A, NPAS2 and PER proteins. CLOCK PAS–A has six histidine residues. Although none of these histidines are conserved in the PER proteins, four of them (His144, His196, His173, and His163, CLOCK PAS–A numbering) are conserved in NPAS2. The sequence positions of the other two histidine residues in CLOCK PAS–A (His230 and His241) are occupied by cysteine residues in NPAS2. Three of the six tyrosines in CLOCK PAS-A (Tyr133, Tyr167, and Tyr210) are conserved in NPAS2 and PER. CLOCK PAS–A contains three methionine residues which are not highly conserved in the PAS domain proteins. Based on spectroscopic investigation of a series of NPAS2 PAS–A domain mutants it has been suggested that the heme is ligated by His119 and Cys170 residues in the ferric state.10 Upon heme reduction, a ligand switch to bis-His (His119/His171) heme ligation has been proposed for NPAS2 PAS–A.10 By analogy to the NPAS2 PAS–A domain, one would predict that CLOCK PAS–A has His144/Cys195 as ligands in the ferric form and His144/His196 as axial ligands for ferrous heme.
Figure 12.
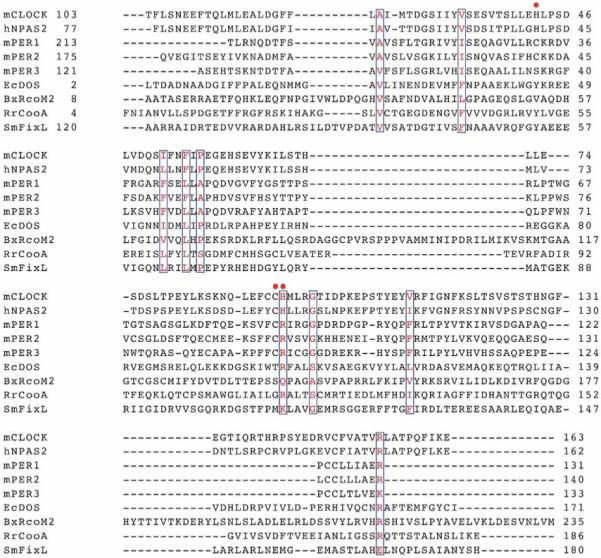
PAS–A domain amino acid sequence alignment of mCLOCK with the heme-binding PAS proteins hNPAS2, mPER 1-3, EcDOS, BxRcoM2, RrCooA, and SmFixL, (Swissprot codes: Mouse [m], O08785; human [h] Q99743; Mouse [m], O35973 [1], O054943 [2], O70361 [3]; [Ec], P76129; [Bx], Q131Y4; [Rr], P72322; and [Sm], P10955 respectively. Sequence alignment was generated by CLUSTALW.61 Conserved residues are blocked and colored in red. Residues proposed to participate in the heme coordination in mCLOCK based on comparison with hNPAS2 are labeled with a red dot. Proposed heme ligand for ferric mPER2 is Cys215.42 Heme ligation for ferric SmFixL and EcDos is His19445 and His7762, respectively. For BxRcoM–1, His70 is involved in heme coordination.
Sequence alignment of CLOCK PAS–A with PAS domain heme sensor proteins like EcDOS and SmFixL reveals lower sequence homology than that with NPAS2 and PER PAS domains. Thus, there is likely some variability in the exact combination of bonded and nonbonded interactions that accommodate heme in PAS domains. While sequence alignment suggests that a possible heme ligand set in ferric CLOCK PAS–A is a His/Cys pair analogous to that suggested for NPAS2, evidence suggests heme ligand sets comprising His/H2O, His, Cys/H2O, and His/Cys in the PAS domains of EcDOS, SmFixL, mPER2, and BxRcoM, respectively.24,42,62,63
To investigate the spatial location of the potential heme ligands, we derived a 3D structural model for CLOCK PAS–A. Based on sequence homology (vide supra) and spectroscopic evidence, we used the dPer PAS–A 3D structure (PDB) as template for this model. This homology model is shown in Figure 13 and suggests the presence of two potential axial ligand sets. One comprises His144 and the adjacent pair of redidues, Cys195 and His196. Since Cys195/His196 occur in a flexible loop and conformational changes can be associated with ligand binding, it could be that His144 occupies one axial ligand site with Cys195 and His196 occupying the other in the ferric and ferrous forms, respectively. The other set comprises His144 and the His163/Cys250 pair. Interestingly, and despite their wide separation in the primary sequence, the homology model shows the side chains of His163 and Cys250 to be spacially proximal, their β-carbon atoms being separated by only ~6 Å, because of their locations on adjacent, parallel α-helices. Heme coordination by a residue on the αD helix is a common feature for the bacterial heme-containing PAS domains, as it stabilizes the heme inside the “β-hand” cavity of the domain. Thus, the possibility of the His163/Cys250 pair of residues partnering with His144 to bind heme in CLOCK PAS–A is also reasonable.
Figure 13.
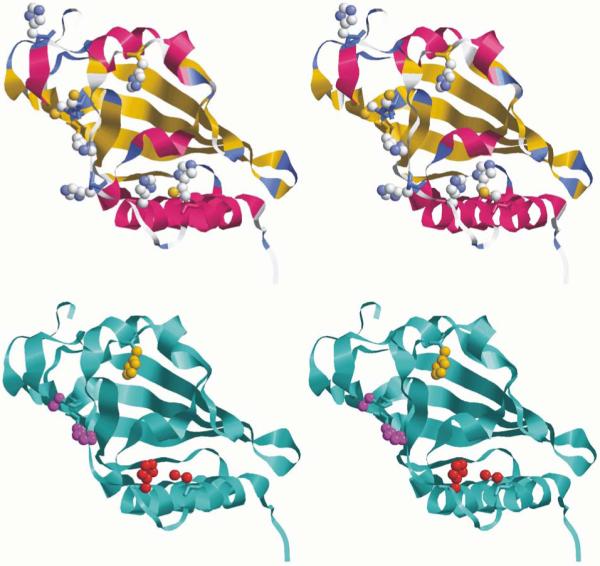
Cross-eyed stereo cartoon representations of the CLOCK PAS–A structural model based on dPer crystal structure (PDB 1WA9). Top: Homology model with all His and Cys sidechains shown in bold, CPK. Bottom: Same CLOCK PAS–A model structure with the side chains of His144 (amber), His196/Cys195 (magenta) and His163/Cys250 (red) shown in bold. With some conformational rearrangement, either of the exchangable His/Cys pairs could join with His 144 to constitute a redox-coupled exchangeable axial ligand triad.
Interestingly, the crystal structures of the dPer PAS–A and mPer PAS–A (PDB code 3GDI) domains do not share structurally homologous ligand sets. Moreover, neither domain has a full set of three ligands based in the flexible loop regions of their structures. However, both structures could accommodate the heme inside the PAS cavity and potentially provide access to either a bisHis or a His/Cys ligand set. Thus it may be that the only commonality among the heme-binding circadian PAS domains is that their heme cofactors reside inside the “β-hand” cavity. In other words, they may not have strictly conserved His and/or Cys ligands occupying the axial coordination sites of the heme. Their ligand arrangements may depend upon how changes in the heme position and conformation best modulate the interactions of its PAS domain with bHLH and other PAS domains to facilitate their heme- and diatomic molecule-dependent functions. Based on the apparent theme of intracavity heme ligands in all the heme-binding PAS proteins that have been structurally characterized to date, the His144, His163/Cys250 ligand set seems the most reasonable and likely candidate for heme binding in CLOCK PAS–A. Interestingly, the optical absorbance and rR spectra of ferric CLOCK PAS–A are most consistent with a bis-His axial ligand set (vide supra). This is in contrast with some heme based CO sensors that contain His/Cys axial ligand sets in their ferric states, as pointed out earlier for RrCooA and NPAS2. Thus, it is possible that the function of CLOCK PAS–A does not require a redox-coupled ligand switch or that the ligand switch is coupled to the formation of interdomain contacts that are not accessible in the isolated PAS–A domain and/or protein-protein complexation templated by the E-box sequence.
Discussion
Spectroscopic comparison of ferric CLOCK PAS–A with other heme-based sensors
The heme-binding PAS domains characterized to date (FixL, EcDos, BxRcoM, mPer, and NPAS2) bind a single heme cofactor. The 1:1 stoichiometry observed here for CLOCK PAS–A is consistent with that pattern. The Kd for heme dissociation from holo-CLOCK PAS–A is modest but sufficiently high at 10−6 M to conclude that heme is a natural cofactor for this PAS domain.
The chemical and spectroscopic behavior of CLOCK reveals that, of the known PAS-containing proteins, it is most closely related to that of NPAS2 PAS–A. Despite these similarities, the heme coordination chemistry of these two PAS–A domains, as revealed by spectroscopic probes, is distinct. Resonance Raman spectroscopy of the NPAS2 constructs, PAS–A, bHLH–PAS–A, and PAS–B shows a mixture of coordination and spin states (6cHS/5cHS/6cLS, 5cHS/6cLS and 6cHS/6cLS, respectively).10,43,64 Vibrational data have also been interpreted to suggest that the axial ligand set in ferric NPAS2 PAS–A comprises His and Cys, a conclusion based on a pH-dependent νFe–S mode assigned to the Fe–Cys170 stretching frequency of a 5c HS heme species.10 In the case of CLOCK PAS–A, no 5c HS species or pH dependence is observed in the rR spectrum of the ferric form of the protein, and since νFe–S modes are typically resonance enhanced for 5c sulfur-bound ferric hemes, it was not possible to determine whether a Fe–Cys bond exists in ferric CLOCK PAS–A from its LS rR spectrum. Ferric CLOCK PAS–A is 6c LS like BxRcoM–2; however, the UV-visible spectrum of CLOCK PAS–A has its Soret maximum at 413 nm, as opposed to the 423-nm Soret band observed for BxRcoM–2. The axial ligand set of ferric BxRcoM–2 includes Cys and another unidentified ligand. Other ferric heme proteins having axial Cys thiolate ligands generally have a Soret maximum near 421 nm, which is typical of ferric heme complexes with S–FeIII–N or S–FeIII–O axial coordination.38 Of the spectra of heme-binding PAS proteins that are completely 6cLS, the spectrum of ferric CLOCK PAS–A is most similar to that of EcDos which has His/H2O ligation in the ferric state. When compared to other 6cLS heme proteins, the CLOCK PAS–A visible spectrum is most similar to those observed for cytochrome b5, hemopexin, and neuroglobin; these heme proteins are all bis-His ligated. This raises the possibility that CLOCK PAS–A does not have Cys/His ligation in the ferric state as proposed for NPAS2 PAS–A.
Comparison of spectroscopic characteristics of ferrous CLOCK PAS–A with other heme-based sensors
Resonance Raman data for ferrous CLOCK PAS–A indicates that the ferrous form is a mixture of 5cHS and 6cLS heme; similar mixtures of coordination and spin states have also been reported for ferrous NPAS2 and mPer2 PAS–A domains.10,42 This is in contrast to the hemes bound to the PAS domains of EcDos or SmFixL or the heme sensor RrCooA which are converted to a single ferrous form upon reduction.65-67
For heme-based sensors hNPAS2 PAS–A, BxRcoM, EcDos, and RrCooA, a change in heme ligation occurs upon reduction. In the case of hNPAS2 PAS–A and RrCooA, reduction causes the heme Cys ligand to be replaced by a His. For BxRcoM and EcDos, the weaker ligand in the ferric heme is replaced by a Met in the ferrous form. The modeled structure for mCLOCK PAS–A indicates that either His or Cys residues might be available for heme ligation. Data presented here are consistent with at least one His heme ligand in ferrous mCLOCK PAS–A.
Distal electrostatic landscape and CO sensing; comparison of CLOCK PAS–A to other heme proteins known to be CO sensors
Spectral characteristics of the CO complexes of CLOCK PAS–A and NPAS2 PAS–A are quite similar. Their νFe–C, νC–O points occur at virtually the same position on the νFe–C/νC–O correlation plot, indicating that both their proximal and distal environments are very similar. Moreover, the nonbonding environments of their heme substituents also appear quite similar as evinced by their similar propionate and vinyl bending frequencies. In contrast, the CO complexes of the CO sensors RrCooA and BxRcoM–2 are lower on the correlation line indicating that their distal electrostatic landscapes are more neutral than those of the CLOCK and NPAS PAS domains. Thus, the distal electrostatic and H-bonding environment is not deterministic with regard to the CO sensing function.
Axial ligand binding dynamics and mechanism of reversible CO binding in hexacoordinate heme-based sensors
The rate constants in Table 5 suggest the possibility of an emerging trend in the axial ligand dynamics of hexacoordinate heme-based diatomic molecule sensors, as revealed by the kinetics of CO binding and rebinding. Scheme 1 shows a generalized course of events for CO binding to a hexacoordinate heme where k’CO is a composite rate constant that accounts for entry of CO into the heme pocket and its coordination to the heme iron. The values of KdL and k’CO·KdL are the dissociation constants for the endogenous ligand that exchanges with CO (KdL=k−L/kL) and the kinetic binding efficiency for CO, respectively. A casual inspection of the values in these two columns of Table 5 reveals that both vary over several orders of magnitude with no apparent trends in their relationships. Despite this variability, the kinetic efficiency is substantial for formation of all the CO complexes because the values of k’CO are generally large. Note that, even in the case of RrCooA, for which Kd is quite small, kinetic efficiency is maintained by its large k’CO.
Several proteins stand out by virtue of their kL values exceeding 103 s−1. They are CLOCK PAS–A, RrCooA, Synechocystis Hb and neuroglobin. The functions of Synechocystis Hb and neuroglobin are not known. However, RrCooA is known to be a CO sensor and CLOCK PAS–A, by virtue of its similarity with NPAS2 PAS–A, is also likely to be a sensor. In order for a sensor to trigger a physiologically useful, ligand-dependent biochemical response, it must have a low limit of detection for its target ligand. This generally requires a formation constant for its complex with that ligand that is >>1. As this is a common property of heme complexes with the diatomic π acid ligands, CO and NO (XO), sensitivity to these ligands is inherent to heme-based sensors. However, in order for the biochemical response initiated by XO binding to be reversed, there must be a facile pathway for re-establishing the XO-free heme complex when P(XO) decreases. For the aforementioned hexacoordinate heme proteins, this is accomplished through rapid trapping of the coordination site vacated by the dissociated CO ligand. The result of this behavior is that, as P(CO) decreases and CO escapes the heme pocket, its rate of rebinding to the heme becomes less competitive with formation of the hexacoordinate heme having two endogenous ligands. As both RrCooA and CLOCK PAS–A exhibit this behavior, it is reasonable to hypothesize that, in order to effectively drive deactivation of their XO-induced biochemical responses, hexacoordinate heme-based diatomic ligand sensors require a large kL. As the functions of the other two proteins in Table 5 having large values of kL are unknown, it is not clear whether a large kL is definitive for the sensing function.
The rate constant reported for CO association with ferrous NPAS2 PAS–A is not similar to that reported here for CLOCK PAS–A (See Table 4). The discrepancy likely lies in the different experimental approaches used to measure the binding rates. As described above, k’CO for CLOCK PAS–A was determined using flash photolysis experiments, whereas those for NPAS2 were determined by stopped-flow spectrophotometry. It has been demonstrated for a variety of plant, mammalian, and prokaryotic hexacoordinate Hbs that rapid mixing experiments alone are not sufficient to determine the CO association rate constants and may not be sufficient to unambiguously determine k−L because it cannot be assumed that CO binding is rate limited by the dissociation of the endogenous ligand that is exchanged for CO.33 Thus, unless the contributions of k−L and k’CO to the rate of CO binding are accounted for, neither can be determined with confidence.
Table 4.
Rate constants for association of CO with heme-based diatomic gas sensing PAS proteins
| Protein | 10−6×kCO (M−1s−1) | Experimental Method | Ref. |
|---|---|---|---|
| CLOCK PAS–A | 3.1 | Flash photolysis | this work |
| EcDos PAS(M95A) | 9.3 | Flash photolysis | 68 |
| EcDos PAS(M95L) | 3.4 | Flash photolysis | 68 |
| EcDos PAS(M95H) | 6.2 | Flash photolysis | 68 |
| rHb1 | 6.0 | Flash photolysis | 33 |
| NPAS2 bHLH–PAS–A | 3.7×10⁻¹ | Stopped flow | 17 |
| NPAS2 PAS–B | 4×10⁻² | Stopped flow | 17 |
| EcDos | 8.1×10⁻⁴ | Stopped flow | 68 |
| EcDos PAS | 7.8×10⁻³ | Stopped flow | 68 |
| EcDos PAS | 1.1×10⁻³ | Stopped flow | 73 |
The rate constant determined here for CO association with ferrous CLOCK PAS–A is similar to those reported for 6c Hbs and heme pocket Met mutants of EcDos, as determined by flash photolysis (Table 4). It has also been reported that, in a manner similar to CLOCK PAS–A, WT EcDos exhibits two CO-dependent recombination phases when examined by flash photolysis. As both observed rate constants were CO-dependent, they were converted to second order rate constants having values of 1.9×10⁷ M−1·s−1 and 7.1×10⁴ M−1·s−1 by dividing the observed rate constants by [CO].68 Those constants are similar to the average ratios of the kobs values for CLOCK PAS–A to [CO], 1.0×10⁷ M−1·s−1 and 8.8×10⁴ M−1·s−1, respectively. Three CO rebinding phases were recently reported for the PAS domain of EcDos. The first was CO independent and reported to be intramolecular trapping of the vacant coordination site by the endogenous Met ligand (k=3.0×10⁴ s−1). The second two phases are attributed to CO binding and rate constants are reported as second order kons with values of 2.1×10⁶ and 2.8×10⁴ M−1·s−1.69 Again, the two CO-dependent phases occur at rates comparable to those reported here for CLOCK PAS–A. At this time the observed rate constants for EcDos have not been subjected to the kinetic analyses necessary to dissect the elementary rate constants, kL, k−L and k’CO, from CO-dependent multiphasic rebinding reactions. Neither has it been applied to the NPAS2 constructs. Thus, despite the aforementioned similarities among the observed rate constants for CLOCK PAS–A and the hexacoordinate sensors, EcDos and NPAS2, it is not known whether both exhibit kLs ≳ 103 s−1, consistent with the hypothesis (vide supra) that hexacoordinate XO sensors generally require large values of kL. Additional tests of this hypothesis would be to examine the kinetics of CO binding to the recently reported heme-based CO sensing PAS proteins, RcoM–2 and mPer2 PAS–A, to determine whether the values of kH for their endogenous ligands are ≳ 103 s−1.
Both Synechocystis Hb and cytoglobin exhibit large values of kH (Table 5) and k’CO values on the order of 107 M−1·s−1, comparable to that of RrCooA. The functions of these proteins have yet to be identified. However, their kinetic behaviors suggest that it is reasonable to suggest XO sensing as a candidate function.
Comparison of CLOCK PAS–A–NO to nitrosyl complexes of other heme proteins
While PAS proteins like CLOCK PAS–A and NPAS2 bHLH–PAS–A form 5c heme nitrosyl complexes, some PAS–NO derivatives like BxRcoM–NO and EcDos–NO are hexacoordinate. Hence, heme-binding PAS domains modulate the heme environment in a manner that allows for different nitrosyl complexes. The 5c CLOCK PAS–A–NO is similar to nitrosyl complexes of CooA, sGC, and cytochrome c’, as judged by comparison of their visible and vibrational spectra (See Table 3). The Fe–N and the N–O stretching frequencies of the FeNO moiety are correlated, albeit with increased complexity over their FeCO counterparts.70,71 This νFe–N/νN–O correlation for 5c complexes shows an inverse relationship between the Fe–N and the N–O stretching frequencies; for 6c NO heme protein complexes, this inverse correlation is observed when the hydrogen bonding between a distal protein residue and the bound NO occurs through its oxygen (as opposed to through the coordinated N atom).71 When the positions of these protein nitrosyl complexes on the νFe–N/νN–O correlation plot in Figure 11 are compared, CLOCK PAS–A–NO falls in the vicinity of other gas sensor proteins NPAS2 bHLH–PAS–A, RrCooA, SmFixL, and sGC with cytochrome c’ being the only protein that is higher on the 5c NO correlation line.
The reductive nitrosylation of CLOCK PAS–A in the presence of excess NO reveals that, regardless of oxidation state, the thermodynamically favored heme nitrosyl is the {FeNO}7 complex. This reaction is illustrated in Figure S3. Whether full-length CLOCK also undergoes reductive nitrosylation is not known at this time. However, because the reaction is facile in its PAS–A domain, the highly stable {FeNO}7 complex is favored in the presence of excess NO, whether the heme is oxidized or reduced. Thus, it is reasonable to consider the possibility that CLOCK is a NO sensor.
It has been shown that NPAS2, which exhibits properties of a CO sensing transcriptional regulator, can maintain circadian function in the absence of CLOCK.72 Thus it has been suggested that these proteins have overlapping functions in the suprachiasmatic nucleus of the hypothalamus. The results presented here for CLOCK PAS–A are in accord with that suggestion as similarities in the spectroscopic and kinetic properties of their PAS–A hemes are consistent with the possibility that both proteins could act as gas sensors. The NO coordination chemistry and facile reductive nitrosylation of CLOCK PAS–A further suggest the possibility that these proteins could also serve as NO sensors. Given that the coordination numbers of the {FeCO}6 and {FeNO}7 heme complexes are different, it is even possible that the proteins could sense CO and NO differentially to affect different signals. The inability of NO to directly modulate the stability of the NPAS2:BMAL1 complex17 indicates that either the NO signal would generate a different output signal than CO or that NO might influence transcriptional regulation indirectly by competing with CO. Although the availability of detailed kinetic data on hexacoordinate heme proteins is relatively limited, they reveal an emerging and potentially relevant trend. The few sets of rate constants for the elementary reaction steps that govern axial ligand dynamics suggest that the hexacoordinate gas sensors have a propensity for rapid formation of their endogenously hexacoordinate hemes. Thus, it is hypothesized that a large rate constant for that step is necessary to trap the heme coordination site vacated by the dissociated XO ligand. Because of the high stability of heme–CO and heme–NO complexes, this kinetic property may be necessary, albeit perhaps not sufficient to empower a hexacoordinate heme protein to be an effective NO or CO sensor.
Supplementary Material
Acknowledgments
Support from the National Institute of Allergy and Infectious Diseases (AI072719, to KRR) and the Human Frontier Science Program Organization (RGY39/2003, to GM) is gratefully acknowledged. The authors would like to thank Dr. Emeric Wasielewski, PhD for his help with the protein modeling.
Abbreviations
- 5cHS
five-coordinate high spin
- 6cHS
six-coordinate high spin
- 6cLS
six-coordinate low spin
- ALAS
aminolevulinic acid synthase
- PAS
Period-Aryl hydrocarbon receptor nuclear translocator-Simple minded (Per-Arnt-Sim) domains
- NPAS2
neuronal PAS protein 2
- NPAS2 bHLH–PAS–A
isolated basic helix-loop-helix PAS–A domain of NPAS2
- Per2
period homologue 2
- mPer2
mouse Per2
- mPer2 PAS–A
isolated PAS domain of mPer2
- dPer
Drosophila Per
- EcDos
heme-regulated phosphodiesterase from Escherichia coli
- EcDos PAS
isolated PAS domain of EcDos
- SmFixLN and SmFixLH
heme-binding PAS domain of oxygen sensor from Sinorhizobium meliloti, different truncations
- BMAL1
brain and muscle Arnt-like 1
- sGC
soluble guanylate cyclase
- RrCooA
heme-based CO-sensing transcriptional factor from Rhodospirillum rubrum
- HRI
heme-regulated eukaryotic initiation factor 2α kinase
- BxRcoM-2
CO-dependent transcription factor from Burkholderia xenovorans
References
- 1.Hirayama J, Sassone-Corsi P. Curr. Opin. Genet. Dev. 2005;15:548. doi: 10.1016/j.gde.2005.07.003. [DOI] [PubMed] [Google Scholar]
- 2.Reinking J, Lam MMS, Pardee K, Sampson HM, Liu S, Yang P, Williams S, White W, Lajoie G, Edwards A, Krause HM. Cell. 2005;122:195. doi: 10.1016/j.cell.2005.07.005. [DOI] [PubMed] [Google Scholar]
- 3.Yin L, Wu N, Curtin JC, Qatanani M, Szwergold NR, Reid RA, Waitt GM, Parks DJ, Pearce KH, Wisely GB, Lazar MA. Science. 2007;318:1786. doi: 10.1126/science.1150179. [DOI] [PubMed] [Google Scholar]
- 4.Meng QJ, McMaster A, Beesley S, Lu WQ, Gibbs J, Parks D, Collins J, Farrow S, Donn R, Ray D, Loudon A. J. Cell Sci. 2008;121:3629. doi: 10.1242/jcs.035048. [DOI] [PMC free article] [PubMed] [Google Scholar]
- 5.Rogers PM, Ying L, Burris TP. Biochem. Biophys. Res. Commun. 2008;368:955. doi: 10.1016/j.bbrc.2008.02.031. [DOI] [PMC free article] [PubMed] [Google Scholar]
- 6.Pardee KI, Xu X, Reinking J, Schuetz A, Dong A, Liu S, Zhang R, Tiefenbach J, Lajoie G, Plotnikov AN, Botchkarev A, Krause HM, Edwards A. PLoS Biol. 2009;7:384. doi: 10.1371/journal.pbio.1000043. [DOI] [PMC free article] [PubMed] [Google Scholar]
- 7.Marvin KA, Reinking JL, Lee AJ, Pardee K, Krause HM, Burstyn JN. Biochemistry. 2009;48:7056. doi: 10.1021/bi900697c. [DOI] [PMC free article] [PubMed] [Google Scholar]
- 8.Asher G, Schibler U. Trends in Cell Biology. 2006;16:547. doi: 10.1016/j.tcb.2006.09.005. [DOI] [PubMed] [Google Scholar]
- 9.Kaasik K, Lee CC. Nature. 2004;430:467. doi: 10.1038/nature02724. [DOI] [PubMed] [Google Scholar]
- 10.Uchida T, Sato E, Sato A, Sagami I, Shimizu T, Kitagawa T. J. Biol. Chem. 2005;280:21358. doi: 10.1074/jbc.M412350200. [DOI] [PubMed] [Google Scholar]
- 11.Jimenez-Ortega V, Cardinali DP, Poliandri AHB, Cano P, Toso CFR, Esquifino AI. Neurosci. Lett. 2007;425:69. doi: 10.1016/j.neulet.2007.08.019. [DOI] [PubMed] [Google Scholar]
- 12.Artinian LR, Ding JM, Gillette MU. Exp Neurol. 2001;171:293. doi: 10.1006/exnr.2001.7781. [DOI] [PubMed] [Google Scholar]
- 13.Ding JM, Chen D, Weber ET, Faiman LE, Rea MA, Gillette MU. Science. 1994;266:1713. doi: 10.1126/science.7527589. [DOI] [PubMed] [Google Scholar]
- 14.Gu YZ, Hogenesch JB, Bradfield CA. Annu. Rev. Pharmacol. Toxicol. 2000;40:519. doi: 10.1146/annurev.pharmtox.40.1.519. [DOI] [PubMed] [Google Scholar]
- 15.Gilles-Gonzalez MA, Gonzalez G. J. Inorg. Biochem. 2005;99:1. doi: 10.1016/j.jinorgbio.2004.11.006. [DOI] [PubMed] [Google Scholar]
- 16.Roberts GP, Youn H, Kerby RL. Microbiol. Mol. Biol. Rev. 2004;68:453. doi: 10.1128/MMBR.68.3.453-473.2004. [DOI] [PMC free article] [PubMed] [Google Scholar]
- 17.Dioum EM, Rutter J, Tuckerman JR, Gonzalez G, Gilles-Gonzalez MA, McKnight SL. Science. 2002;298:2385. doi: 10.1126/science.1078456. [DOI] [PubMed] [Google Scholar]
- 18.Hogenesch JB, Gu YZ, Jain S, Bradfield CA. Proc. Natl. Acad. Sci. U. S. A. 1998;95:5474. doi: 10.1073/pnas.95.10.5474. [DOI] [PMC free article] [PubMed] [Google Scholar]
- 19.King DP, Zhao Y, Sangoram AM, Wilsbacher LD, Tanaka M, Antoch MP, Steeves TD, Vitaterna MH, Kornhauser JM, Lowrey PL, Turek FW, Takahashi JS. Cell. 1997;89:641. doi: 10.1016/s0092-8674(00)80245-7. [DOI] [PMC free article] [PubMed] [Google Scholar]
- 20.Vitaterna MH, King DP, Chang AM, Kornhauser JM, Lowrey PL, McDonald JD, Dove WF, Pinto LH, Turek FW, Takahashi JS. Science. 1994;264:719. doi: 10.1126/science.8171325. [DOI] [PMC free article] [PubMed] [Google Scholar]
- 21.Aono S. Acc. Chem. Res. 2003;36:825. doi: 10.1021/ar020097p. [DOI] [PubMed] [Google Scholar]
- 22.Roberts GP, Kerby RL, Youn H, Conrad M. J. Inorg. Biochem. 2005;99:280. doi: 10.1016/j.jinorgbio.2004.10.032. [DOI] [PubMed] [Google Scholar]
- 23.Inagaki S, Masuda C, Akaishi T, Nakajima H, Yoshioka S, Ohta T, Pal B, Kitagawa T, Aono S. J. Biol. Chem. 2005;280:3269. doi: 10.1074/jbc.M409884200. [DOI] [PubMed] [Google Scholar]
- 24.Marvin KA, Kerby RL, Youn H, Roberts GP, Burstyn JN. Biochemistry. 2008;47:9016. doi: 10.1021/bi800486x. [DOI] [PMC free article] [PubMed] [Google Scholar]
- 25.Kerby RL, Youn H, Roberts GP. J. Bacteriol. 2008;190:3336. doi: 10.1128/JB.00033-08. [DOI] [PMC free article] [PubMed] [Google Scholar]
- 26.Lanzilotta WN, Schuller DJ, Thorsteinsson MV, Kerby RL, Roberts GP, Poulos TL. Nat. Struct. Biol. 2000;7:876. doi: 10.1038/82820. [DOI] [PubMed] [Google Scholar]
- 27.Clark RW, Youn H, Parks RB, Cherney MM, Roberts GP, Burstyn JN. Biochemistry. 2004;43:14149. doi: 10.1021/bi0487948. [DOI] [PubMed] [Google Scholar]
- 28.Aono S, Ohkubo K, Matsuo T, Nakajima H. J. Biol. Chem. 1998;273:25757. doi: 10.1074/jbc.273.40.25757. [DOI] [PubMed] [Google Scholar]
- 29.Shelver D, Thorsteinsson MV, Kerby RL, Chung SY, Roberts GP, Reynolds MF, Parks RB, Burstyn JN. Biochemistry. 1999;38:2669. doi: 10.1021/bi982658j. [DOI] [PubMed] [Google Scholar]
- 30.Coyle CM, Puranik M, Youn H, Nielsen SB, Williams RD, Kerby RL, Roberts GP, Spiro TG. J. Biol. Chem. 2003;278:35384. doi: 10.1074/jbc.M301000200. [DOI] [PubMed] [Google Scholar]
- 31.Kerby RL, Youn H, Thorsteinsson MV, Roberts GP. J. Mol. Biol. 2003;325:809. doi: 10.1016/s0022-2836(02)01203-2. [DOI] [PubMed] [Google Scholar]
- 32.Sasakura Y, Yoshimura-Suzuki T, Kurokawa H, Shimizu T. Acc. Chem. Res. 2006;39:37. doi: 10.1021/ar0501525. [DOI] [PubMed] [Google Scholar]
- 33.Hargrove MS. Biophys. J. 2000;79:2733. doi: 10.1016/S0006-3495(00)76512-X. [DOI] [PMC free article] [PubMed] [Google Scholar]
- 34.Sali A, Blundell TL. J Mol Biol. 1993;234:779. doi: 10.1006/jmbi.1993.1626. [DOI] [PubMed] [Google Scholar]
- 35.Raghuram S, Stayrook KR, Huang P, Rogers PM, Nosie AK, McClure DB, Burris LL, Khorasanizadeh S, Burris TP, Rastinejad F. Nat. Struct. Mol. Biol. 2007;14:1207. doi: 10.1038/nsmb1344. [DOI] [PMC free article] [PubMed] [Google Scholar]
- 36.Shipulina N, Smith A, Morgan WT. J. Protein Chem. 2000;19:239. doi: 10.1023/a:1007016105813. [DOI] [PubMed] [Google Scholar]
- 37.Lloyd E, Ferrer JC, Funk WD, Mauk MR, Mauk AG. Biochemistry. 1994;33:11432. doi: 10.1021/bi00204a005. [DOI] [PubMed] [Google Scholar]
- 38.Dawson JH, Andersson LA, Sono M. J. Biol. Chem. 1982;257:3606. [PubMed] [Google Scholar]
- 39.Hu S, Morris IK, Singh JP, Smith KM, Spiro TG. J. Am. Chem. Soc. 1993;115:12446. [Google Scholar]
- 40.Hu S, Smith KM, Spiro TG. J. Am. Chem. Soc. 1996;118:12638. [Google Scholar]
- 41.Peterson ES, Friedman JM, Chien EYT, Sligar SG. Biochemistry. 1998;37:12301. doi: 10.1021/bi980752u. [DOI] [PubMed] [Google Scholar]
- 42.Kitanishi K, Igarashi J, Hayasaka K, Hikage N, Saiful I, Yamauchi S, Uchida T, Ishimori K, Shimizu T. Biochemistry. 2008;47:6157. doi: 10.1021/bi7023892. [DOI] [PubMed] [Google Scholar]
- 43.Mukaiyama Y, Uchida T, Sato E, Sasaki A, Sato Y, Igarashi J, Kurokawa H, Sagami I, Kitagawa T, Shimizu T. FEBS Journal. 2006;273:2528. doi: 10.1111/j.1742-4658.2006.05259.x. [DOI] [PubMed] [Google Scholar]
- 44.Rodgers KR, Lukat-Rodgers GS, Barron JA. Biochemistry. 1996;35:9539. doi: 10.1021/bi9530853. [DOI] [PubMed] [Google Scholar]
- 45.Miyatake H, Mukai M, Adachi SI, Nakamura H, Tamura K, Iizuka T, Shiro Y, Strange RW, Hasnain SS. J. Biol. Chem. 1999;274:23176. doi: 10.1074/jbc.274.33.23176. [DOI] [PubMed] [Google Scholar]
- 46.Ray GB, Li XY, Ibers JA, Sessler JL, Spiro TG. J. Am. Chem. Soc. 1994;116:162. [Google Scholar]
- 47.Lukat-Rodgers GS, Wengenack NL, Rusnak F, Rodgers KR. Biochemistry. 2001;40:7149. doi: 10.1021/bi010369g. [DOI] [PubMed] [Google Scholar]
- 48.Reynolds MF, Parks RB, Burstyn JN, Shelver D, Thorsteinsson MV, Kerby RL, Roberts GP, Vogel KM, Spiro TG. Biochemistry. 2000;39:388. doi: 10.1021/bi991378g. [DOI] [PubMed] [Google Scholar]
- 49.Yu AE, Hu S, Spiro TG, Burstyn JN. J. Am. Chem. Soc. 1994;116:4117. [Google Scholar]
- 50.Tomita T, Ogura T, Tsuyama S, Imai Y, Kitagawa T. Biochemistry. 1997;36:10155. doi: 10.1021/bi9710131. [DOI] [PubMed] [Google Scholar]
- 51.Lukat-Rodgers GS, Rodgers KR. Biochemistry. 1997;36:4178. doi: 10.1021/bi9628230. [DOI] [PubMed] [Google Scholar]
- 52.Deinum G, Stone JR, Babcock GT, Marletta MA. Biochemistry. 1996;35:1540. doi: 10.1021/bi952440m. [DOI] [PubMed] [Google Scholar]
- 53.Ford PC, Fernandez BO, Lim MD. Chem. Rev. 2005;105:2439. doi: 10.1021/cr0307289. [DOI] [PubMed] [Google Scholar]
- 54.Addison AW, Stephanos JJ. Biochemistry. 1986;25:4104. doi: 10.1021/bi00362a018. [DOI] [PubMed] [Google Scholar]
- 55.Hoshino M, Ozawa K, Seki H, Ford PC. J. Am. Chem. Soc. 1993;115:9568. [Google Scholar]
- 56.Hoshino M, Maeda M, Konishi R, Seki H, Ford PC. J. Am. Chem. Soc. 1996;118:5702. [Google Scholar]
- 57.Rodgers KR, Lukat-Rodgers GS, Tang L. J. Biol. Inorg. Chem. 2000;5:642. doi: 10.1007/s007750000150. [DOI] [PubMed] [Google Scholar]
- 58.Herold S, Fago A, Weber RE, Dewilde S, Moens L. J. Biol. Chem. 2004;279:22841. doi: 10.1074/jbc.M313732200. [DOI] [PubMed] [Google Scholar]
- 59.Ascenzi P, Bocedi A, Antonini G, Bolognesi M, Fasano M. FEBS J. 2007;274:551. doi: 10.1111/j.1742-4658.2006.05609.x. [DOI] [PubMed] [Google Scholar]
- 60.Ibrahim M, Xu C, Spiro TG. J. Am. Chem. Soc. 2006;128:16834. doi: 10.1021/ja064859d. [DOI] [PMC free article] [PubMed] [Google Scholar]
- 61.Thompson JD, Higgins DG, Gibson TJ. Nucleic Acids Res. 1994;22:4673. doi: 10.1093/nar/22.22.4673. [DOI] [PMC free article] [PubMed] [Google Scholar]
- 62.Kurokawa H, Lee D, Watanabe M, Sagami I, Mikami B, Raman CS, Shimizu T. J Biol Chem. 2004;279:20186. doi: 10.1074/jbc.M314199200. [DOI] [PubMed] [Google Scholar]
- 63.Miyatake H, Mukai M, Park SY, Adachi S, Tamura K, Nakamura H, Nakamura K, Tsuchiya T, Iizuka T, Shiro Y. J Mol Biol. 2000;301:415. doi: 10.1006/jmbi.2000.3954. [DOI] [PubMed] [Google Scholar]
- 64.Koudo R, Kurokawa H, Sato E, Igarashi J, Uchida T, Sagami I, Kitagawa T, Shimizu T. FEBS Journal. 2005;272:4153. doi: 10.1111/j.1742-4658.2005.04828.x. [DOI] [PubMed] [Google Scholar]
- 65.Gonzalez G, Dioum EM, Bertolucci CM, Tomita T, Ikeda-Saito M, Cheesman MR, Watmough NJ, Gilles-Gonzalez MA. Biochemistry. 2002;41:8414. doi: 10.1021/bi025845x. [DOI] [PubMed] [Google Scholar]
- 66.Vogel KM, Spiro TG, Shelver D, Thorsteinsson MV, Roberts GP. Biochemistry. 1999;38:2679. doi: 10.1021/bi982375r. [DOI] [PubMed] [Google Scholar]
- 67.Tamura K, Nakamura H, Tanaka Y, Oue S, Tsukamoto K, Nomura M, Tsuchiya T, Adachi SI, Takahashi S. J. Am. Chem. Soc. 1996;118:9434. [Google Scholar]
- 68.Taguchi S, Matsui T, Igarashi J, Sasakura Y, Araki Y, Ito O, Sugiyama S, Sagami I, Shimizu T. J. Biol. Chem. 2004;279:3340. doi: 10.1074/jbc.M301013200. [DOI] [PubMed] [Google Scholar]
- 69.Ishitsuka Y, Araki Y, Tanaka A, Igarashi J, Ito O, Shimizu T. Biochemistry. 2008;47:8874. doi: 10.1021/bi800248c. [DOI] [PubMed] [Google Scholar]
- 70.Vogel KM, Kozlowski PM, Zgierski MZ, Spiro TG. J. Am. Chem. Soc. 1999;121:9915. [Google Scholar]
- 71.Xu C, Spiro TG. J. Biol. Inorg. Chem. 2008;13:613. doi: 10.1007/s00775-008-0349-8. [DOI] [PMC free article] [PubMed] [Google Scholar]
- 72.DeBruyne JP, Weaver DR, Reppert SM. Nat. Neurosci. 2007;10:543. doi: 10.1038/nn1884. [DOI] [PMC free article] [PubMed] [Google Scholar]
- 73.Delgado-Nixon VM, Gonzalez G, Gilles-Gonzalez MA. Biochemistry. 2000;39:2685. doi: 10.1021/bi991911s. [DOI] [PubMed] [Google Scholar]
- 74.Sato A, Sasakura Y, Sugiyama S, Sagami I, Shimizu T, Mizutani Y, Kitagawa T. J. Biol. Chem. 2002;277:32650. doi: 10.1074/jbc.M204559200. [DOI] [PubMed] [Google Scholar]
- 75.Tomita T, Gonzalez G, Chang AL, Ikeda-Saito M, Gilles-Gonzalez MA. Biochemistry. 2002;41:4819. doi: 10.1021/bi0158831. [DOI] [PubMed] [Google Scholar]
- 76.Gilles-Gonzalez MA, Gonzalez G, Perutz MF, Kiger L, Marden MC, Poyart C. Biochemistry. 1994;33:8067. doi: 10.1021/bi00192a011. [DOI] [PubMed] [Google Scholar]
- 77.Lukat-Rodgers GS, Rexine JL, Rodgers KR. Biochemistry. 1998;37:13543. doi: 10.1021/bi981439v. [DOI] [PubMed] [Google Scholar]
- 78.Monson EK, Weinstein M, Ditta GS, Helinski DR. Proc. Natl. Acad. Sci. U. S. A. 1992;89:4280. doi: 10.1073/pnas.89.10.4280. [DOI] [PMC free article] [PubMed] [Google Scholar]
- 79.Vogel KM, Hu S, Spiro TG, Dierks EA, Yu AE, Burstyn JN. J. Biol. Inorg. Chem. 1999;4:804. doi: 10.1007/s007750050354. [DOI] [PubMed] [Google Scholar]
- 80.Andrew CR, Green EL, Lawson DM, Eady RR. Biochemistry. 2001;40:4115. doi: 10.1021/bi0023652. [DOI] [PubMed] [Google Scholar]
- 81.Igarashi J, Sato A, Kitagawa T, Yoshimura T, Yamauchi S, Sagami I, Shimizu T. J. Biol. Chem. 2004;279:15752. doi: 10.1074/jbc.M310273200. [DOI] [PubMed] [Google Scholar]
- 82.Puranik M, Nielsen SB, Youn H, Hvitved AN, Bourassa JL, Case MA, Tengroth C, Balakrishnan G, Thorsteinsson M,V, Groves JT, McLendon GL, Roberts GP, Olson JS, Spiro TG. J. Biol. Chem. 2004;279:21096. doi: 10.1074/jbc.M400613200. [DOI] [PubMed] [Google Scholar]
- 83.Smagghe BJ, Sarath G, Ross E, Hilbert J. l., Hargrove MS. Biochemistry. 2006;45:561. doi: 10.1021/bi051902l. [DOI] [PubMed] [Google Scholar]
- 84.Hoy JA, Robinson H, Trent JT, Kakar S, Smagghe BJ, Hargrove MS. J. Mol. Biol. 2007;371:168. doi: 10.1016/j.jmb.2007.05.029. [DOI] [PubMed] [Google Scholar]
- 85.Trent JT, III, Hargrove MS. J. Biol. Chem. 2002;277:19538. doi: 10.1074/jbc.M201934200. [DOI] [PubMed] [Google Scholar]
Associated Data
This section collects any data citations, data availability statements, or supplementary materials included in this article.