INTRODUCTION
Thermal ablation with radiofrequency (RF) and microwave energies is becoming an increasingly important treatment for unresectable tumors of the liver, kidney, lung, and bone (1-5). Prior to use in patients, ablation device performance is typically predicted by computer modeling, or characterized with experiments in ex vivo and in vivo models (6-16). The expected size and shape of an ablation zone created by a given device is often based upon these experimental results and utilized to predict clinical performance during human application. Characterization data also aides in pre-procedural planning, potentially in conjunction with computer modeling and treatment planning software (17, 18). As a result, knowledge of the volume of tissue that a device can successfully ablate is important for optimal and safe clinical implementation.
During both clinical and experimental assessment of ablation devices, it has been noted that ablated tissues undergo involution on immediate post-ablation images (19). Although the underlying mechanism has not been described, protein denaturation, contraction of collagen and dehydration known to occur at high temperatures almost certainly contribute (20, 21). Importantly, this observation suggests that measurements of the post-treatment ablation zone may underestimate the pre-treatment dimension of tissue that has been destroyed. Awareness of the degree of contraction associated with different thermal ablation techniques would aid in more accurately estimating actual system performance. The purpose of this study was to determine the amount of tissue contraction during radiofrequency and microwave ablation and whether contraction was related to ablation-induced dehydration of the tissue.
MATERIALS AND METHODS
Experimental setup
Bovine liver and lung tissues were harvested en bloc from a local abattoir, wrapped tightly in a plastic bag to prevent moisture loss, and stored within 1 h of harvesting in a refrigerator at approximately 4 °C. Within the next 24 h, the organs were sliced perpendicular to the capsule (liver) or visceral pleura (lung) into sections approximately 10 cm wide by 10 cm deep, and 6-10 cm tall as permitted by the organ. Sections were allowed to warm to room temperature in a shallow bath of 0.9% saline (liver) or in air (lung) at 20 °C over the course of 1-2 h.
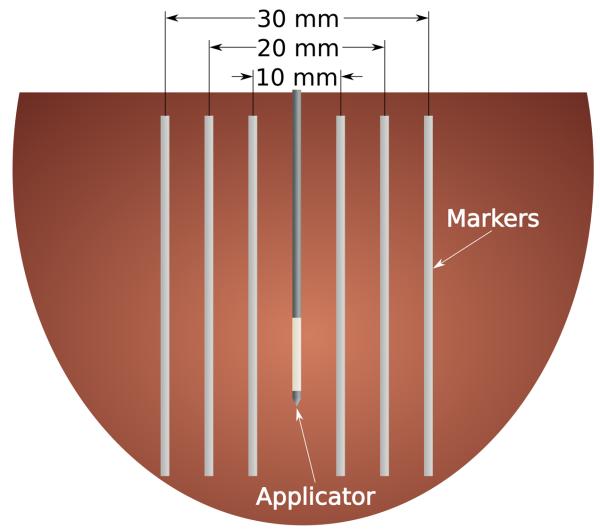
Position markers were created from 1.5 mm diameter polytetrafluoroethylene (PTFE) tubes (McMaster-Carr, Atlanta, GA) and inserted into the tissue using an acrylic template and 20-gauge introducer needles. The tubes were oriented parallel to each other along a plane bisecting the ablation applicator to create three diametric markers – inner, middle and peripheral – approximately 10 mm, 20 mm and 30 mm apart, respectively (Figure 1). Only the inner and peripheral markers were placed in lung samples because preliminary data showed that the shrinking effect was so substantial that the middle markers artificially limited movement of the other markers. Soft plastic tubes were chosen because they are flexible and, unlike metallic wires, should not interfere with RF current or microwave propagation.
Figure 1.
Cartoon section of the experimental setup. Thin, flexible markers were placed on either side of the ablation applicator to mark the original position of the tissue at peripheral (30 mm), middle (20 mm) and inner (10 mm) locations. Lung samples only included the peripheral and inner points due to the large amount of contraction that occurred during ablation.
Measurement procedure
Control measurements (n = 9 in liver, n = 8 in lung) were performed using markers in tissue that did not undergo ablation to assess placement error and provide a dataset to which post-ablation measurements could be compared. A total of 36 ablations were created in liver (n = 20) and lung (n = 16) utilizing either a 17-gauge cooled RF electrode (Cool-tip™, Covidien, Boulder, CO) or a prototype 17-gauge water-cooled triaxial antenna (22). In both the RF and microwave ablation groups, input powers and times were designed to create a 25-30 mm ablation zone that would encompass all of the position markers: 12 min at 200 W max using impedance-based power pulsing for RF (n = 12 in liver, n = 8 in lung); 7 min at 65 W for microwave (n = 8 in liver, n = 8 in lung). After ablation, tissues were sliced along the marker plane to permit full visualization of all markers in situ. Controls were sliced in the same fashion. Ablation zone diameter and the minimum distance between the inner, middle and peripheral markers were then measured. Total contraction in millimeters (mm), TC, was calculated as the difference between pre- and post-ablation diameters at each position. We also calculated a relative contraction in mm, RC, at each position by subtracting the total contraction from the nearest more central position:
| (1) |
| (2) |
The total and relative contractions measured at the inner position are equivalent. Relative contraction at the middle position in lung was estimated based on a linear interpolation of the inner and peripheral positions and only used for comparison to water content, as described below.
Dehydration measurements
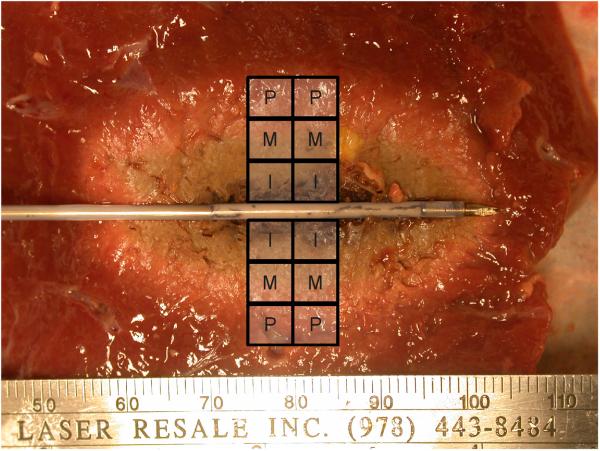
Additional samples of ex vivo bovine liver and lung were sectioned immediately post-ablation into 5 mm × 5 mm × 5 mm blocks around each measurement position (n = 144 total, 12 for each marker position, tissue and energy combination; Figure 2). Sample masses were then determined from an electronic balance (Sartorius Analytical, Westbury, New York) before being dehydrated at 60 °C for at least 24 h to remove all available water (Ronco 187-04; Beverly Hills, CA). The mass of each sample was determined after dehydration and the mass-fraction of water, FW, calculated as
| (3) |
where mpre is the mass of the sample in grams (g) before dehydration and mpost is the mass of the sample after dehydration. Since only two positions were measured from lung samples, dehydration at the middle position was estimated based on a linear interpolation of the inner and peripheral positions. Mass-fraction of water was also recorded from normal liver and lung tissues (n = 9 each) to estimate the percentage of water mass removed during the ablation.
Figure 2.
Tissues were sectioned into approximately 125 mm3 blocks from the center of the ablation zone to encompass the peripheral, middle and inner measurement points for dehydration analysis.
Statistical analysis
Diameters pre- and post-ablation were analyzed using mixed effect linear regression. Since the set of diameter measurements was not normally distributed, the square root was used as the dependent variable in the models. The models included the independent variables tissue type (lung, liver), energy type (control, RF, microwave), and marker position (inner, middle, outer) with a random effect for the tissue. All potential interactions were included in the model to account for any three-way interactions. P-values less than 0.05 were considered statistically significant.
RESULTS
Ablation-induced tissue contraction
No differences were noted between RF and microwave ablations in liver (mean diameter ± standard deviation: 32.6 ± 5.2 mm and 33.1 ± 3.4 mm; P = .82) or lung (22.2 ± 3.1 mm and 23.4 ± 2.9 mm; P = .47).
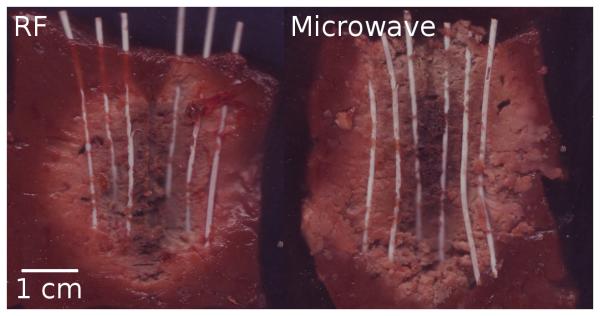
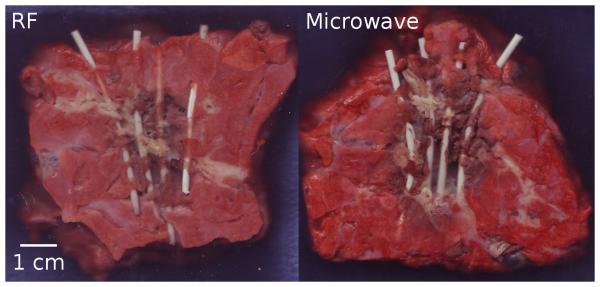
Overall, post-ablation diameters were significantly smaller at each position when compared to controls (P < .0001; Table 1). The peripheral position, which is closest to the ablation zone measurement, contracted a total of 15% for RF ablation in liver, 30% for microwave ablation in liver, 55% for RF ablation in lung and 49% for microwave ablation in lung. Total contraction was greatest near the peripheral portions of the ablation zone, with decreasing effect at the middle and inner positions (Figures 3-6). Conversely, relative contraction was most substantial at the inner position, with less contraction noted at the middle and peripheral positions (Table 2). When comparing tissue types, we found that lung tissue was overall characterized by significantly more contraction than liver (P < .0004). When comparing energy types, microwaves produced greater contraction than RF in liver (P < .0001) but not in lung (P > .45)
Table 1.
Predicted mean diameter (standard deviation) by marker location, tissue type and energy type.
| Energy Type | P-values for Energy Type | |||||||
|---|---|---|---|---|---|---|---|---|
| Control | RF | Microwave | Overall | Control vs RF |
Control vs Microwave |
RF vs Microwave |
||
| Inner | Liver | 9.54 (0.7) | 6.61 (0.6) | 5.92 (0.6) | < .0001 | < .0001 | < .0001 | .0991 |
| Lung | 9.25 (0.3) | 4.13 (0.4) | 4.44 (1.0) | < .0001 | < .0001 | < .0001 | .4692 | |
|
| ||||||||
| Middle | Liver | 19.8 (0.4) | 15.0 (1.6) | 13.2 (0.9) | < .0001 | < .0001 | < .0001 | .0070 |
| Lung | --- | --- | --- | --- | --- | --- | --- | |
|
| ||||||||
| Peripheral | Liver | 30.0 (0.5) | 25.5 (3.6) | 21.0 (1.9) | < .0001 | < .0001 | < .0001 | < .0001 |
| Lung | 28.9 (0.3) | 14.7 (1.3) | 15.2 (2.1) | < .0001 | < .0001 | < .0001 | .4504 | |
|
| ||||||||
|
P-values for Lung vs Liver |
Inner | .5867 | < .0001 | .0004 | ||||
| Peripheral | .2700 | < .0001 | < .0001 | |||||
Figure 3.
Markers exposed after RF (left) and microwave ablation (right) in normal liver tissue. Line represents 1 cm scale.
Figure 6.
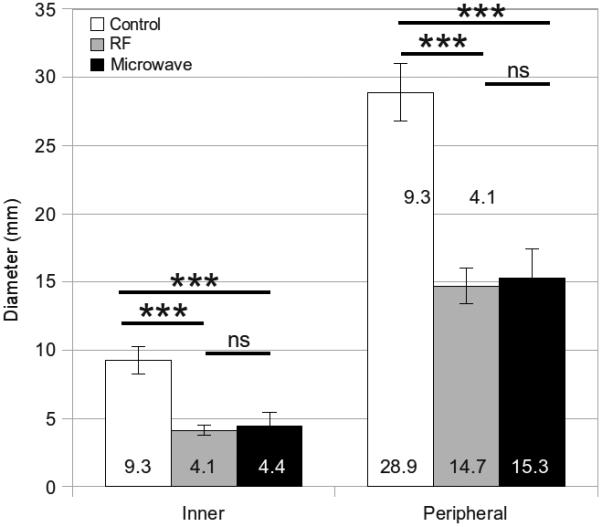
Mean inner, middle and peripheral diameters measured from unablated controls, RF ablations and microwave ablations in lung tissue. Error bars represent the standard error of the mean. Measures of significance are noted between groups as follows: *** P < .0001, ns = not significant.
Table 2.
Relative contraction and mean water content (standard deviation) by marker location, tissue type and energy type. Asterisks indicate interpolated estimates.
| Relative Contraction (mm) | Mass fraction of Water (%) | ||||
|---|---|---|---|---|---|
| RF | Microwave | RF | Microwave | ||
| Inner | Liver | 2.93 | 3.62 | 56 (8) | 51 (10) |
| Lung | 5.13 | 4.81 | 71 (6) | 58 (16) | |
| Middle | Liver | 1.85 | 2.91 | 63 (9) | 67 (7) |
| Lung | 4.56* | 4.44* | 73 (5)* | 66 (10)* | |
| Peripheral | Liver | −0.44 | 2.47 | 68 (10) | 71 (7) |
| Lung | 4.56 | 4.44 | 75 (4) | 74 (5) | |
Dehydration analysis
Mean (± standard deviation) mass-fractions of water in normal liver and lung were 71% ± 4.5 and 77% ± 2.3, respectively. The mass-fractions of water measured at each position ranged from 29.8% to 79.2% in liver, and from 23.1% to 81.8% in lung (Table 2). A positive correlation between the percentage of water removed and relative contraction was noted for RF and microwave ablations in liver and lung tissues. This correlation was weaker for microwave ablations (Figure 7).
Figure 7.
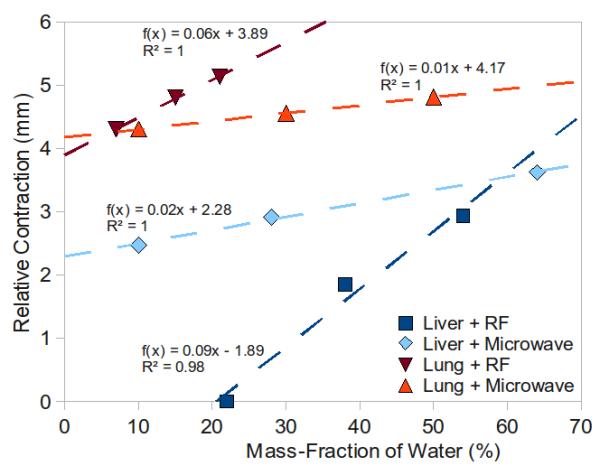
Positive correlation between relative contraction and the mass fraction of water for RF and microwave ablation in liver and lung tissues. Dashed lines represent the best-fit linear trendline for each dataset with fitting function, f(x), and coefficient of determination, R2, defined for each.
DISCUSSION
Our study found that ex vivo liver and lung tissues contract 15-50% along one diameter, or an approximate volume reduction of 27-75%, as a result of RF and microwave ablation. We found that microwaves induced significantly more contraction than RF in liver tissue, but a similar difference was not noted in lung. Total contraction was significantly greater in lung than liver, while relative contraction was most marked near the applicator with decreasing effect further from the applicator. Tissue dehydration correlated positively with relative contraction.
Our findings have both research and clinical implications. The relatively high amount of diametric contraction should be considered when evaluating the performance of ablative devices ex vivo. For example, our data suggests that if a device creates a 2-2.5 cm diameter ablation zone in ex vivo liver, the original diameter of tissue included in that ablation zone was likely 3 cm or larger. Based on our findings, contraction will likely depend on the energy type used, the device, applied power, treatment time and type of tissue ablated. In addition, our findings shed light on the problem of using computer modeling to predict device performance, especially when comparing computer models to experimental results. Without accounting for tissue contraction, a computer model is likely to overestimate the actual diameter measured post-ablation experimentally, an effect that has plagued previous studies (10, 23).
Similarly, tissue contraction may be relevant when comparing pre-ablation and post-ablation images. It has been shown that the correlation between imaging and histopathologic changes depends on the time after ablation and the modality used, with some studies noting an increase in ablation zone size on imaging performed a few days after ablation (19, 24, 25). The findings of this study suggest that immediate post-ablation imaging may underestimate the original volume of tissue treated. It is also possible that delayed increases in ablation zone size seen at imaging may be related to rehydration of the zone of ablation. More evaluation will be needed to test these hypotheses, since the timing of the post-ablation imaging may have an important impact on the assessment of treatment response.
Microwave ablation is associated with faster heating in a larger volume around the applicator, and higher temperatures than RF (> 150 °C); thus, the result that dehydration caused by microwave heating has a weaker correlation with relative contraction is somewhat surprising (21, 26, 27). We found that microwaves created more dehydration at the inner position, but less dehydration at the peripheral position than RF. These results might be partially explained by the hypothesis that water vapor driven from the inner position re-condensed and artificially elevated water content in the middle and peripheral positions of microwave ablations (21, 23). Such an effect may be less likely with RF energy since the maximum temperature threshold is only 100 °C. We also noted that contraction in normal lung was more significant than in liver, regardless of energy type, and was less correlated to dehydration. One possible explanation for this finding is that contraction in the lung may be more related to the effects of heat on collagen and tissue architecture collapse around the air-filled spaces, rather than dehydration (20). It should also be noted that the microwave energy used in this study was designed to create an ablation similar in size to an RF ablation. The effects of input power and time on dehydration and contraction remain to be explored, but it is reasonable to expect that using higher powers or longer treatment times would increase the amount of dehydration and tissue contraction. More direct measurements of tissue contraction and dehydration appears warranted to help explain some of these findings in more detail.
The primary limitation to this study was the use of unperfused ex vivo tissues. Further study will be needed to determine whether these findings are confirmed in a perfused or in vivo model. In vivo testing should also help determine whether the ablation zone rehydrates and expands post-ablation. However, the ex vivo model is simpler, more controlled and valuable for relative comparison of devices precisely due to the lack of perfusion. Since many ablation devices are developed and characterized in ex vivo models, the results of this study have immediate relevance.
The study was also limited in its use of normal tissue. Our finding that the amount of contraction is tissue specific implies that various pathologies of tumors may have dissimilar and distinct responses to heat. For example, fatty tumors may not experience as much dehydration due to their lower inherent water content; fibrous tumors may contract more due to collagen shrinking than dehydration. These hypotheses need additional testing for verification. However, recent reports of tumor involution immediately after RF ablation support the hypothesis that the response of some tumors to heat can be approximated by normal liver tissue (19).
Finally, as noted above, the methods used to compare relative contraction to dehydration need refinement. Both measurements could not be performed on the same sample, so relative contraction was estimated based on the pre- and post-ablation diameter measurement groups. Additional study with image-based markers and direct observation of both hydration and diameter changes is ongoing.
In conclusion, RF and microwave ablation both cause significant contraction of normal bovine liver and lung tissue ex vivo. In liver, contraction appears to be primarily due to dehydration, while in the lung architectural distortion and collapse may have more influence. Ablation-induced contraction also appears to be tissue type and ablation modality specific. As a result, post-ablation measurements may not accurately depict the original dimensions of the treated tissue when evaluating device performance or assessing treatment response in the clinical setting.
Figure 4.
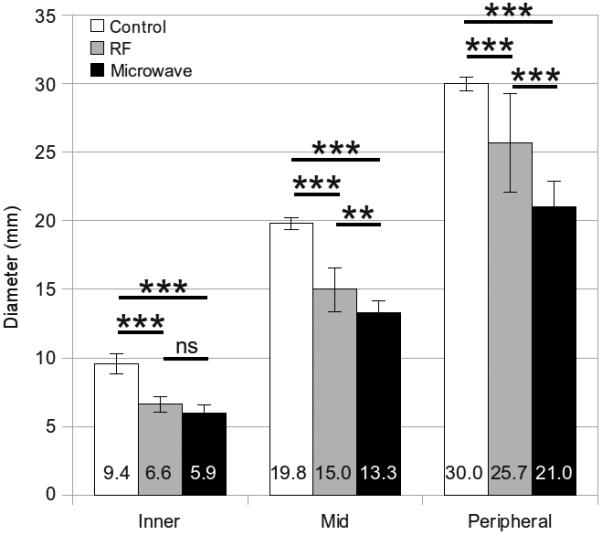
Mean inner, middle and peripheral diameters measured from unablated controls, RF ablations and microwave ablations in liver tissue. Error bars represent the standard error of the mean. Measures of significance are noted between groups as follows: *** P < .0001, ** P < .001, ns = not significant.
Figure 5.
Markers exposed after RF (left) and microwave ablation (right) in normal lung tissue. Line represents 1 cm scale.
Acknowledgment
The authors wish to thank Lisa Sampson for her assistance in data collection and Tara Becker for her statistical assistance. This work was funded by the National Institutes of Health, 1R01CA108869.
Footnotes
Publisher's Disclaimer: This is a PDF file of an unedited manuscript that has been accepted for publication. As a service to our customers we are providing this early version of the manuscript. The manuscript will undergo copyediting, typesetting, and review of the resulting proof before it is published in its final citable form. Please note that during the production process errors may be discovered which could affect the content, and all legal disclaimers that apply to the journal pertain.
BIBLIOGRAPHY
- 1.Garrean S, Hering J, Saied A, Helton WS, Espat NJ. Radiofrequency ablation of primary and metastatic liver tumors: a critical review of the literature. Am J Surg. 2008;195:508–520. doi: 10.1016/j.amjsurg.2007.06.024. [DOI] [PubMed] [Google Scholar]
- 2.Livraghi T, Meloni F, Di Stasi M, et al. Sustained complete response and complications rates after radiofrequency ablation of very early hepatocellular carcinoma in cirrhosis: is resection still the treatment of choice? Hepatology. 2008;47:82–89. doi: 10.1002/hep.21933. [DOI] [PubMed] [Google Scholar]
- 3.Rose SC, Thistlethwaite PA, Sewell PE, Vance RB. Lung cancer and radiofrequency ablation. J Vasc Interv Radiol. 2006;17:927–951. doi: 10.1097/01.RVI.0000222707.44902.66. [DOI] [PubMed] [Google Scholar]
- 4.Cantwell CP, O'Byrne J, Eustace S. Radiofrequency ablation of osteoid osteoma with cooled probes and impedance-control energy delivery. AJR Am J Roentgenol. 2006;186:S244–8. doi: 10.2214/AJR.04.0938. [DOI] [PubMed] [Google Scholar]
- 5.Goldberg SN, Grassi CJ, Cardella JF, et al. Image-guided tumor ablation: standardization of terminology and reporting criteria. J Vasc Interv Radiol. 2009;20:S377–90. doi: 10.1016/j.jvir.2009.04.011. [DOI] [PubMed] [Google Scholar]
- 6.Hines-Peralta A, Hollander CY, Solazzo S, Horkan C, Liu Z, Goldberg SN. Hybrid radiofrequency and cryoablation device: preliminary results in an animal model. J Vasc Interv Radiol. 2004;15:1111–1120. doi: 10.1097/01.RVI.0000136031.91939.EC. [DOI] [PubMed] [Google Scholar]
- 7.Livraghi T, Goldberg SN, Monti F, et al. Saline-enhanced radio-frequency tissue ablation in the treatment of liver metastases. Radiology. 1997;202:205–210. doi: 10.1148/radiology.202.1.8988212. [DOI] [PubMed] [Google Scholar]
- 8.Goldberg SN, Gazelle GS, Solbiati L, Rittman WJ, Mueller PR. Radiofrequency tissue ablation: increased lesion diameter with a perfusion electrode. Acad Radiol. 1996;3:636–644. doi: 10.1016/s1076-6332(96)80188-7. [DOI] [PubMed] [Google Scholar]
- 9.Gananadha S, Daniel S, Zhao J, Morris DL. An experimental evaluation of ablation devices for the local treatment of the liver resection edge. Eur J Surg Oncol. 2005;31:528–532. doi: 10.1016/j.ejso.2005.02.022. [DOI] [PubMed] [Google Scholar]
- 10.Brace CL, Laeseke PF, van der Weide DW, Lee FT. Microwave ablation with a triaxial antenna: results in ex vivo bovine liver. IEEE Trans Microw Theory Tech. 2005;53:215–220. doi: 10.1109/TMTT.2004.839308. [DOI] [PMC free article] [PubMed] [Google Scholar]
- 11.Yang D, Bertram JM, Converse MC, et al. A floating sleeve antenna yields localized hepatic microwave ablation. IEEE Trans Biomed Eng. 2006;53:533–537. doi: 10.1109/TBME.2005.869794. [DOI] [PubMed] [Google Scholar]
- 12.Hines-Peralta AU, Pirani N, Clegg P, et al. Microwave ablation: results with a 2.45-ghz applicator in ex vivo bovine and in vivo porcine liver. Radiology. 2006;239:94–102. doi: 10.1148/radiol.2383050262. [DOI] [PubMed] [Google Scholar]
- 13.Denys AL, De Baere T, Kuoch V, et al. Radio-frequency tissue ablation of the liver: in vivo and ex vivo experiments with four different systems. Eur Radiol. 2003;13:2346–2352. doi: 10.1007/s00330-003-1970-0. [DOI] [PubMed] [Google Scholar]
- 14.Goldberg SN, Stein MC, Gazelle GS, Sheiman RG, Kruskal JB, Clouse ME. Percutaneous radiofrequency tissue ablation: optimization of pulsed-radiofrequency technique to increase coagulation necrosis. J Vasc Interv Radiol. 1999;10:907–916. doi: 10.1016/s1051-0443(99)70136-3. [DOI] [PubMed] [Google Scholar]
- 15.Goldberg SN, Solbiati L, Hahn PF, et al. Large-volume tissue ablation with radio frequency by using a clustered, internally cooled electrode technique: laboratory and clinical experience in liver metastases. Radiology. 1998;209:371–379. doi: 10.1148/radiology.209.2.9807561. [DOI] [PubMed] [Google Scholar]
- 16.Goldberg SN, Hahn PF, Tanabe KK, et al. Percutaneous radiofrequency tissue ablation: does perfusion-mediated tissue cooling limit coagulation necrosis? J Vasc Interv Radiol. 1998;9:101–111. doi: 10.1016/s1051-0443(98)70491-9. [DOI] [PubMed] [Google Scholar]
- 17.Meyer M, Velte H, Lindenborn H, Bangert A, Dahlhaus D, Albers P. Radiofrequency ablation of renal tumors improved by preoperative ex-vivo computer simulation model. J Endourol. 2007;21:886–890. doi: 10.1089/end.2006.0458. [DOI] [PubMed] [Google Scholar]
- 18.Amin V, Wu L, Long T, Roberts R, McClure S, Ryken T. Therapy planning and monitoring of tissue ablation by high intensity focused ultrasound (hifu) using imaging and simulation. Conf Proc IEEE Eng Med Biol Soc. 2008;2008:4471. doi: 10.1109/IEMBS.2008.4650204. [DOI] [PubMed] [Google Scholar]
- 19.Ganguli S, Brennan DD, Faintuch S, Rayan ME, Goldberg SN. Immediate renal tumor involution after radiofrequency thermal ablation. J Vasc Interv Radiol. 2008;19:412–418. doi: 10.1016/j.jvir.2007.10.024. [DOI] [PubMed] [Google Scholar]
- 20.Wall MS, Deng XH, Torzilli PA, Doty SB, O'Brien SJ, Warren RF. Thermal modification of collagen. J Shoulder Elbow Surg. 1999;8:339–344. doi: 10.1016/s1058-2746(99)90157-x. [DOI] [PubMed] [Google Scholar]
- 21.Yang D, Converse MC, Mahvi DM, Webster JG. Measurement and analysis of tissue temperature during microwave liver ablation. IEEE Trans Biomed Eng. 2007;54:150–155. doi: 10.1109/TBME.2006.884647. [DOI] [PubMed] [Google Scholar]
- 22.Brace CL, Laeseke PF, Sampson LA, Frey TM, van der Weide DW, Lee FT., Jr Microwave ablation with a single small-gauge triaxial antenna: in vivo porcine liver model. Radiology. 2007;242:435–440. doi: 10.1148/radiol.2422051411. [DOI] [PMC free article] [PubMed] [Google Scholar]
- 23.Yang D, Converse MC, Mahvi DM, Webster JG. Expanding the bioheat equation to include tissue internal water evaporation during heating. IEEE Trans Biomed Eng. 2007;54:1382–1388. doi: 10.1109/TBME.2007.890740. [DOI] [PubMed] [Google Scholar]
- 24.Raman SS, Lu DS, Vodopich DJ, Sayre J, Lassman C. Creation of radiofrequency lesions in a porcine model: correlation with sonography, ct, and histopathology. AJR Am J Roentgenol. 2000;175:1253–1258. doi: 10.2214/ajr.175.5.1751253. [DOI] [PubMed] [Google Scholar]
- 25.Steinke K, King J, Glenn D, Morris DL. Radiologic appearance and complications of percutaneous computed tomography-guided radiofrequency-ablated pulmonary metastases from colorectal carcinoma. J Comput Assist Tomogr. 2003;27:750–757. doi: 10.1097/00004728-200309000-00012. [DOI] [PubMed] [Google Scholar]
- 26.Laeseke PF. Devices and techniques for multiple-applicator tumor ablation. University of Wisconsin; Madison (WI): 2007. PhD [dissertation] [Google Scholar]
- 27.Brace CL, Hinshaw JL, Laeseke PF, Sampson LA, Lee FT., Jr Pulmonary thermal ablation: comparison of radiofrequency and microwave devices by using gross pathologic and ct findings in a swine model. Radiology. 2009;251:705–711. doi: 10.1148/radiol.2513081564. [DOI] [PMC free article] [PubMed] [Google Scholar]


