

Abstract
Background
Discriminating malignant breast lesions from benign ones and accurately predicting the risk of breast cancer for individual patients are critical in successful clinical decision-making. In the past, several artificial neural network (ANN) models have been developed for breast cancer risk prediction. All of these studies reported discrimination performance, but none has assessed calibration, which is an equivalently important measure for accurate risk prediction. In this study, we have evaluated whether an artificial neural network (ANN) trained on a large prospectively-collected dataset of consecutive mammography findings can discriminate between benign and malignant disease and accurately predict the probability of breast cancer for individual patients.
Methods
Our dataset consisted of 62,219 consecutively collected mammography findings matched with Wisconsin State Cancer Reporting System. We built a three-layer feedforward ANN with 1000 hidden layer nodes. We trained and tested our ANN using ten-fold cross validation to predict the risk of breast cancer. We used area the under the receiver operating characteristic curve (AUC), sensitivity, and specificity to evaluate discriminative performance of the radiologists and our ANN. We assessed the accuracy of risk prediction (i.e. calibration) of our ANN using the Hosmer–Lemeshow (H-L) goodness-of-fit test.
Results
Our ANN demonstrated superior discrimination, AUC = 0.965, as compared to the radiologists, AUC = 0.939 (P < 0.001). Our ANN was also well-calibrated as shown by an H-L goodness of fit P-value of 0.13.
Conclusion
Our ANN can effectively discriminate malignant abnormalities from benign ones and accurately predict the risk of breast cancer for individual abnormalities.
Keywords: breast cancer, neural networks, risk assessment, discrimination, calibration, computer-assisted diagnosis, computer-assisted radiographic image interpretation, computer-assisted decision making
Introduction
Successful breast cancer diagnosis requires systematic image analysis, characterization, and integration of many clinical and mammographic variables.1 An ideal diagnostic system would discriminate between benign and malignant findings perfectly. Unfortunately, perfect discrimination has not been achieved, so radiologists must make decisions based on their best judgment of breast cancer risk amidst substantial uncertainty. When there are numerous interacting predictive variables, ad hoc decision-making strategies based on experience and memory may lead to errors2 and variability in practice.3, 4 That is why there is intense interest in developing tools that can calculate an accurate probability of breast cancer to aid in decision-making.5-7
Discrimination and calibration are the two main components of accuracy in a risk assessment model.8, 9 Discrimination is the ability to distinguish benign abnormalities from malignant ones. Although assessing discrimination with area under the receiver operating characteristic (ROC) curve (AUC) is a popular method in medical community, it may not be optimal in assessing risk prediction models that stratify individuals into risk categories.10 In this setting, calibration is also an important tool for accurate risk assessment for individual patients. Calibration measures how well the probabilities generated by the risk prediction model agree with the observed probabilities in the actual population of interest.11 There is a trade-off between discrimination and calibration, and a model typically cannot be perfect in both.10 In general, risk prediction models need good discrimination if their aim is to separate malignant findings from benign ones, and good calibration if their aim is to stratify individuals into higher or lower risk categories to aid in decision-making and communication.11
Computer models have the potential to help radiologists increase the accuracy of mammography examinations in both detection12-15 and diagnosis.16-20 Existing computer models in the domain of breast cancer diagnosis can be classified under three broad categories: prognostic, computer-aided detection (CAD), and computer-aided diagnostic (CADx) models. Prognostic models such as the Gail model21-24 use retrospective risk factors such as a woman's age, her personal and family histories of breast cancer, and clinical information to predict breast cancer risk over a time interval in the future for treatment or risk reduction decisions.24 These models provide guidance for clinical trials eligibility, tailored disease surveillance, and chemo-prevention strategies.25 Because risk stratification is of primary interest in prognostic models, the performance of these models is assessed principally by calibration measures.11 Detection or CAD models12-15, 26-28 are developed to assist radiologists in identifying possible abnormalities in radiologic images, leaving the interpretation of the abnormality to the radiologist.29 Because discrimination is most important and calibration is less critical in detection, the performance of CAD models is typically evaluated in terms of ROC curves.11 CADx models30-39 characterize findings from mammograms (e.g., size, contrast, shape) identified either by a radiologist or a CAD model29 to help radiologists classify lesions as benign and malignant by providing objective information, such as the risk of breast cancer.40 CADx models are similar to prognostic models in one way; they estimate the risk of breast malignancy to help physicians and patients improve decision making.29 On the other hand, CADx models differ from prognostic models in the sense that their risk estimation is based on mammography findings and at a single time point (i.e. at the time of mammography) in order to aid in further imaging or intervention decisions. Both, discrimination and calibration are important features of a CADx model. High discrimination is needed because helping radiologists to distinguish malignant findings from benign ones is the primary purpose of CADx models.11 In addition, good calibration is needed to stratify risk and communicate the risk with patients as in the example of prognostic models.11
However, existing CADx studies using ANNs to assess the risk of breast cancer have ignored calibration and focused only on discrimination ability.31, 36, 38, 39 Most of these studies have good discrimination but may be very poorly calibrated.41 For example, four such models report that no cancers would be missed if the threshold to defer biopsy was set to 10% - 20%.31, 35, 37, 42 By suggesting a threshold in this range to defer biopsy, these models not only substantially exceed the accepted biopsy threshold in clinical practice of 2%,43 but also indicate a systematic overestimation of malignancy risk. This discrepancy is likely attributable to suboptimal calibration.
In addition, existing studies have several potential limitations that make them impractical for clinical implementation. First, the size of training datasets used for building ANNs in these previous studies has been relatively small (104-1288 lesions)31, 35, 36, 38, 39 to obtain reliable models. Second, the majority of these studies developed models using only findings that underwent to biopsy30, 31, 35-37, 39 or were referred to a surgeon38 and excluded other findings in their analysis, which may lead to biased models.
Our research team has developed two CADx models using the same dataset to discriminate malignant mammography findings from benign ones.33, 34 On the other hand, this study differs from our previous research in two different ways. First, this study utilizes a different modeling technique (an artificial neural network) than our previous research, which used logistic regression (LR) and Bayesian network (BN). Second, this study considers calibration whereas our previous research, like many other CADx models, did not evaluate calibration but only evaluated discrimination.
The purpose of our study is to evaluate whether an ANN trained on a large prospectively-collected dataset of consecutive mammography findings can discriminate between benign and malignant disease and accurately predict the probability of breast cancer for individual patients.
Materials and Methods
The Institutional Review Board exempted this HIPAA-compliant, retrospective study from requiring informed consent. The data used in this study have been presented in our previous studies33, 34 and repeated here for the convenience of the reader.
Data Collection
All of the screening and diagnostic mammograms performed at the Froedtert and Medical College of Wisconsin Breast Care Center between April 5, 1999 and February 9, 2004 were included in our dataset for retrospective evaluation. We consolidated our database in the National Mammography Database (NMD) format, a data format based on standardized the Breast Imaging Reporting and Data System (BI-RADS) lexicon developed by the American College of Radiology (ACR) for standardized monitoring and tracking of patients.44, 45 The study group consisted of 48,744 mammograms belonging to 18,269 patients (Table 1).
Table 1.
Distribution of study population
| Malignant (%) | Benign (%) | Total (%) | |
|---|---|---|---|
| Number of Mammograms | 477 (1) | 48267 (99) | 48,744 (100) |
| Age Groups | |||
| <45 | 66 (13.84) | 9,529 (19.74) | 9595 (19.68) |
| 45-49 | 49 (10.27) | 7,524 (15.59) | 7573 (15.54) |
| 50-54 | 56 (11.74) | 7,335 (15.2) | 7391 (15.16) |
| 55-59 | 71 (14.88) | 6,016 (12.46) | 6087 (12.49) |
| 60-64 | 59 (12.37) | 4,779 (9.9) | 4838 (9.93) |
| >=65 | 176 (36.9) | 13,084 (27.11) | 13260 (27.20) |
| Breast Density | |||
| Predominantly fatty | 61 (12.79) | 7,226 (14.97) | 7,287 (14.95) |
| Scattered fibroglandular | 201 (42.14) | 19,624 (40.66) | 19,825 (40.67) |
| Heterogeneously dense | 174 (36.48) | 17,032 (35.29) | 17,206 (35.30) |
| Extremely dense tissue | 41 (8.6) | 4,385 (9.08) | 4,426 (9.08) |
| BI-RADS Category | |||
| 1 | 0 (0) | 21,094 (43.7) | 21,094 (43.28) |
| 2 | 13 (2.73) | 10,048 (20.82) | 10,061 (20.64) |
| 3 | 32 (6.71) | 8,520 (17.65) | 8,552 (17.54) |
| 0 | 130 (27.25) | 8,148 (16.88) | 8,278 (16.98) |
| 4 | 137 (28.72) | 364 (0.75) | 501 (1.03) |
| 5 | 165 (34.59) | 93 (0.19) | 258 (0.53) |
Each mammogram was prospectively interpreted by one of eight radiologists. Four of these radiologists were general radiologists, two of them were fellowship trained in breast imaging, and the other two had extensive experience in breast imaging. These radiologists had between 1-35 years of experience interpreting mammography. Each radiologist reviewed 6,994 mammograms on average (median= 2,924; range= 49-22,219) in our dataset.
Each mammographic finding, if any, on a mammogram was recorded as a unique entry in our database. In case of a negative mammogram, a single entry showing only demographic data (age, personal history, prior surgery, and hormone replacement therapy) and BI-RADS assessment category was entered. If an image had more than one reported finding with only one of them being cancer, we considered the other findings as false positives. Throughout our manuscript, the term “finding” will be used to denote the single record for normal mammograms or each record denoting an abnormality on a mammogram. Both radiologists (for mammography findings) and technologists (for demographic data) used PenRad® (Minnetonka, Minn) mammography reporting/tracking data system, which records clinical data in a structured format (i.e., point-and-click entry of information populates the clinical report and the database simultaneously). We included all of the demographic risk factors and BI-RADS descriptors in our ANN model that were routinely collected in the practice and predictive of breast cancer (Table 2). We obtained the reading radiologist information by merging the PenRad® data with the radiology information system at the Medical College of Wisconsin. We could not assign 504 findings to a radiologist during our matching protocol. We elected to keep these unassigned findings in our dataset to maintain its consecutive nature.
Table 2.
Variables from the NMD used in our ANN
| Variables | Instances |
|---|---|
| Age | Age M< 45, Age 45-50, Age 51-54, Age 55-60, Age 61-64, > 65 |
| Hormone Therapy | None, Less than 5 years, More than 5 years |
| Personal History of BCA | No, Yes |
| Family History of BCA | None, Minor (non-first-degree family members), Major (1 or more first-degree family members) |
| Breast Density | Predominantly Fatty, Scattered Fibroglandular, Heterogeneously Dense, Extremely Dense |
| Mass Shape | Circumscribed, Ill-defined, Microlobulated, Spiculated, Not present |
| Mass Stability | Decreasing, Stable, Increasing, Not present |
| Mass Margins | Oval, Round, Lobular, Irregular, Not present |
| Mass Density | Fat, Low, Equal, High, Not present |
| Mass Size | None, Small (< 3 cm), Large (≥ 3 cm) |
| Lymph Node | Present, Not Present |
| Asymmetric Density | Present, Not Present |
| Skin Thickening | Present, Not Present |
| Tubular Density | Present, Not Present |
| Skin Retraction | Present, Not Present |
| Nipple Retraction | Present, Not Present |
| Skin Thickening | Present, Not Present |
| Trabecular Thickening | Present, Not Present |
| Skin Lesion | Present, Not Present |
| Axillary Adenopathy | Present, Not Present |
| Architectural distortion | Present, Not Present |
| Prior history of surgery | No, Yes |
| Post-operative Change | No, Yes |
| Calc_Popcorn | Present, Not Present |
| Calc_Milk | Present, Not Present |
| Calc_RodLike | Present, Not Present |
| Calc_Eggshell | Present, Not Present |
| Calc_Dystrophic | Present, Not Present |
| Calc_Lucent | Present, Not Present |
| Calc_Dermal | Present, Not Present |
| Calc_Round | Scattered, Regional, Clustered, Segmental, Linearductal |
| Calc_Punctate | Scattered, Regional, Clustered, Segmental, Linearductal |
| Calc_Amorphous | Scattered, Regional, Clustered, Segmental, Linearductal |
| Calc_Pleomorphic | Scattered, Regional, Clustered, Segmental, Linearductal |
| Calc_FineLinear | Scattered, Regional, Clustered, Segmental, Linearductal |
| BI-RADS category | 0, 1, 2, 3, 4, 5 |
Note.—BCA = Breast cancer
Calc = microcalcification.
We analyzed discrimination and calibration accuracy at the finding level because this is the level at which recall and biopsy decisions are made in clinical practice. We believe this is the level at which computer-assisted models will help radiologists improve performance. However, because conventional analysis of mammographic data is at the mammogram level (where findings from a single study are combined), we also calculated the cancer detection rate, the early-stage cancer detection rate, and the abnormal interpretation rate at the mammogram level for comparison. We specify whether analyses in this study are based on mammograms or findings.
Data obtained from the Wisconsin Cancer Reporting System (WCRS), a statewide cancer registry, was used as our reference standard. The WCRS has been collecting information from hospitals, clinics, and physicians since 1978. The WCRS records demographic information, tumor characteristics (e.g., date of diagnosis, primary site, stage of disease), and treatment information for all newly diagnosed breast cancers in the state. Under data exchange agreements, out-of-state cancer registries also provide reports on Wisconsin residents diagnosed in their states. Findings that had matching registry reports of ductal carcinoma in situ or any invasive carcinoma within 12 months of a mammogram date were considered positive. Findings shown to be benign by biopsy or without a registry match within the same time period were considered negative.
Model
We built a three-layer feed-forward neural network using Matlab 7.4 (Matlab, The Mathworks, Natick, MA) with a backpropagation learning algorithm46 to estimate the likelihood of malignancy. The layers included an input layer of 36 discrete variables (mammographic descriptors, demographic factors and BI-RADS final assessment categories as entered by the radiologists) (Table 2), a hidden layer with 1000 hidden nodes, and an output layer with a single node generating the probability of malignancy for each finding. We designed our ANN to have a large number of hidden nodes, because ANNs with a large number of hidden nodes generalize better than networks with small number of hidden nodes when trained with backpropagation and “early stopping” (see “Discussion”).47-49
To train and test our ANN, we used a standard machine learning method called ten-fold cross validation, which ensures that a test sample is never used for training. In ten-fold cross validation, the data was divided into ten subsets that were approximately equal in size. In the first iteration, nine of these subsets were combined and used for training. The remaining tenth set was used for testing the performance of our ANN on unseen cases. We repeated this process for ten iterations until all subsets were used once for testing. In addition to ten-fold cross validation, to assess the robustness of our ANN, we did the following supplementary analyses: a) we trained our ANN on the first half of the dataset and tested on the second half, b) we trained our ANN on the second half of the dataset and tested on the first half.
We used “early stopping (ES)” procedure to prevent our ANN from “overfitting” and keep it generalizible to future cases.50, 51 Generalizability is the ability of a model to demonstrate similar predictive performance on data not used for training, but consisting of unseen cases from the same population. A model lacks generalizability when overfitting occurs, a phenomenon whereby the model “memorizes” the cases in the training data but fails to generalize to new data. When overfitting occurs, ANNs obtain spuriously good performance by learning anomalous patterns unique to the training set but generates high error resulting in low accuracy when presented with unseen data.52 We performed ES using a validation (tuning) set, in addition to training and testing set, to calculate the network error during training and to stop training early if necessary to prevent overfitting.50-52
Model evaluation
We evaluated the discriminative ability of our ANN against radiologists at an aggregate level and individual radiologist level. We plotted the ROC curve for our ANN using the probabilities generated for all findings via ten-fold cross validation technique. We constructed the ROC curves for all radiologists individually and in aggregate using BI-RADS assessment categories assigned by the radiologists to each finding. We ordered BI-RADS assessment categories by the increasing likelihood of malignancy (1<2<3<0<4<5) for this purpose. We measured AUC, sensitivity, and specificity to assess the discriminative ability of our ANN and the radiologists (in aggregate and individually). We used two-tailed DeLong's method53 to measure and compare AUCs because it accounts for correlation between the ROC curves obtained from the same data.
We calculated sensitivity and specificity of our ANN and the radiologists at recommended levels of performance: sensitivity at a specificity of 90% and specificity at a sensitivity of 85%, as they represent the minimal performance thresholds for screening mammography.54 When calculating the sensitivity and specificity of the radiologists, we considered BI-RADS 0, 4, 5 positive while BI-RADS 1, 2, 3 were designated negative.45 We used one-tailed McNemar's test to compare sensitivity and specificity between the radiologists and our ANN.55 McNemar's test accounts for correlation between the sensitivity and specificity ratios and is not defined when the ratios are equal, nor when one of the ratios is 0 or 1. We used Wilson's method to generate confidence intervals for sensitivity and specificity.56 We considered P < 0.05 to be the level of statistical significance.
We assessed the calibration of our ANN by calculating the Hosmer–Lemeshow (H-L) goodness-of-fit statistic57 and plotting a calibration curve. The H-L statistic compares the observed and predicted risk within risk categories. A lower H-L statistic and a higher P value (P > 0.05) indicate better calibration. For the H-L statistic, the predicted risks of findings were rank-ordered and divided into ten groups, based on their predicted probability. Within each predicted risk group, the number of predicted malignancies was accumulated against the number of observed malignancies. The H-L statistic was calculated from this 2 × 10 contingency table. The H-L statistic was then compared with the chi-square distribution, with degrees of freedom equal to 8. We also plotted a calibration curve to visually compare calibration of our ANN to the perfect calibration in predicting breast malignancy risk. In a calibration curve, a line at a 45° angle (line of identity) indicates perfect calibration. Data points to the right of the perfect calibration line represent overestimation of the risk, and those to the left of the line represent underestimation.58 Although a calibration curve does not provide a quantitative measure of reliability for probability predictions, it provides a graphical representation of the degree to which predicted probability of malignancy by our ANN corresponds to actual prevalence.58, 59 The calibration curve shows the ability of the model to enable prediction of probabilities across all ranges of risk.
Results
After matching to the cancer registry, our final matched dataset contained a total of 62,219 findings: 510 (0.8 %) were malignant and 61,709 (99.2 %) were benign, in 18,269 patients: 17,924 female and 345 male. The mean age of the female patients was 56.5 years (range = 17.7-99.1, SD = 12.7). Women were, on average, two years younger compared with men, whose mean age was 58.5 years (range = 18.6-88.5, SD = 15.7).
Our analysis at the mammogram level showed that 14% of the mammographic abnormalities occurred predominantly in fatty tissue, 41% in scattered fibroglandular tissue, 36% in heterogeneously dense tissue and 9% in extremely dense tissue (Table 1). At the findings level, the cancers included 246 masses, 121 microcalcifications, 27 asymmetries, 18 architectural distortions, 86 combinations of findings, and 12 other.
Cancer registries revealed a detection rate of 8.9 cancers per 1000 mammograms for the radiologists at the mammogram level (432 cancers for 48,744 mammograms—33 patients had more than one cancer resulting in 510 total cancers). The abnormal interpretation rate (considering BI-RADS 0, 4 and 5 abnormal) was 18.5 % (9,037 of 48,744 mammograms). Of all the 432 cancers, 390 had staging information from the cancer registry and 42 did not. Of the detected cancers with staging information, only 26.7% (104/390) had lymph node metastasis and 71% (277/390) were early stage (i.e. stage 0 or 1).
Following training and testing using ten-fold cross validation, the AUC of our ANN, 0.965, was significantly higher than that of the radiologists in aggregate, 0.939 (P < .001), at the finding level, which implied that our ANN performed better than the radiologists alone in discriminating between benign and malignant findings. The ROC curve of our ANN (aggregate level) dominated the combined ROC curve of all radiologists at all cut-off thresholds (Figure 1). This trend was preserved when the ANN was trained on the first half of the dataset and tested on the second half (ANN AUC = 0.949, radiologists AUC = 0.926, P < .001) or when trained on the second half of the dataset and tested on the first half (ANN AUC = 0.966, radiologists AUC = 0.951, P < .001). At the individual radiologists level, four out of eight comparisons were not statistically significant (Table 3). Of the four significant differences, our ANN outperformed the radiologists in all except a single, low-volume reader (radiologist 8, Table 3).
Figure 1.
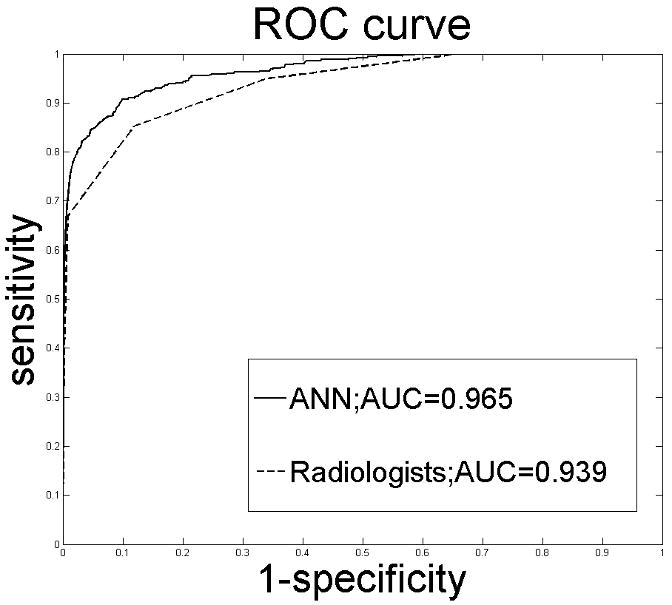
ROC curves constructed from the output probabilities of our ANN and the radiologists' BI-RADS assessment categories. AUC = Area under the ROC curve.
Table 3.
Comparison of Radiologist and ANN AUCs
| Rad No. | # of Benign Findings | # of Malignant Findings | Cancer Prevalence | Radiologist AUC | ANN AUC | P Value |
|---|---|---|---|---|---|---|
| 1 | 3312 | 77 | 0.0227 | 0.954 | 0.956 | 0.607 |
| 2 | 47 | 1 | 0.0208 | 0.777 | 1 | <.001 |
| 3 | 18953 | 180 | 0.0094 | 0.928 | 0.969 | <.001 |
| 4 | 26690 | 171 | 0.0064 | 0.936 | 0.969 | <.001 |
| 5 | 82 | 0 | 0 | ND | ND | ND |
| 6 | 6796 | 36 | 0.0053 | 0.954 | 0.955 | 0.903 |
| 7 | 3637 | 29 | 0.0079 | 0.931 | 0.941 | 0.416 |
| 8 | 1695 | 9 | 0.0053 | 0.940 | 0.873 | 0.005 |
| Unassigned | 497 | 7 | 0.0139 | 0.995 | 0.998 | 0.305 |
| Total | 61709 | 510 | 0.0081 | 0.939 | 0.965 | <.001 |
Note.—ND = not defined.
At a specificity of 90%, the sensitivity of our ANN was significantly better (90.7% vs. 82.2%, P < .001) than that of the radiologists (in aggregate) (Table 4). Our ANN identified 44 more cancers as compared to the radiologists at this level of specificity (Table 5a). At a fixed sensitivity of 85%, the specificity of our ANN was also significantly better (94.5% vs. 88.2%, P < .001) than that of the radiologists (in aggregate) (Table 4). Our ANN decreased the number of false positives by 3,941 when compared to the radiologists' performance at this level of sensitivity (Table 5b). In terms of specificity, all statistically significant comparisons revealed the ANN to be superior with the exception of one low volume reader (radiologist 8 in Table 4). In terms of sensitivity, all statistically significant comparisons revealed the ANN to be superior; however, one low volume reading radiologist demonstrated the opposite trend (radiologist 1 in Table 4).
Table 4.
Comparison of Radiologist and ANN Sensitivity and Specificity
| Rad No. | # of Benign Findings | # of Malignant Findings | Radiologist Sensitivity †‡ | ANN Sensitivity †‡ | P Value* | Radiologist Specificity †§ | ANN Specificity†§ | P Value* |
|---|---|---|---|---|---|---|---|---|
| 1 | 3312 | 77 | 93.5 (84.8, 97.6) | 88.4 (78.4,94.1) | 0.0625 | 94.4 (93.6, 95.2) | 96.9 (96.4, 97.5) | <.001 |
| 2 | 47 | 1 | Φ | Φ | Φ | Φ | Φ | Φ |
| 3 | 18953 | 180 | 78.3 (71.4, 83.9) | 90.0 (84.5, 93.8) | <.001 | 85.0 (84.4, 85.5) | 95.0 (94.7, 95.3) | <.001 |
| 4 | 26690 | 171 | 82.4 (75.7, 87.6) | 93.0 (87.8, 96.1) | <.001 | 85.6 (85.1, 86.0) | 96.4 (96.1, 96.5) | <.001 |
| 5 | 82 | 0 | Φ | Φ | Φ | Φ | Φ | Φ |
| 6 | 6796 | 36 | 83.3 (66.5, 93.0) | 86.1 (69.7, 94.7) | 0.999 | 88.4 (87.6, 89.1) | 94.5 (93.9, 95.0) | <.001 |
| 7 | 3637 | 29 | 75.8 (56.0, 88.9) | 72.5 (52.5, 86.5) | 0.999 | 79.9 (78.6, 81.2) | 86.2 (85.0, 87.2) | <.001 |
| 8 | 1695 | 9 | 77.7 (40.1, 96.0) | 66.7 (30.9, 90.9) | 0.999 | 86.7 (85.0, 88.3) | 80.7 (78.7, 82.5) | <.001 |
| Unassigned¥ | 497 | 7 | 100.0 (56.1, 100.0) | 100.0 (56.1, 100.0) | ND | 98.3 (96.7, 99.2) | 99.6 (98.4, 99.9) | 0.015 |
| Total | 61709 | 510 | 82.2 (78.5, 85.3) | 90.7 (87.8, 93.0) | <.001 | 88.2 (87.9, 88.5) | 94.5 (94.3, 94.6) | <.001 |
Note. —ND = not defined (McNemar's test cannot be computed when the ratio is 1).
Numbers too small to obtain reliable performance.
Data in parentheses are 95% confidence intervals.
Calculated with McNemar's test.
Sensitivity calculated at a specificity of 90%.
Specificity calculated at a sensitivity of 85%.
Unassigned mammographic studies resulting from inability to match studies with radiologists when merging mammography reporting system and institutional radiology information system.
Table 5.
| Table 5a: Performance at 90% specificity | ||
|---|---|---|
| True Positive | False Negative | |
| Radiologists | 419 (400-435) | 91 (75-110) |
| ANN | 463 (449-475) | 47 (36-62) |
| Table 5b: Performance at 85% sensitivity | ||
|---|---|---|
| False Positive | True Negative | |
| Radiologists | 7,282 (7,126-7,441) | 54,427 (54,268-54,583) |
| ANN | 3,341 (3,232-3,454) | 58,368 (58,256-58,477) |
Note.—Data are numbers (95% CIs) of cases.
The H-L statistic for our ANN was 12.46 (P = 0.13, df = 8). The precision of the predicted probabilities is shown graphically in Figure 2. Although the calibration curve of our ANN does not perfectly match the line of identity (the line at 45° angle), the deviation is pictorially minimal.
Figure 2.

Calibration curve of our ANN (solid line) and the curve representing perfect calibration (dashed line). This is a plot of the actual prevalence of malignancy versus estimated risk of malignancy for each decile of the probability scale.
Discussion
We demonstrate that our ANN can accurately estimate the risk of breast cancer using a dataset containing demographic data and prospectively-collected mammographic findings. To our knowledge, this study uses one of the largest dataset of mammography findings to develop a CADx model. Our results demonstrate that ANNs may have the potential to aid radiologists in discriminating benign and malignant breast diseases. When we compare discriminative accuracy using AUC, sensitivity, and specificity, our ANN performs significantly better than all radiologists in aggregate. Although the difference between the AUCs of the radiologists and our ANN may appear to be small (0.026), this difference is both statistically (P <.001) and clinically significant because our ANN identified 44 more cancers and decreased the number of false positives by 3,941 when compared to the radiologists at the specified sensitivity and specificity values. Note that the results would be similar for any other specified sensitivity and specificity values, because the ROC curve of our ANN outperforms that of the radiologists at all threshold levels. On the other hand, the reason for obtaining a numerically small difference between the AUCs relates to the disproportionate number of benign findings (61,709) compared to malignant findings (510) in our dataset resulting in very high specificity at baseline and little room for improvement in this parameter.
Among statistically significant comparisons, our ANN demonstrates superior AUC, sensitivity, and specificity versus all but one radiologist, including the two highest- volume readers. Therefore, similar to other ANN models presented in the literature, our ANN has the potential to aid radiologists in classifying (discriminating) findings on mammograms by predicting the risk of malignancy. When compared to the previous CADx models developed by our research team (an LR and a BN), the discrimination performance of our ANN was slightly higher (ANN AUC = 0.965, LR AUC = 0.963, BN AUC = 0.960). On the other hand, no statistically significant difference was found between the ANN and LR (P = 0.57), or the ANN and BN (P = 0.13).
However, our model is unique in several ways. In contrast to prior ANN models, which used a relatively small selected population of suspicious findings undergoing tissue sampling with biopsy as the reference standard,30, 31, 35-37, 39 we use a large consecutive dataset of mammography findings with tumor registry outcomes as the reference standard to train our ANN. Furthermore, contrary to previously developed CADx models in breast cancer risk prediction, we expand the evaluation of CADx models beyond discrimination by measuring the accuracy of the estimated probabilities themselves using calibration metrics.
Although discrimination or accurate classification is of primary interest for CADx models,11, 60 calibration is also critical, especially when clinical decisions are being made for individual patients.11, 61 Individual decisions are made under uncertainty and therefore aided more effectively by accurate risk estimates. Because there is a trade-off between discrimination and calibration,10 the selection of the primary performance measure should be based on the intended purpose of the model.11 In this study, similar to previous CADx models, we designed our ANN primarily for optimizing the discrimination ability. However, contrary to previous CADx studies, we also measured the calibration as the secondary objective. We showed that our ANN is well-calibrated, as demonstrated by the low value of the H-L statistic, the corresponding high P value, and the favorable calibration curve; and thus can accurately estimate the risk of malignancy for individual patients. The ability of our ANN to assign accurate numeric probabilities is an important complement to its ability to discriminate between the ultimate outcomes.61
We posit that the good calibration of our ANN is attributable to both the characteristics of our training set and attributes of our model. For example, the consecutive nature of our dataset of mammography findings and the use of a tumor registry match as a reference standard which reflects a real-world population may lead to accurate calibration. In addition, using a large number of hidden nodes in concert with training with a validation set to prevent overfitting may have enhanced calibration. We plan to analyze which parameters most profoundly influence calibration in future work.
CADx models for breast cancer risk estimation have typically been developed and evaluated based on the discrimination ability and have ignored calibration.31-39 Although calibration has not been formally assessed in previous CADx models, there is some evidence that these models are not well-calibrated.31, 35, 42 Poor calibration may indicate that these models are not optimized for individual cases, i.e. the predicted breast cancer risk for a single patient may be incorrect.
From a clinical standpoint, our ANN may be valuable because it provides an accurate post-test probability for malignancy. This post-test probability may be useful for communication between the radiologist, patient, and referring physician which in turn may encourage shared decision-making.5-7 Each individual patient has a unique risk tolerance and co-morbidities to weigh in the decisions involving mammographic abnormalities. Risk assessments based on individual characteristics may also help promote the concept of personalized care in the diagnosis of breast cancer. Furthermore, our ANN is designed to increase the effectiveness of mammography by aiding radiologists, not act as a substitute. Our ANN quantifies the risk of breast cancer using mammographic features assessed by the radiologist, so its performance depends largely on the radiologist's accurate observations and overall assessment (BI-RADS category).
Our ANN has the potential to be used as a decision support tool though it may face similar challenges that have prevented the translation of effective decision support algorithms to clinical practice in the past. In order to be used in the clinic, a decision support tool must be seamlessly integrated into the clinical workflow, which can be challenging. We believe in the case of mammography, a decision support tool would be most useful if directly linked to structured reporting software that radiologists use in daily practice, which would enable immediate feedback. On the other hand, the good performance of our ANN might not be preserved after the integration into clinical practice. Before clinical integration, it is important to consider the ways our ANN might fail, both due to inherent theoretical limitations and due to errors that might occur during the process of integration.62 In fact, numerous computer-aided diagnostic models that performed well in evaluation studies did not make an impact on clinical practice.63-68 Furthermore, the optimal performance of our ANN would be required to gain the trust of clinicians in order to influence clinical practice. Unfortunately, the parameters of ANNs do not carry any real-life interpretation and clinicians have trouble trusting decision support algorithms that represent a “black box” without explanation capabilities. Although there are rule extraction softwares that convert a trained ANN to a more human-understandable representation,69-71 integration of these softwares with the ANN requires extra effort. Therefore, we recognize that substantial challenges remain in the translation of ANNs for use in decision support at the point of care and emphasize the importance of these issues for future research and implementation.
There are three important implementation considerations. First, determining the number of effective hidden nodes in an ANN is critical and may significantly affect the output performance. Unfortunately, there is no general rule to determine the effective number of hidden nodes that maximizes the network performance when presented to an unseen dataset (generalizability).47 Although “the conventional wisdom is that neural networks with excess hidden units generalize poorly,”48 several recent studies in the machine learning literature have shown that ANNs with excess capacity (i.e. with large number of hidden nodes) generalize better than small networks (i.e. networks with small number of hidden nodes) when trained with backpropagation and early stopping.47-49 Therefore, we have built an ANN with excess capacity and did not optimize the number of hidden nodes. Also, note that if we optimized the number of hidden nodes that maximizes the AUC as done in many previous studies in the medical literature, we would achieve even a higher AUC than reported here.
Second, selection of the primary performance measure is also critical when building an ANN model. In our study, we built our ANN principally to maximize the discrimination accuracy because discrimination is of primary interest to optimize accurate diagnosis.11, 60 On the other hand, ANNs might also be trained for maximizing the calibration when the primary purpose is to stratify individuals into higher or lower risk categories of clinical importance. However, it should be noted that for a direct maximization of calibration, the estimated probabilities by the ANN should be compared to the “true underlying probabilities,”72 which are seldom explicitly known. Alternatively, it is possible to adjust, if not maximize, the model calibration using some advanced methods, called “recalibration.”72 The use of recalibration methods is beyond the scope of this paper and left for future research.
Third, the way we handle BI-RADS 0 findings deserves attention. We generated risk estimates for BI-RADS 0 instead of combining these results with subsequent imaging findings. In clinical practice, it is important to know the probability of cancer for BI-RADS 0 cases in order to make appropriate patient management decisions. Furthermore, the risk estimate for a BI-RADS 0 finding contains much more uncertainty than when the additional imaging information is available. We hope to model this uncertainty in future work in order to understand the value of additional information. For this reason, we consider BI-RADS 0 as positive mammogram24, 45, 73 and an appropriate time for risk estimation because we have the potential to: 1) ameliorate anxiety that naturally arises at this juncture and 2) to improve decision-making performance.
Our study has limitations. First, our ANN is built on a mix of screening and diagnostic examinations which cannot be reliably separated. Specifically, we do not know the proportion of diagnostic examinations in our dataset, which may influence performance.74 However, this concern is mitigated by the fact that we are using a consecutive dataset that likely reflects an ACR accredited mammography practice that is comparable to similar settings. Second, our data set contains a substantial amount of unpopulated fields. Radiologists do not systematically attempt to note the absence of all findings on mammography—they simply leave them blank. Obviously, our results depend entirely on the quality of the structured data. We labeled all missing descriptors as “not present.” Our approach is appropriate for mammography data where radiologists often leave the descriptors blank if nothing is observed on the mammogram. Third, we assume that our cancer registry is a completely accurate reference standard. While cancer registries are generally accurate with respect to cancer diagnosis75, 76 and represent the best method to identify cancer cases,76 our cancer registry may not be perfect. However, the WCRS is an accredited cancer registry making it unlikely that expected errors would substantively affect our results or conclusions. Finally, our comparison of ROC curves between the radiologists and our ANN is suboptimal. Specifically, we construct the radiologists' ROC curve using BI-RADS categories and our ANN's ROC curve using probabilities. While similar analysis has been presented in the literature,24 this is not a perfectly equal comparison. These concerns are partially ameliorated in our work by the fact that the performance of our ANN is superior to the radiologists at all threshold levels.
In conclusion, we built our ANN using standardized demographic risk factors and mammographic findings which performed well in terms of both discrimination and calibration. While future work will be required to determine whether this performance is primarily attributable to both the characteristics of our training set or attributes of our model itself, we are encouraged that an ANN can achieve good performance in both realms. While ROC curve analysis is valuable to evaluate the discriminative ability of CADx models, calibration would be another important measure for evaluating models that predict risks for individual patients. These promising results may indicate that ANNs have the potential to help radiologists improve mammography interpretation.
Acknowledgments
This research is funded by NIH grants R01CA127379, K07CA114181, and R21CA129393.
Footnotes
No financial disclosures from any authors.
References
- 1.Giger ML. Computer-aided diagnosis in radiology. Acad Radiol. 2002;9(1):18–25. doi: 10.1016/s1076-6332(03)80289-1. [DOI] [PubMed] [Google Scholar]
- 2.Kahneman D, Slovic P, Tversky A. Judgment under uncertainty: heuristics and biases. Cambridge: Cambridge University Press; 2001. [Google Scholar]
- 3.Smith-Bindman R, Chu PW, Miglioretti DL, Sickles EA, Blanks R, Ballard-Barbash R, et al. Comparison of screening mammography in the United States and the United Kingdom. JAMA. 2003;290(16):2129–37. doi: 10.1001/jama.290.16.2129. [DOI] [PubMed] [Google Scholar]
- 4.Elmore JG, Wells CK, Lee CH, Howard DH, Feinstein AR. Variability in radiologists' interpretations of mammograms. N Engl J Med. 1994;331(22):1493–9. doi: 10.1056/NEJM199412013312206. [DOI] [PubMed] [Google Scholar]
- 5.Chan ECY. Promoting an ethical approach to unproven screening imaging tests. Journal of the American College of Radiology. 2005;2(4):311–20. doi: 10.1016/j.jacr.2004.09.012. [DOI] [PubMed] [Google Scholar]
- 6.Hillman BJ. Informed and shared decision making: an alternative to the debate over unproven screening tests. Journal of the American College of Radiology. 2005;2(4):297–98. doi: 10.1016/j.jacr.2005.01.003. [DOI] [PubMed] [Google Scholar]
- 7.Picano E. Informed consent and communication of risk from radiological and nuclear medicine examinations: how to escape from a communication inferno. BMJ: British Medical Journal. 2004;329:849–51. doi: 10.1136/bmj.329.7470.849. [DOI] [PMC free article] [PubMed] [Google Scholar]
- 8.Harrell FE. Regression modeling strategies. With applications to linear models, logistic regression and survival analysis. New York: Springer; 2001. [Google Scholar]
- 9.Ikeda M, Ishigaki T, Yamauchi K. Relationship between Brier score and area under the binormal ROC curve. Comput Methods Programs Biomed. 2002;67(3):187–94. doi: 10.1016/s0169-2607(01)00157-2. [DOI] [PubMed] [Google Scholar]
- 10.Cook NR. Use and misuse of the receiver operating characteristic curve in risk prediction. Circulation. 2007;115(7):928–35. doi: 10.1161/CIRCULATIONAHA.106.672402. [DOI] [PubMed] [Google Scholar]
- 11.Cook NR. Statistical evaluation of prognostic versus diagnostic models: beyond the ROC curve. Clin Chem. 2008;54(1):17–23. doi: 10.1373/clinchem.2007.096529. [DOI] [PubMed] [Google Scholar]
- 12.Birdwell R, Bandodkar P, Ikeda D. Computer-aided detection with screening mammography in a university hospital setting. Radiology. 2005;236(2):451–57. doi: 10.1148/radiol.2362040864. [DOI] [PubMed] [Google Scholar]
- 13.Cupples TE, Cunningham JE, Reynolds JC. Impact of computer-aided detection in a regional screening mammography program. AJR Am J Roentgenol. 2005;185(4):944–50. doi: 10.2214/AJR.04.1300. [DOI] [PubMed] [Google Scholar]
- 14.Dean JC, Ilvento CC. Improved cancer detection using computer-aided detection with diagnostic and screening mammography: prospective study of 104 cancers. AJR Am J Roentgenol. 2006;187(1):20–8. doi: 10.2214/AJR.05.0111. [DOI] [PubMed] [Google Scholar]
- 15.Fenton JJ, Taplin SH, Carney PA, Abraham L, Sickles EA, D'Orsi C, et al. Influence of computer-aided detection on performance of screening mammography. N Engl J Med. 2007;356(14):1399–409. doi: 10.1056/NEJMoa066099. [DOI] [PMC free article] [PubMed] [Google Scholar]
- 16.Hadjiiski L, Sahiner B, Helvie MA, Chan HP, Roubidoux MA, Paramagul C, et al. Breast masses: computer-aided diagnosis with serial mammograms. Radiology. 2006;240(2):343–56. doi: 10.1148/radiol.2401042099. [DOI] [PubMed] [Google Scholar]
- 17.Chan HP, Sahiner B, Helvie MA, Petrick N, Roubidoux MA, Wilson TE, et al. Improvement of radiologists' characterization of mammographic masses by using computer-aided diagnosis: an ROC study. Radiology. 1999;212(3):817–27. doi: 10.1148/radiology.212.3.r99au47817. [DOI] [PubMed] [Google Scholar]
- 18.Huo Z, Giger ML, Vyborny CJ, Metz CE. Breast cancer: effectiveness of computer-aided diagnosis observer study with independent database of mammograms. Radiology. 2002;224(2):560–8. doi: 10.1148/radiol.2242010703. [DOI] [PubMed] [Google Scholar]
- 19.Kallergi M. Computer-aided diagnosis of mammographic microcalcification clusters. Med Phys. 2004;31(2):314–26. doi: 10.1118/1.1637972. [DOI] [PubMed] [Google Scholar]
- 20.Jiang Y, Nishikawa RM, Schmidt RA, Metz CE. Comparison of independent double readings and computer-aided diagnosis (CAD) for the diagnosis of breast calcifications. Acad Radiol. 2006;13(1):84–94. doi: 10.1016/j.acra.2005.09.086. [DOI] [PubMed] [Google Scholar]
- 21.Gail MH, Brinton LA, Byar DP, Corle DK, Green SB, Schairer C, et al. Projecting individualized probabilities of developing breast cancer for white females who are being examined annually. J Natl Cancer Inst. 1989;81(24):1879–86. doi: 10.1093/jnci/81.24.1879. [DOI] [PubMed] [Google Scholar]
- 22.Claus EB, Risch N, Thompson WD. Genetic analysis of breast cancer in the cancer and steroid hormone study. Am J Hum Genet. 1991;48(2):232–42. [PMC free article] [PubMed] [Google Scholar]
- 23.Claus EB, Risch N, Thompson WD. Autosomal dominant inheritance of early-onset breast cancer. Implications for risk prediction. Cancer. 1994;73(3):643–51. doi: 10.1002/1097-0142(19940201)73:3<643::aid-cncr2820730323>3.0.co;2-5. [DOI] [PubMed] [Google Scholar]
- 24.Barlow WE, White E, Ballard-Barbash R, Vacek PM, Titus-Ernstoff L, Carney PA, et al. Prospective breast cancer risk prediction model for women undergoing screening mammography. J Natl Cancer Inst. 2006;98(17):1204–14. doi: 10.1093/jnci/djj331. [DOI] [PubMed] [Google Scholar]
- 25.Freedman AN, Seminara D, Gail MH, Hartge P, Colditz GA, Ballard-Barbash R, et al. Cancer risk prediction models: a workshop on development, evaluation, and application. J Natl Cancer Inst. 2005;97(10):715–23. doi: 10.1093/jnci/dji128. [DOI] [PubMed] [Google Scholar]
- 26.Freer T, Ulissey M. Screening mammography with computer-aided detection: prospective study of 12,860 patients in a community breast center. Radiology. 2001;220(3):781–86. doi: 10.1148/radiol.2203001282. [DOI] [PubMed] [Google Scholar]
- 27.Morton MJ, Whaley DH, Brandt KR, Amrami KK. Screening mammograms:interpretation with computer-aided detection--prospective evaluation. Radiology. 2006;239(2):375–83. doi: 10.1148/radiol.2392042121. [DOI] [PubMed] [Google Scholar]
- 28.Gur D, Wallace LP, Klym AH, Hardesty LA, Abrams GS, Shah R, et al. Trends in recall, biopsy, and positive biopsy rates for screening mammography in an academic practice. Radiology. 2005;235(2):396–401. doi: 10.1148/radiol.2352040422. [DOI] [PubMed] [Google Scholar]
- 29.Vyborny CJ, Giger ML, Nishikawa RM. Computer-aided detection and diagnosis of breast cancer. Radiol Clin North Am. 2000;38(4):725–40. doi: 10.1016/s0033-8389(05)70197-4. [DOI] [PubMed] [Google Scholar]
- 30.Baker J, Kornguth P, Lo J, Floyd C., Jr Artificial neural network: improving the quality of breast biopsy recommendations. Radiology. 1996;198(1):131–5. doi: 10.1148/radiology.198.1.8539365. [DOI] [PubMed] [Google Scholar]
- 31.Baker J, Kornguth P, Lo J, Williford M, Floyd C., Jr Breast cancer: prediction with artificial neural network based on BI-RADS standardized lexicon. Radiology. 1995;196(3):817–22. doi: 10.1148/radiology.196.3.7644649. [DOI] [PubMed] [Google Scholar]
- 32.Burnside ES. Bayesian networks: computer-assisted diagnosis support in radiology. Acad Radiol. 2005;12(4):422–30. doi: 10.1016/j.acra.2004.11.030. [DOI] [PubMed] [Google Scholar]
- 33.Burnside ES, Davis J, Chhatwal J, Alagoz O, Geller BM, Littenberg B, et al. A Probabilistic computer model developed from clinical data in the national mammography database format to classify mammography findings. Radiology. 2009;251(3):663–72. doi: 10.1148/radiol.2513081346. [DOI] [PMC free article] [PubMed] [Google Scholar]
- 34.Chhatwal J, Alagoz O, Lindstrom MJ, Kahn CE, Shaffer KA, Burnside ES. A logistic regression model based on the national mammography database format to aid breast cancer diagnosis. AJR Am J Roentgenol. 2009;192(4):1117–27. doi: 10.2214/AJR.07.3345. [DOI] [PMC free article] [PubMed] [Google Scholar]
- 35.Floyd C, Jr, Lo J, Yun A, Sullivan D, Kornguth P. Prediction of breast cancer malignancy using an artificial neural network. Cancer. 1994;74(11):2944–8. doi: 10.1002/1097-0142(19941201)74:11<2944::aid-cncr2820741109>3.0.co;2-f. [DOI] [PubMed] [Google Scholar]
- 36.Jiang Y, Nishikawa RM, Schmidt RA, Metz CE, Giger ML, Doi K. Improving breast cancer diagnosis with computer-aided diagnosis. Acad Radiol. 1999;6(1):22–33. doi: 10.1016/s1076-6332(99)80058-0. [DOI] [PubMed] [Google Scholar]
- 37.Lo JY, Baker JA, Kornguth PJ, Floyd CE., Jr Computer-aided diagnosis of breast cancer: artificial neural network approach for optimized merging of mammographic features. Acad Radiol. 1995;2(10):841–50. doi: 10.1016/s1076-6332(05)80057-1. [DOI] [PubMed] [Google Scholar]
- 38.Orr RK. Use of an artificial neural network to quantitate risk of malignancy for abnormal mammograms. Surgery. 2001;129(4):459–66. doi: 10.1067/msy.2001.112069. [DOI] [PubMed] [Google Scholar]
- 39.Wu Y, Giger M, Doi K, Vyborny C, Schmidt R, Metz C. Artificial neural networks in mammography: application to decision making in the diagnosis of breast cancer. Radiology. 1993;187(1):81–7. doi: 10.1148/radiology.187.1.8451441. [DOI] [PubMed] [Google Scholar]
- 40.Giger ML, Huo Z, Kupinski MA, Vyborny CJ. Computer-aided diagnosis in mammography. Handbook of Medical Imaging. 2000;2:917–86. [Google Scholar]
- 41.Gurney JW. Neural networks at the crossroads: caution ahead. Radiology. 1994;193(1):28–30. doi: 10.1148/radiology.193.1.8090906. [DOI] [PubMed] [Google Scholar]
- 42.Burnside ES, Rubin DL, Fine JP, Shachter RD, Sisney GA, Leung WK. Bayesian network to predict breast cancer risk of mammographic microcalcifications and reduce number of benign biopsy results: initial experience. Radiology. 2006;240(3):666–73. doi: 10.1148/radiol.2403051096. [DOI] [PubMed] [Google Scholar]
- 43.Sickles EA. Periodic mammographic follow-up of probably benign lesions: results in 3,184 consecutive cases. Radiology. 1991;179(2):463–8. doi: 10.1148/radiology.179.2.2014293. [DOI] [PubMed] [Google Scholar]
- 44.Osuch J, Anthony M, Bassett L, DeBor M, D'Orsi C, Hendrick R, et al. A proposal for a national mammography database: content, purpose, and value. AJR Am J Roentgenol. 1995;164(6):1329–34. doi: 10.2214/ajr.164.6.7754870. [DOI] [PubMed] [Google Scholar]
- 45.Breast Imaging Reporting And Data System (BI-RADS) 4th. Reston VA: American College of Radiology; 2004. [Google Scholar]
- 46.Rumelhart DE, Hinton EE, Williams RJ. Learning representations by back-propogating errors. Nature. 1986;323:533. [Google Scholar]
- 47.Weigend A. On overfitting and the effective number of hidden units. In: Mozer A, Smolensky P, Touretzky DS, Elman JL, Weigend AS, editors. Proceedings of the1993 Connectionist Models Summer School Hillsdale; NJ: Lawrence Erlbaum Associates; 1994. pp. 335–42. [Google Scholar]
- 48.Caruana R, Lawrence S, Giles CL. Overfitting in neural networks: backpropagation, conjugate gradient, and early stopping. In: Leen TK, Dietterich TG, Tresp V, editors. Advances in Neural Information Processing Systems. Vol. 13. Cambridge: MA: MIT Press; 2001. [Google Scholar]
- 49.Lawrence S, Giles CL, Tsoi AC. Lessons in neural network training: overfitting may be harder than expected. Proceedings of the Fourteenth National Conference on Artificial Intelligence; 1997; pp. 540–45. [Google Scholar]
- 50.Bishop CM. Neural networks for pattern recognition. New York: Oxford University Press; 1995. [Google Scholar]
- 51.Mitchell TM. Machine learning Burr Ridge. IL: McGraw Hill; 1997. [Google Scholar]
- 52.Haykin S. Neural networks: a comprehensive foundation. New Jersey: Prentice Hall; 1998. [Google Scholar]
- 53.DeLong ER, DeLong DM, Clarke-Pearson DL. Comparing the areas under two or more correlated receiver operating characteristic curves: a nonparametric approach. Biometrics. 1988;44(3):837–45. [PubMed] [Google Scholar]
- 54.Bassett LW, Hendrick RE, Bassford TL, Butler PF, Carter D, DeBor M. Public Health Service, US Department of Health and Human Services. Rockville, MD: Agency for Health Care Policy and Research; 1994. Quality determinants of mammography Clinical practice guideline No 13. [Google Scholar]
- 55.Rosner B. Two-sample test for binomial proportions for matched-pair data (McNemar's Test) In: Rosner B, editor. Fundamentals of biostatistics. 2000. pp. 376–84. [Google Scholar]
- 56.Agresti A, Coull BA. Approximate is better than exact for interval estimation of binomial proportions. Am Stat. 1998;52(2):119–26. [Google Scholar]
- 57.Hosmer DW, Lemeshow S. Applied logistic regression. New York: John Wiley & Sons; 2000. [Google Scholar]
- 58.Poses RM, Cebul RD, Centor RM. Evaluating physicians' probabilistic judgments. Med Decis Making. 1988;8(4):233–40. doi: 10.1177/0272989X8800800403. [DOI] [PubMed] [Google Scholar]
- 59.Diamond G. What price perfection? Calibration and discrimination of clinical prediction models. J Clin Epidemiol. 1992;45(1):85–9. doi: 10.1016/0895-4356(92)90192-p. [DOI] [PubMed] [Google Scholar]
- 60.Ohno-Machado L. Medical applications of artificial neural networks: connectionist models of survival. Stanford University; 1996. [Google Scholar]
- 61.Harrell FE, Jr, Lee KL, Matchar DB, Reichert TA. Regression models for prognostic prediction: advantages, problems, and suggested solutions. Cancer Treat Rep. 1985;69(10):1071–77. [PubMed] [Google Scholar]
- 62.Miller RA. Why the standard view is standard: people, not machines, understand patients' problems. Journal of Medicine and Philosophy. 1990;15(6):581–91. doi: 10.1093/jmp/15.6.581. [DOI] [PubMed] [Google Scholar]
- 63.Hickam DH, Shortliffe EH, Bischoff MB, Scott AC, Jacobs CD. The treatment advice of a computer-based cancer chemotherapy protocol advisor. Annals of Internal Medicine. 1985;103:928–36. doi: 10.7326/0003-4819-103-6-928. [DOI] [PubMed] [Google Scholar]
- 64.Masarie FE, Jr, Miller RA, Myers JD. INTERNIST-I properties: representing common sense and good medical practice in a computerized medical knowledge base. Comput and Biomed Res. 1985;18(5):458–79. doi: 10.1016/0010-4809(85)90022-9. [DOI] [PubMed] [Google Scholar]
- 65.Miller RA, Pople HE, Jr, Myers JD. Internist-I, an Experimental Computer-Based Diagnostic Consultant for General Internal Medicine. New England Journal of Medicine. 1982;307(8):468–76. doi: 10.1056/NEJM198208193070803. [DOI] [PubMed] [Google Scholar]
- 66.Shortliffe EH. Medical expert systems—knowledge tools for physicians. Western Journal of Medicine. 1986;145(6):830–39. [PMC free article] [PubMed] [Google Scholar]
- 67.Shortliffe EH, Davis R, Axline SG, Buchanan BG, Green CC, Cohen SN. Computer-based consultations in clinical therapeutics: explanation and rule acquisition capabilities of the MYCIN system. Computers and Biomedical Research. 1975;8(4):303–20. doi: 10.1016/0010-4809(75)90009-9. [DOI] [PubMed] [Google Scholar]
- 68.Yu VL, Buchanan BG, Shortliffe EH, Wraith SM, Davis R, Scott AC, et al. Evaluating the performance of a computer-based consultant. Computer Programs in Biomedicine. 1979;9(1):95. doi: 10.1016/0010-468x(79)90022-9. [DOI] [PubMed] [Google Scholar]
- 69.Craven MW, Shavlik JW. Extracting tree-structured representations of trained networks. Advances in neural information processing systems. 1996:24–30. [Google Scholar]
- 70.Nauck D, Klawonn F, Kruse R. Foundations of neuro-fuzzy systems. New York, NY: John Wiley & Sons, Inc.; 1997. [Google Scholar]
- 71.Setiono R, Liu H. Symbolic representation of neural networks. IEEE Computer. 1996;29(3):71–77. [Google Scholar]
- 72.Vinterbo S, Ohno-Machado L. Ph D thesis: Predictive models in medicine: some methods for construction and adaptation Norwegian University of Science and Technology. 1999. A recalibration method for predictive models with dichotomous outcomes. [Google Scholar]
- 73.Taplin S, Abraham L, Barlow WE, Fenton JJ, Berns EA, Carney PA, et al. Mammography facility characteristics associated with interpretive accuracy of screening mammography. J Natl Cancer Inst. 2008;100(12):876–87. doi: 10.1093/jnci/djn172. [DOI] [PMC free article] [PubMed] [Google Scholar]
- 74.Sohlich RE, Sickles EA, Burnside ES, Dee KE. Interpreting data from audits when screening and diagnostic mammography outcomes are combined. AJR Am J Roentgenol. 2002;178(3):681–6. doi: 10.2214/ajr.178.3.1780681. [DOI] [PubMed] [Google Scholar]
- 75.Bickell NA, Chassin MR. Determining the quality of breast cancer care: do tumor registries measure up? Annals of Internal Medicine. 2000;132(9):705–10. doi: 10.7326/0003-4819-132-9-200005020-00004. [DOI] [PubMed] [Google Scholar]
- 76.Malin JL, Kahn KL, Adams J, Kwan L, Laouri M, Ganz PA. Validity of cancer registry data for measuring the quality of breast cancer care. Journal of the National Cancer Institute. 2002;94(11):835–44. doi: 10.1093/jnci/94.11.835. [DOI] [PubMed] [Google Scholar]