

Abstract
Nitrogen is the only macronutrient that is commonly available to plants in both oxidized and reduced forms, mainly nitrate and ammonium. The physiological and molecular effects of nitrate supply have been well studied, but comparatively little is known about ammonium nutrition and its differential effects on cell function and gene expression. We have used a physiologically realistic hydroponic growth system to compare the transcriptomes and redox status of the roots of ammonium- and nitrate-supplied Arabidopsis thaliana plants. While ~60% of nitrogen-regulated genes displayed common responses to both ammonium and nitrate, significant “nitrate-specific” and “ammonium-specific” gene sets were identified. Pathways involved in cytokinin response and reductant generation/distribution were specifically altered by nitrate, while a complex biotic stress response and changes in nodulin gene expression were characteristic of ammonium-supplied plants. Nitrate supply was associated with a rapid decrease in H2O2 production, potentially due to an increased export of reductant from the mitochondrial matrix. The underlying basis of the nitrate- and ammonium-specific patterns of gene expression appears to be different signals elaborated from each nitrogen source, including alterations in extracellular pH that are associated with ammonium uptake, downstream metabolites in the ammonium assimilation pathway, and the presence or absence of the nitrate ion.
Keyword Index: Arabidopsis thaliana, Nitrogen, Nitrate, Ammonium, Redox balancing, Reactive oxygen species, Transcriptome
Introduction
Of the mineral nutrients required for plant growth, nitrogen is required in the largest amounts and is most often limiting. Nitrogen represents about 2% of plant dry weight, and is a structural component of proteins, nucleic acids, and many secondary metabolites (Miller and Cramer, 2005). Although some plant species are capable of fixing atmospheric nitrogen through symbiotic relationships with soil microbes, most plants rely on direct uptake of (primarily) inorganic forms of nitrogen from the soil. Unique among plant mineral nutrients, inorganic nitrogen is commonly available in both an oxidized form (nitrate, NO3−) and a reduced form (ammonium, NH4+). In most agricultural soils nitrate is the primary form of inorganic nitrogen, however in natural environments nitrogen form may be highly variable, with ammonium often predominant in acidic and/or waterlogged soils (Falkengren-Grerup, 1995; Herrera-Estrella, 1999). In addition, nitrate and ammonium distributions and concentrations may show substantial heterogeneity within a single soil type, even over very small areas (Jackson and Caldwell, 1993).
Virtually all plants are capable of utilizing either nitrate or ammonium as a nitrogen source, and possess dedicated transmembrane transporters for each form of nitrogen in root cells (Crawford and Forde, 2002). However, the assimilation of nitrate and ammonium place dramatically different demands on cellular reductant pools. When ammonium is taken up directly from the soil, it is generally transported to the root cell plastids and immediately assimilated into the amino acid glutamate by the glutamine synthetase/glutamate synthase pathway. In contrast, the uptake of nitrate is followed by reduction to nitrite (NO2−) by the cytosolic enzyme nitrate reductase and subsequent reduction of nitrite to ammonium by the plastid enzyme nitrite reductase. The electron donors for reduction of nitrate to ammonium are a single NADH molecule (nitrate reductase) and six reduced ferredoxin molecules (nitrite reductase). The energetic cost of reducing nitrate to ammonium corresponds to 12–26% of the photosynthetically generated reductant, so nitrate assimilation requires a substantially larger energy input than the direct uptake of ammonium (Bloom, 1997; Noctor and Foyer, 1998).
Beyond contrasting effects on cellular energetics and redox status, a variety of other physiological differences have been described between plants supplied with ammonium and plants supplied with nitrate. For example, organic acid content is higher in nitrate-supplied plants, while total amino acid content is higher in plants growth with ammonium as a nitrogen source (Chaillou et al., 1991; Cramer and Lewis, 1993; Pasqualini et al., 2001). The activity of several enzymes, including nitrate reductase and nitrite reductase, are specifically induced by nitrate, while other enzymes, such as glutamate dehydrogenase, several alternative oxidases, and several type II NAD(P)H dehydrogenases are induced by ammonium only (Goodchild and Givan, 1990; Frechilla et al., 2002; Escobar et al., 2006). Ammonium and nitrate also differ in their effect on extracellular pH, with nitrate uptake causing soil alkalinization and ammonium uptake causing soil acidification (Crawford and Forde, 2002). In addition, many plant species grow poorly when supplied with ammonium as a sole nitrogen source for extended periods, though the underlying mechanism(s) of this “ammonium toxicity” are not well understood (Britto and Kronzucker, 2002). In ecological systems, there are substantial species preferences for nitrate or ammonium that impact plant biodiversity (Falkengren-Grerup and Schöttelndreier, 2004).
Despite the fact that nitrate and ammonium clearly have distinct effects on plant metabolism, the study of inorganic nitrogen nutrition at the molecular level has been focused primarily on nitrate. Notably, nitrate’s role in the global regulation of the Arabidopsis thaliana transcriptome has been extensively explored using microarrays (Wang et al., 2000; Wang et al., 2003; Scheible et al., 2004; Bi et al., 2007; Gifford et al., 2008). These studies have shown that supplying nitrate to nitrogen-depleted Arabidopsis seedlings induces a massive transcriptional response, resulting in the upregulation of pathways involved in amino acid and nucleic acid biosynthesis, transcription and RNA processing, hormone biosynthesis, nitrogen assimilation, reductant supply, and trehalose metabolism. More recently, several studies have begun to differentiate direct molecular responses to the nitrate ion from general responses to nitrogen supply, using nitrate reductase null mutants (Wang et al., 2004) and mutants of the nitrate sensor CHL1-1 (Muños et al., 2004; Ho et al., 2009; Wang et al., 2009). Compared to nitrate, much less is known about the molecular effects of ammonium nutrition, though several recent publications have begun to examine ammonium regulation of gene expression in various plant systems (Fizames et al., 2004; Zhu et al., 2006; Hoffmann et al., 2007; Lopes and Araus, 2008; Ruffel et al., 2008). In this work, we have developed a physiologically realistic system to compare the differential effects of ammonium and nitrate on gene expression and cellular redox status in Arabidopsis roots.
Materials and Methods
Plant growth and experimental treatments
Arabidopsis thaliana ecotype Columbia-0 plants were grown hydroponically using an Araponics system (Araponics, Liege, Belgium). Seeds were placed in seed holders filled with 0.65% agarose, and eighteen seed holders were placed into a hydroponics box containing 1.9 L of nutrient medium. The nutrient medium was as previously described (Somerville and Ogren, 1982), but at half strength (2.5 mM KNO3, 1.25 mM KH2PO4 (pH5.6), 1 mM MgSO4, 1 mM Ca(NO3)2, 25 μM Fe-EDTA), supplemented with the reported micronutrient mix at 1X concentration. The hydroponics boxes (with seeds) were incubated at 4° C for 2 days and then transferred to a 22 °C growth chamber with a 16 h light (100 μmol m−2 sec−1), 8 h dark cycle. The seedlings were transferred to fresh nutrient medium after approximately 10 days, and continuous gentle aeration of the media was initiated. The plants were then grown until they reached growth stage 5.10 (Boyes et al., 2001) (approximately 10 additional days), and were then transferred to a nitrogen-free basal nutrient medium in which KNO3 was replaced with KCl and Ca(NO3)2 was replaced with CaCl2. After 26 h (four hours into the light phase of the illumination cycle), 1 mM KNO3, 0.5 mM (NH4)2SO4, or 0.5 mM K2SO4 was added to the medium. In some experiments 1 mM methionine sulfoximine was added to the medium immediately prior to ammonium addition.
Nitrate and ammonium quantitation
Nitrate quantitation in plant tissue and in the nutrient medium was performed as previously described (Cataldo et al., 1975). For tissue analysis, 100 mg of fresh root tissue was frozen in liquid nitrogen, pulverized, and added to 1 ml of deionized water. The suspension was incubated at 45 °C for 1 h and then centrifuged at 5000 × g for 15 min. The supernatant was utilized for nitrate quantitation. Quantitation of ammonium in tissue and nutrient medium was performed using a high-throughput colorimetric method (Bräutigam et al., 2007).
RNA isolation, cDNA synthesis, and real time PCR
Total RNA was isolated from root tissue pooled from at least five individual plants using a Qiagen RNeasy Plant Mini Kit with on-column DNAse I digestion (Qiagen, Valencia, CA, USA). RNA quality and concentration was determined spectrophotometrically and RNA integrity was verified by visual inspection of rRNA banding in electrophoretically separated total RNA. cDNA was synthesized from 1 μg of total RNA with a Verso cDNA kit (Abgene, Epsom, UK) using oligo-dT primers. First-strand cDNA was diluted 5-fold in 10 mM Tris-HCl (pH 8.0) for use in real time PCR reactions. Real time PCR was performed essentially as described by Escobar et al. (2006) using a Rotor Gene 6000 Real-time Cycler (Corbett Research, Sydney, Australia) and an Absolute Blue QPCR SYBR Green Fluorescein PCR Mix (Abgene, Epsom, UK). Relative transcript quantitation was determined using the Comparative Quantitation setting on Rotor Gene software version 1.7.87. The list of primers used for real time PCR analysis is included in Table S1. When possible, one primer in each pair was designed to span an exon-exon border, precluding amplification of genomic DNA.
Microarray hybridization and data analysis
Biotin-labeled aRNA was synthesized from 1 μg of total RNA using a Message Amp II-Biotin Enhanced aRNA synthesis kit (Ambion, Austin, TX, USA). The quality of the aRNA was verified by Agilent Bioanalyzer analysis using an RNA 6000 Nano Chip (Agilent Technologies, Santa Clara, CA, USA). All array experiments were performed in triplicate (separate biological replicates) except samples at the 0.5 h time point, for which two biological replicates were utilized. Hybridization to the Affymetrix ATH1 chip was performed according to Affymetrix’s recommended protocols (Lockhart et al., 1996) and the chips were scanned using an Affymetrix GeneChip Scanner 3000 (Affymetrix, Santa Clara, CA, USA). Raw expression values were normalized using Robust Multichip Average (RMA) expression summary (Bolstad et al., 2003). Fold changes and standard errors were estimated by fitting a linear model for each gene and empirical Bayes smoothing was applied to the standard errors for all the samples. The linear modeling approach and the empirical Bayes smoothing were implemented using the Limma package in the R program software package (Smyth, 2004). ANOVA was performed using Bioconductor in R program software (Gentleman et al., 2004). To correct for the multiple hypothesis testing, adjusted P-values were calculated using the Benjamini and Hochberg False Discovery Rate method (Benjamini and Hochberg, 1995). In order to determine the statistical significance of overlap between different microarray data sets, we conducted a contingency table test for association and used a Pearson’s Chi-square test to obtain a P-value. Following a significant Chi-square test, we calculated standardized residuals and compared them to a normal distribution.
Quantitation of NAD(P)H, ascorbate, glutathione, and hydrogen peroxide
For all analyses, root tissue was pooled from multiple plants, frozen in liquid nitrogen, and pulverized. NAD(H) and NADP(H) levels were determined in tissue extracts as described previously (Liu et al., 2008). Ascorbate and glutathione were measured using previously described enzyme-linked spectrophotometric methods (Queval and Noctor, 2007). Hydrogen peroxide levels were determined in tissue extracts using an Amplex Red Hydrogen Peroxide/Peroxidase Assay Kit (Invitrogen, Carlsbad, CA, USA) as described by Shin et al. (2005).
Enzyme activity assays
For enzyme activity measurements, 100 mg of pooled root tissue was frozen in liquid nitrogen, pulverized, and added to 1 ml of an extraction buffer containing 50 mM KH2PO4 (pH 7.8), 0.1 mM EDTA, and 2% (w/v) polyvinylpyrrolidone-40. The suspension was centrifuged (13,000 × g, 4 °C, 40 minutes) and the total protein concentration of the supernatant was determined using a Bradford assay (Bradford, 1976). The activities of catalase, superoxide dismutase, glutathione reductase, and guaiacol peroxidase were determined according to previously published protocols (Beers and Sizer, 1952; Foyer and Halliwell, 1977; Dhindsa et al., 1981; Upadhyaya et al., 1985). For nitrate reductase measurements, both protein extraction and the activity assay were performed as previously described (Yu et al., 1998).
Results
The Plant Growth System
Arabidopsis plants were grown in a hydroponic system for ease and precision of nitrate and ammonium addition and removal from plant roots. In order to provide the most physiologically realistic growth conditions, only the roots were in contact with the hydroponic medium and no external carbon source (e.g. sucrose, succinate) was supplied. When plants reached growth stage 5.10 (Boyes et al., 2001), they were transferred to a nitrogen-free medium for 26 h. This time period was sufficient to reduce root tissue nitrate content by approximately 80% compared to plants maintained continuously on the basal nutrient medium (data not shown).
Following nitrate depletion, the growth medium was supplemented with either nitrate or ammonium at a concentration of 1 mM. Subsequently, we monitored both the rate of nitrate and ammonium uptake into the roots and the rate of nitrate and ammonium depletion from the media. As summarized in Figure 1, both ammonium and nitrate were rapidly taken up into the roots, though nitrate accumulated to a higher level in the tissue, presumably due to greater vacuolar storage of nitrate and/or ammonium efflux back into the apoplast (Rawat et al., 1999; Crawford and Forde, 2002). Nitrate and ammonium levels progressively decreased in the media over the 24 h time course, but never fell below a concentration of 0.7 mM, demonstrating that the plants did not exhaust their nitrogen source over the course of the experiments (Fig. 1). In addition, there was no indication of the presence of nitrifying microorganisms (i.e. no oxidation of ammonium to nitrate) in the ammonium medium. Finally, changes in the pH of the growth media were minimal over the course of the experiment, with pH decreasing by an average of 0.13 units in the ammonium medium and increasing by 0.14 units in the nitrate medium over the 24 h time course.
Figure 1.

Nitrate and ammonium levels in root tissue (A, C) and nutrient medium (B, D) of hydroponically grown Arabidopsis thaliana plants. The nitrogen-depleted plants were supplied with 1 mM nitrate or 1 mM ammonium just after time (h) 0. Data are presented as means ± SEM from three separate tissue/medium samples for each treatment and time point.
Microarray Analysis
In order to examine rapid changes in global patterns of gene expression upon exposure to a new nitrogen source, we used Affymetrix ATH1 microarrays to characterize the transcriptome of Arabidopsis roots at 0.5 h, 1.5 h, and 8 h after nitrate or ammonium supply. For each data set we calculated fold-change values compared to a 0 h treatment sampled just prior to nitrate and ammonium addition. Differentially expressed genes were defined as the subset of genes displaying at least a 2-fold change in transcript abundance and with an adjusted P-value ≤ 0.05 (Benjamini and Hochberg, 1995).
As expected based upon previous microarray studies (Wang et al., 2003), nitrate supply induced rapid, large-scale changes in the Arabidopsis root transcriptome, with more than 250 genes differentially expressed after 0.5 h, and more than 500 genes differentially expressed after both 1.5 h and 8 h. Ammonium also rapidly and substantially altered the transcriptome, though the total number of differentially expressed genes at each time point was 12–18% lower than the corresponding number of differentially expressed genes in nitrate-supplied plants.
The nitrate-regulated and ammonium-regulated gene sets were compared using Venn diagrams to identify the specific genes whose expression was controlled exclusively by nitrate, exclusively by ammonium, or by both nitrate and ammonium (Fig. 2). A large percentage (56–58%) of the differentially expressed genes at each time point were coordinately regulated by both ammonium and nitrate, representing a general response to inorganic nitrogen supply (“general inorganic nitrogen”, Fig. 2 and Table S2). However, substantial numbers of genes were exclusively regulated by either nitrate or ammonium nutrition (“nitrate specific” and “ammonium specific”, Fig. 2 and Tables S3, S4). In addition, several genes displayed opposing regulation by nitrate and ammonium (i.e. ammonium-induced and nitrate-repressed), and these genes have also been denoted in Tables S3 and S4. Note that because of the time course design of the experiment (i.e. all comparisons are made to time 0 h), genes within the general inorganic nitrogen group may simply be regulated by diurnal cycling of transcript abundance. Using the DIURNAL data mining tool (Mockler et al., 2007), we determined that the observed expression patterns of < 5% of the general inorganic nitrogen genes at 0.5 h and 1.5 h could be explained by expected diurnal cycling patterns and that 21% of the general inorganic nitrogen genes at 8 h could be explained by expected diurnal cycling patterns. Below, we have primarily focused on analysis of the ammonium-specific and nitrate-specific gene sets in order to define the specific molecular and physiological changes that differentiate ammonium-supplied plants from nitrate-supplied plants.
Figure 2.

Identification of Arabidopsis genes responsive to nitrate only, ammonium only, or both nitrogen forms at 1.5 h post nitrogen supply. In order to clearly differentiate nitrate-regulated genes from ammonium-regulated genes, the nitrate-specific set contains only those genes which display both ≥ 2-fold change in transcript abundance (compared to 0 h) in the nitrate treatment and ≤ 1.4-fold change in the ammonium treatment. Likewise, the ammonium-specific set contains genes displaying both ≥ 2-fold change in transcript abundance in the ammonium treatment and ≤ 1.4-fold change in the nitrate treatment. The general inorganic nitrogen set contains genes displaying ≥ 2-fold change in transcript abundance in either the ammonium or nitrate treatment and ≥ 1.4-fold change in the alternative nitrogen source. For all comparisons, adjusted P-values are ≤ 0.05. Corresponding ammonium-specific: general inorganic nitrogen: nitrate specific gene ratios at times 0.5 h and 8 h are 49:177:85 and 104:445:225, respectively.
For further analysis, the ammonium-specific gene sets and the nitrate-specific gene sets were sorted into separate induced and repressed subgroups (Tables S2, S3). These subgroups were then analyzed using the BioMaps program (Katari et al., 2010) in order to gain a broad overview of the metabolic and regulatory differences between roots supplied with nitrate and roots supplied with ammonium. BioMaps identifies and statistically analyzes over-represented functional categories in microarray data (Wang et al., 2007). A simplified summary of the major over-represented functional groups identified by BioMaps is presented in Table I, and complete results from BioMaps analysis of all treatments/time points are provided in Tables S5–S7. Upregulation of cation transport, cytokinin response, and the oxidative pentose phosphate pathway/NAD(P)H generation were identified as nitrate-specific responses. In contrast, the biotic stress/defense and transcriptional regulation categories were uniquely induced by ammonium. The general inorganic nitrogen gene set displayed over-representation of several functional categories, including nitrate transport, trehalose biosynthesis, cytokinin response and the pentose phosphate pathway. The latter two categories overlap with the nitrate-specific gene set, suggesting that these responses are induced to a greater extent in, but are not exclusive to, nitrate-supplied plants. No functional categories were over-represented in the sets of genes specifically repressed by ammonium or specifically repressed by nitrate. Lipid biosynthesis and transport as well as various abiotic stress responses appear to be downregulated by both nitrate and ammonium (Tables S5–S7).
Table I.
Summary of significantly over-represented functional categories in ammonium-regulated and nitrate-regulated gene sets
| Functional categorya | Time point | Observed frequency | Expected frequency | P-value |
|---|---|---|---|---|
| Specifically induced by ammonium | ||||
| Plant defense and innate immune response | 0.5/1.5/8 h | 8.3%/4.6%/8.8% | 0.3%/0.3%/0.7% | 6.4 × 10⁻⁴/7.6 × 10−3/1.3 × 10−5 |
| Regulation of transcription | 0.5 h | 25.0% | 5.6% | 3.5 × 10⁻⁴ |
| Response to jasmonic acid | 1.5 h | 5.7% | 0.5% | 4.0 × 10⁻³ |
| Response to stress | 8 h | 18.7% | 5.5% | 5.6 × 10⁻⁴ |
| Specifically induced by nitrate | ||||
| Nicotinamide metabolic processb | 0.5/8 h | 5.1%/2.9% | 0.1%/0.1% | 1.6 × 10⁻⁴/2.3 × 10−3 |
| Pentose phosphate pathway | 0.5 h | 3.8% | 0.1% | 3.6 × 10⁻³ |
| Monovalent cation transport | 1.5/8 h | 5.6%/4.3% | 0.5%/0.5% | 9.5 × 10⁻⁴/5.3 × 10−3 |
| Potassium ion transport | 8 h | 2.9% | 0.2% | 7.8 × 10⁻³ |
| Cytokinin response | 8 h | 5.0% | 0.3% | 7.9 × 10⁻⁶ |
A minimum of three differentially regulated genes are present in each noted functional category
Defined as the chemical reactions and pathways involving nicotinamide nucleotides (NADH, NADPH)
To expand our functional analysis of the nitrate-specific and ammonium-specific gene sets, we used the MapMan program to perform microarray data visualization and biochemical pathway overlays (Usadel et al., 2005). Several trends are visually obvious when overlaying the nitrate-specific data upon a metabolic overview map (Figure S1). Within the redox metabolism domain, genes encoding the two NADPH-generating enzymes of the oxidative pentose phosphate pathway, glucose-6-phosphate dehydrogenase (At5g13110) and 6-phosphogluconate dehydrogenase (At5g41670, At1g64190), are strongly and rapidly induced by nitrate. Two genes encoding ferredoxin:NADP+ reductase (At4g05390, At1g30510), and a gene encoding ferredoxin (At2g27510) are also coordinately upregulated. In addition, six type-A transcriptional response regulator genes involved in cytokinin signaling (ARR3, ARR4, ARR5, ARR6, ARR8, ARR9) were strongly and specifically induced eight hours after nitrate treatment, supporting the previously identified association between nitrate and cytokinin biosynthesis and/or transport (Walch-Liu et al., 2000; Rahayu et al., 2005).
While most of the described nitrate-specific metabolic regulation supports previous findings (Wang et al., 2000; Wang et al., 2003; Scheible et al., 2004; Wang et al., 2004; Gifford et al., 2008), very little is known about ammonium-specific plant response on a global scale. MapMan analysis of the ammonium-specific gene set (Figure S2) revealed a substantial and coordinated downregulation of the expression of genes encoding several classes of cell wall modifying enzymes at 1.5 and 8 h after ammonium supply. For example, the polygalacturonase At2g43890 is downregulated > 4-fold, while the polygalacturonase-inhibiting protein PGIP1 (At5g06860) is upregulated > 3-fold at 1.5 h following ammonium supply. Four expansins, four endo-transglycosylases, one pectate lyase and one additional polygalacturonase were also downregulated ≥ 1.7-fold at 1.5 h and/or 8 h after ammonium supply. BioMaps analysis had previously demonstrated that the functional category of transcriptional regulation was specifically altered in ammonium-supplied plants, and this was supported by MapMan analyses. Most notably, the transcript abundance of seven WRKY-type transcription factor genes (WRKY 31, 33, 40, 46, 53, 70, and 75) increased at least 2-fold over the 8 h time course. Beyond the WRKY transcription factors, we identified one additional large gene family in which several members presented dramatically different responses to ammonium and nitrate. As shown in Figure 3, the nodulin gene family displayed a complex regulatory pattern in response to different forms of inorganic nitrogen, with some genes induced exclusively by ammonium, others induced exclusively by nitrate, and still others repressed by one nitrogen source and induced by the other. All three of the ammonium-induced nodulins (At4g28040, At1g21890, At2g39510) and one of the two nitrate-specific nodulins (At1g43650) are predicted to be membrane transporters of unknown specificity within the poorly studied Drug/Metabolite Transporter superfamily (Ren et al., 2007).
Figure 3.

Differential regulation of nodulin genes by nitrate and ammonium. Each bar represents the mean relative transcript abundance (± SD) of the corresponding gene, as determined by microarray analysis. For the 0, 1.5, and 8 h time points n = 3, and for the 0.5 h time point n = 2. Note that transcript abundance at time 0 h was arbitrarily assigned a value of 1, independently for each gene. Thus, comparisons of transcript abundance between different genes are not possible in this representation. N = nitrate, A = ammonium.
For a subset of the differentially expressed genes identified by microarray analysis, changes in gene expression were independently verified by real time PCR analysis. We examined seven genes exclusively or primarily induced by ammonium in the array data: glutamate dehydrogenase 2 (GDH2; At5g07440), PINOID-binding protein 1 (PBP1; At5g54490), WRKY70 transcription factor (At3g56400), a nodulin-family protein (At2g39510), myo-inositol oxygenase 4 (MIOX4; At4g26260), a proline oxidase (At5g38710), and NAC-containing domain transcription factor 47 (NAC47 At3g04070). In addition, one gene exclusively induced by nitrate (nitrate reductase 1 [NR1; At1g77760]), one gene strongly induced by both ammonium and nitrate (CBL-interacting protein kinase 13 [CBL13; At2g34180]), and one invariant control (76 kDa subunit of mitochondrial complex I [At5g37510]) were profiled. As summarized in Figure 4, the real time PCR time course data was fully consistent with the microarray data, corroborating the reliability of the microarray.
Figure 4.

Timecourse analysis of genes differentially regulated by nitrate and ammonium using real time PCR. Nitrogen-limited plants were supplied with either ammonium (as [NH4]2SO4), nitrate (as KNO3), or potassium sulfate for the time periods indicated. Data are presented as means ± SEM from three independent experimental replicates. Transcript abundance at time 0 h was arbitrarily assigned a value of 1, independently for each gene. Note that potassium sulfate treatment was examined only at 1.5 h.
In all experiments, nitrate was provided to plants as KNO3 and ammonium was provided as (NH4)2SO4. Although K+ and SO4− were already present in the plant growth medium, it is theoretically possible that increasing the concentrations of these ions could have caused the observed changes. To further examine this possibility, plants were provided with 0.5 mM K2SO4 (rather than KNO3 or [NH4]2SO4) for 1.5 h and the expression levels of the ten genes described above were examined. None of the genes displayed major changes in expression that could account for nitrogen-associated regulatory patterns (Fig. 4), suggesting that nitrate and ammonium, not their counterions, are primarily responsible for the observed effects on the Arabidopsis root transcriptome.
Cellular Redox Balancing and Reactive Oxygen Species
In a previous study, we showed that ammonium supply increases type II NAD(P)H dehydrogenase activity, alternative oxidase activity, and respiratory rate, while nitrate supply has the opposite effect on these processes (Escobar et al., 2006). Based upon these findings we proposed that most of the reductant (NAD[P]H) generated in the mitochondrial matrix is oxidized by the respiratory chain in ammonium-supplied plants. In contrast, we hypothesized that nitrate-supplied plants export a significant portion of matrix reductant to the cytosol via metabolite transporters, thereby providing the NADH necessary for nitrate reductase activity (see also Krömer, 1995). If this model is correct, we would expect that potential mitochondrial reductant shuttles would be upregulated by nitrate, but not ammonium. In support of the model, analysis of mitochondrial metabolite transporters using MapMan showed a striking upregulation of mitochondrial carrier proteins in the nitrate-specific gene set, but not the ammonium-specific gene set (Fig. 5). Four mitochondrial carrier proteins (At5g01340, At5g26200, At5g48970, and At5g12860) were upregulated at least 2-fold during the 8 hours following nitrate supply. Most notably, the protein encoded by At5g12860 (OMT1) is a probable reductant shuttle, with the ability to transport malate in exchange for oxaloacetate, and is dual targeted to chloroplasts and mitochondria (Taniguchi et al., 2002; Dunkley et al., 2006). In addition, At5g01340 is closely related to the yeast ACR1, which transports di- and tricarboxylates, and may be involved in a citrate valve for mitochondrial reductant export (Catoni et al., 2003; Igamberdiev and Gardeström, 2003). In concert with our previous findings (Escobar et al., 2006), the alternative oxidase AOX1a (At3g22370) and the type II NAD(P)H dehydrogenase NDA2 (At2g29990) were also downregulated > 2-fold in the nitrate-specific gene set.
Figure 5.
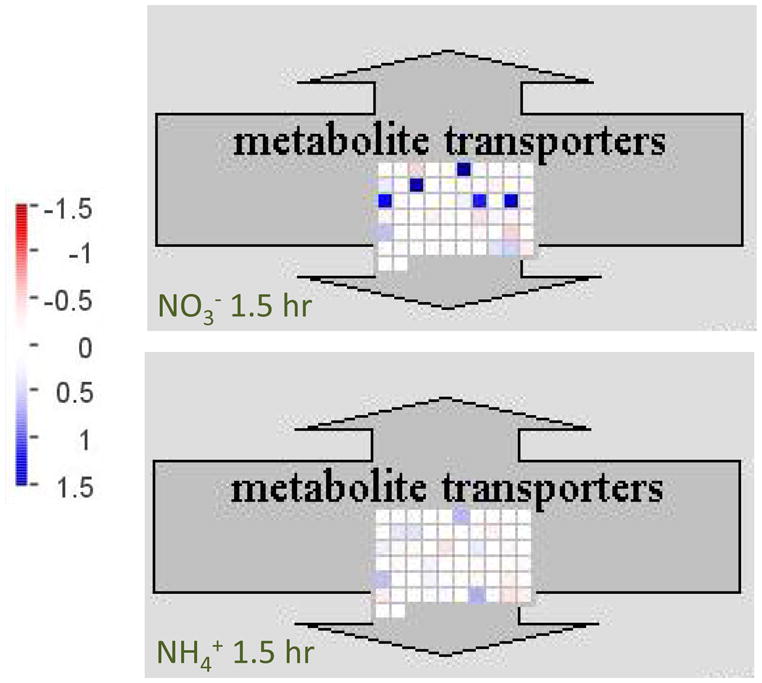
Analysis of mitochondrial carrier protein regulation using MapMan software (Usadel et al., 2005). Note that the values on the scale at left are log2 transformed.
In non-green tissue, the mitochondrial respiratory chain is generally the major site of reactive oxygen species (ROS) production (Møller, 2001). If nitrate-supplied plants export a significant proportion of their matrix reductant to the cytosol, rather than oxidizing it via the respiratory chain, then the roots of nitrate-supplied plants might be expected to produce less ROS than the roots of ammonium-supplied plants. To test this hypothesis, we quantified H2O2 levels in the roots of nitrate- and ammonium-supplied plants. It should be noted that nitrogen deprivation increases ROS levels in Arabidopsis roots (Shin et al., 2005), so elevated H2O2 concentrations were expected in the nitrogen-depleted plants (i.e. at time 0 h). As shown in Figure 6, providing nitrate to nitrogen-depleted seedlings caused a rapid and significant drop in root H2O2 levels (~30% decrease after 0.5 h). In contrast, H2O2 levels in the roots of ammonium-supplied plants initially remained high, and then began to decrease slowly 1.5 h after ammonium addition.
Figure 6.

H2O2 levels in Arabidopsis roots under ammonium and nitrate nutrition. Nitrogen limited plants were supplied with either ammonium or nitrate for the time periods indicated. Data from two separate experiments were combined to generate the figure. All data points represent means ± SEM (n = 6, except at 0.5 h where n = 3).
Given the differences in ROS production and reductant shuttling between ammonium-supplied plants and nitrate-supplied plants, we decided to study the status of the four major redox metabolites in roots: NADH, NADPH, glutathione, and ascorbate. The pool sizes and oxidation states of NAD(H) and NADP(H) were essentially unchanged by both nitrate and ammonium supply (Fig. S3). Likewise, no significant changes were observed in the size and overall oxidation state of the glutathione and ascorbate pools (Figs. S4, S5), though the concentrations of oxidized ascorbate (dehydroascorbate) and oxidized glutathione (GSSG) were somewhat higher in ammonium-supplied plants. The activities of the antioxidant enzymes superoxide dismutase, guaiacol peroxidase, and glutathione reductase showed small, but significant increases in ammonium-supplied plants compared to nitrate-supplied plants at the 1.5 h time point (Fig. 7). Overall, these findings suggest that small adjustments in the protein and non-protein antioxidant pools effectively prevented major perturbations in redox homeostasis in both nitrate- and ammonium-supplied plants.
Figure 7.

Activities of ROS-metabolizing enzymes in ammonium-supplied and nitrate-supplied Arabidopsis roots. Nitrogen-limited plants were supplied with either ammonium or nitrate for the time periods indicated. Catalase (A), glutathione reductase (B), superoxide dismutase (C), and guaiacol peroxidase (D) were measured in enzyme extracts as described in Materials and Methods. Data are presented as means ± SEM from at least three independent experimental replicates. Stars indicate statistically significant differences (P < 0.05) in enzyme activity between nitrate-supplied and ammonium-supplied plants. For the superoxide dismutase assay, one enzyme unit is defined as the quantity of superoxide dismutase required to produce a 50% inhibition of nitro blue tetrazolium photoreduction (Dhindsa et al., 1981).
Ammonium as a Signal
It is well established that the nitrate ion is a potent signaling molecule that can radically alter patterns of gene expression in Arabidopsis and other plants (Wang et al., 2004). Thus it is unsurprising that a subset of nitrogen-regulated genes display a highly specific response only to nitrate (Fig. 2). Because the assimilation of nitrate and the assimilation of ammonium converge once nitrite has been reduced to ammonium in the plastid, it is less clear how ammonium nutrition can generate a unique signal that produces the ammonium-specific nitrogen response. One possibility is that a downstream metabolite of ammonium assimilation (e.g. glutamate, glutamine) triggers changes in gene expression, though presumably only in the absence of nitrate. To test this hypothesis, we examined the effect of the glutamine synthetase inhibitor methionine sulfoximine (MSX) on the regulation of ammonium-specific genes. It should be noted that while MSX abolishes ammonium assimilation, it does not suppress ammonium uptake and accumulation in Arabidopsis roots (Rawat et al., 1999). We found that MSX greatly reduced ammonium response in three of the seven genes previously shown to be specifically upregulated by ammonium (GDH2, MIOX4, nodulin At2g39510). Ammonium-induced upregulation of the expression of three additional genes was either unaffected (NAC47) or actually increased (WRKY70, PBP1) in the presence of MSX (Fig. 8). Thus, downstream products of ammonium assimilation are critical signals in the regulation of some, but not all, genes specifically regulated by ammonium.
Figure 8.

The effects of the glutamine synthetase inhibitor MSX on the expression of ammonium-induced genes. Nitrogen-limited plants were supplied with either 1 mM ammonium (1.5 h A) or 1 mM ammonium + 1 mM MSX (1.5 h A + MSX) for 1.5 h. Data are presented as means ± SEM from three independent experimental replicates. Transcript abundance at time 0 h was arbitrarily assigned a value of 1, independently for each gene.
Ammonium uptake is coupled to the extrusion of protons by plasma membrane proton ATPases, resulting in acidification of the extracellular space (Bloom et al., 2003). Thus, it is also possible that ammonium-specific signals could be generated by uptake-associated changes in extracellular pH. For example, previous work has shown that the expression of the ammonium-regulated genes AOX2 and NDB4 was partially mediated by acidification of the extracellular medium (Escobar et al., 2006). Thus, we decided to compare our ammonium-specific gene sets with the recently defined acid-responsive Arabidopsis root transcriptome (Lager et al., submitted). Comparison of the gene set specifically upregulated by ammonium (1.5 h treatment) with the gene set upregulated 1 h after transfer to acidified (pH 4.5) growth medium revealed a highly significant overlap (P < 6.4 × 10−80), with 21% of ammonium-induced genes also induced by acidic pH. Comparison of the 8 h gene sets (ammonium vs. acidified medium) was even more dramatic (P < 1.7 × 10−130), with 43% of ammonium-induced genes also induced by acidic pH (Fig. 9). Analysis of the overlapping gene set induced by both low pH and ammonium using BioMaps revealed a significant over-representation of genes involved in plant defense/immune response (P = 4.3 × 10⁻⁴ for the 1.5 h gene set and P = 4.6 × 10⁻⁶ for the 8 h gene set). Notably, NAC47, WRKY70, and PBP1, the three examined genes whose ammonium response could not be attributed to downstream assimilatory intermediates (Fig. 8), were present in the acid-induced gene set. Thus, it appears likely that many ammonium-responsive genes are specifically regulated by changes in pH associated with ammonium uptake.
Figure 9.

A common group of genes is regulated by ammonium and acidic extracellular pH in Arabidopsis roots. The ammonium-specific gene sets contain genes that display ≥ 2-fold increases in transcript abundance (compared to time 0 h) in the ammonium treatment and ≤ 1.4 fold increase in the nitrate treatment (see Fig. 2). The pH 4.5-induced gene sets contain genes displaying ≥ 2-fold increase in transcript abundance (compared to pH 6.0). For all comparisons, adjusted P-values are ≤ 0.05.
Discussion
Dissection of plant response to different forms of inorganic nitrogen
Our primary goal in this study was to differentiate the rapid physiological and molecular effects of the two most common sources of nitrogen utilized by plants: nitrate and ammonium. It is clear from our findings that nitrate nutrition and ammonium nutrition elicit many similar responses in Arabidopsis roots. For example, several pathways/processes previously shown to be upregulated by nitrate supply, including trehalose synthesis, glycolysis, and sucrose degradation (Wang et al., 2003; Scheible et al., 2004), are similarly upregulated by ammonium. Thus, these processes are responsive to overall plant nitrogen status, not nitrate per se. However, it is also apparent that a variety of genes/biochemical pathways are regulated exclusively by either nitrate or ammonium. Several recent publications have explored the effects of relatively long-term plant growth on ammonium or nitrate nutrition, so it is informative to compare our findings with these previous reports.
Zhu et al. (2006) used a 10,000-element cDNA microarray to study the leaf transcriptome of rice plants supplied with either 3 mM nitrate or 3 mM ammonium for 24, 48, and 72 h. They identified 198 genes displaying >2-fold changes in gene expression upon ammonium and/or nitrate supply. Although the full gene list was not provided, Zhu et al. (2006) specifically correlated an upregulation of sulfur metabolism with ammonium nutrition. While three sulfate transporters displayed differential regulation in our data sets, they showed either a nitrate-specific response or a general inorganic nitrogen response. Lopes and Araus (2008) used Affymetrix gene chips to compare transcript levels in the shoots of barley plants supplied with 11 mM nitrate, ammonium, or ammonium nitrate for 48 h. Surprisingly, very few genes showed differential regulation. Using a threshold of 2-fold change and P < 0.01, one gene (a glucosyltranserase) was found to be specifically ammonium-induced (or nitrate-repressed) and two genes (a receptor kinase and a tryptophan decarboxylase) were specifically nitrate-induced (or ammonium-repressed). None of the corresponding Arabidopsis homologs are similarly regulated in our data. Hoffmann et al. (2007) grew Arabidopsis seedlings continuously on medium containing 4 mM ammonium or 4 mM nitrate for 15 days and hybridized cDNA from the whole seedlings to a 5,500-feature cDNA array. It should be noted that Arabidopsis is quite sensitive to long-term exposure to ammonium as a sole nitrogen source (Crawford and Forde, 2002), so the developmental state of the ammonium-grown plants was quite different from the developmental state of the nitrate-grown plants. In any case, only two genes were found to be differentially expressed under nitrate and ammonium nutrition (> 2-fold change, P < 0.05), a PEP carboxykinase (At4g37870) and a carbonic anhydrase (At3g01500). Subsequent analysis by Northern blotting showed that genes encoding several enzymes involved in β-oxidation were specifically upregulated in ammonium-supplied plants. None of the examined genes were differentially regulated in our data sets. In summary, there appears to be limited functional overlap between our findings and the results of these studies, likely due to differences in plant species, organs analyzed, and experimental treatment times (i.e. comparing primary and secondary effects).
The results of two papers focused on ammonium and nitrate effects in root tissue did show some similarities to our findings. Fizames et al. (2004) used serial analysis of gene expression (SAGE) to monitor changes in the root transcriptome of Arabidopsis plants grown continuously with either 1 mM nitrate or 1 mM ammonium nitrate as a nitrogen source. Out of 4000 unique sequence tags (representing ~15% of the total gene number in Arabidopsis), 270 tags (genes) showed significant differences in abundance in the nitrate and ammonium nitrate groups. While these 270 genes do not show extensive overlap with our nitrate-specific and ammonium-specific gene sets, there are a number of consistent regulatory patterns regarding individual genes. Most notably, in both data sets GDH2 was specifically induced by ammonium, while NR1 and a glucose-6-phosphate dehydrogenase (At1g24280) were specifically induced by nitrate. Work by Ruffel et al. (2008) focused on the systemic signaling role of different forms of nitrogen in Medicago truncatula roots. Although the transcriptome of ammonium-supplied roots was not directly compared with the transcriptome of nitrate-supplied roots, indirect comparisons performed by Ruffel et al. (2008) showed that the upregulation of the oxidative pentose phosphate pathway was specific to nitrate-supplied plants, as was also observed in our data. Overall, the findings reported here greatly expand and clarify our current understanding of the differences between nitrate response and ammonium response in plants.
One potential complicating factor in analyses of different forms of inorganic nitrogen nutrition is the fact that ammonium assimilation and nitrate reduction/assimilation do not necessarily occur in the same tissue in Arabidopsis. Ammonium that is taken up from the soil is generally assimilated directly in roots (Bloom, 1997), though there is evidence of root-to-shoot translocation of NH4+ in some species (Schjoerring et al., 2002). The site of nitrate reduction/assimilation is highly variable, depending on both the plant species and environmental conditions. While the shoot is a major site of nitrate reduction/assimilation under many environmental conditions in Arabidopsis, several lines of evidence point to significant nitrate reduction/assimilation in the root in our experiments. Nitrate-supplied roots displayed large increases in the abundance of nitrate reductase (At1g77760), nitrite reductase (At2g15620), and NADH-GOGAT (At5g53460) transcripts and a >10-fold increase in nitrate reductase enzyme activity (Fig. S6), strongly suggesting that some nitrate reduction is occurring in roots. Likewise, the extensive overlap in the ammonium-regulated and nitrate-regulated gene sets (even after only 0.5 h exposure to each nitrogen source), suggests a common signaling pathway. Any potential signaling intermediates common to both nitrate and ammonium nutrition are downstream of nitrate reduction, again suggesting that nitrate reduction/assimilation occurs in roots. Finally, low light conditions and low tissue levels of nitrate promote direct reduction/assimilation of nitrate in roots (Bloom, 1997), and our experimental setup makes use of both relatively low light (100 μmol m−2 sec−1) and nitrogen-limited plants. Overall, these results suggest that the assimilation of both nitrate and ammonium is occurring in the roots of our nitrogen-limited Arabidopsis plants (though some shoot transport and assimilation is not excluded). This finding is consistent with Bloom’s (1997) hypothesis that nitrogen-limited plants which encounter a nutrient-rich soil patch will initially assimilate nitrogen in the root to support further root growth.
The nitrate-specific response is largely associated with the generation and distribution of reducing equivalents
The expression of 335 genes was specifically altered by nitrate, but not ammonium, during the eight hours following inorganic nitrogen provision to Arabidopsis roots. This subset of genes is specifically regulated by nitrate, separated from the much larger transcriptional response to nitrogen availability in general (Fig. 2). Within this nitrate-specific gene set, there is a clear overrepresentation of genes involved in reductant generation and distribution, as might be expected given the substantial energetic costs of nitrate reduction. Based upon the upregulation of mitochondrial reductant shuttles (e.g. OMT1) and the downregulation of genes encoding respiratory alternative oxidases and type II NAD(P)H dehydrogenases, it appears that the NADH required for nitrate reduction in the cytosol is partially supplied by transport from the mitochondrial matrix (Krömer, 1995; Escobar et al., 2006). As reductant is diverted from the mitochondria to this novel cytosolic sink (nitrate reductase), there is a near-instantaneous decrease in H2O2 levels (Fig. 6), presumably due to a decreased reductant flow to the respiratory chain (a primary site of ROS production). This hypothesis is also consistent with our previous finding that nitrate-supplied plants display a lower respiratory rate than ammonium-supplied plants (Escobar et al., 2006). Once nitrate has been reduced to nitrite in the cytosol, subsequent reduction to ammonium requires the generation of additional reductant in plastids. The reduced ferredoxin required for nitrite reductase activity appears to be generated via the oxidative pentose phosphate pathway and the ferredoxin:NADPH reductase, both of which are specifically upregulated by nitrate in our data (see also Ruffel et al. [2008] and Redinbaugh and Campbell [1998]).
Wang et al. (2004) used a different approach, the transcriptional profiling of a nitrate reductase null mutant, to dissect nitrate-responsive genes from the more general transcriptional response to nitrogen supply. Substantial similarities were observed when comparing our nitrate-specific gene set (1.5 hr nitrate exposure) to the set of genes differentially regulated in the roots of both wild-type and nitrate reductase null mutants (2 hr nitrate exposure). Specifically, 35% of downregulated genes and 52% of upregulated genes in our nitrate-specific gene set were also identified by Wang et al. (2004). The lack of more extensive overlap is likely due to the combined signaling effects of the nitrate ion and nitrate metabolism (no nitrate metabolism is possible in the nitrate reductase null mutant) and the absence of an exogenous carbon source in our study. Regardless, there appears to be a small core set of genes identified in both studies which are rapidly and specifically regulated by nitrate supply in Arabidopsis roots (Table S8).
The ammonium-specific response is primarily associated with biotic stress and plant defense
Compared with nitrate, relatively little is known about the ammonium-specific regulation of plant gene expression and metabolism. One of the better characterized physiological effects of ammonium nutrition is a strong increase in glutamate dehydrogenase activity, which presumably provides an alternative route for ammonium assimilation when intracellular ammonium concentrations are high (Goodchild and Givan, 1990; Frechilla et al., 2002; Skopelitis et al., 2006). Correspondingly, we observed a rapid and sustained upregulation of GDH2 specifically in the ammonium-supplied plants. Several members of the nodulin gene family also displayed unique ammonium-specific responses, with two genes upregulated specifically by ammonium (At4g28040 and At2g39510) and two genes displaying opposing regulation by ammonium and nitrate (At2g16660 and At1g21890) (Fig. 3). Nodulins were first characterized in legumes as genes expressed in root nodules associated with symbiotic nitrogen fixation (Pawlowski, 1997), so nitrogen regulation of nodulins is perhaps superficially unsurprising. However, the function of nodulins in non-legumes, including Arabidopsis, is poorly understood. Given their highly specific expression patterns, it appears that some nodulins may play a role in tailoring root response to different forms of inorganic nitrogen. This connection between nodulins and nitrogen metabolism in non-legumes is further supported by a very recent study which showed that overexpression of the nodulin gene OsENOD93-1 in rice significantly increased whole-plant nitrogen-use efficiency (Bi et al., 2009).
Surprisingly, the dominant coordinated response specific to ammonium nutrition in Arabidopsis roots appears to be a biotic stress/plant defense response. This ammonium-associated defense response is manifested on several levels. First, genes encoding proteins with direct or indirect antimicrobial activity, including chitinases, PGIP1, and various disease resistance proteins, are specifically upregulated by ammonium. Second, the WRKY transcription factors WRKY33, WRKY40, WRKY53, and WRKY70, which have been previously implicated in the regulation of plant defense responses (Pandey and Somssich, 2009), are also specifically upregulated by ammonium. Finally, we observed a coordinated downregulation of genes involved in cell wall modification (polygalacturonases, expansins, and endo-transglycosylases) in the ammonium-specific gene set. Several recent studies have demonstrated that cell wall modification/loosening is associated with increased pathogen susceptibility (Cantu et al., 2008; Ding et al., 2008), so this regulatory pattern is fully consistent with a defense/biotic stress response. However, the larger question of why Arabidopsis roots activate pathogenesis-related transcriptional responses upon exposure to ammonium remains difficult to address. It does appear that ammonium-mediated changes in extracellular pH play an important signaling role in activating defense-associated genes, since many of the pathogen response genes that are rapidly upregulated by ammonium exposure are also rapidly upregulated by acidic extracellular pH alone (Lager et al., submitted). Biotic stress responses are often associated with changes in ROS (Torres and Dangl, 2005), but ammonium supply did not lead to a significant increase in steady state H2O2 levels (Fig. 6). However, the activity of several antioxidant enzymes was transiently elevated, suggesting that ammonium-supplied plants may be subjected to modest alterations in cellular redox parameters (Figs. S4, S5, 7), which could contribute to defense-associated signaling.
Ammonium-mediated changes in gene expression are controlled by multiple signals
In addition to defining the particular patterns of gene expression associated with nitrate or ammonium supply, our findings also shed light on the different signaling mechanisms that underlie these patterns (Fig. 10). As discussed previously, we identified three general regulatory classes among differentially expressed genes: ammonium-specific regulation, nitrate-specific regulation, and general inorganic nitrogen regulation. Because the metabolism of ammonium and the metabolism of nitrate converge once nitrate has been reduced to ammonium, the key signal regulating the nitrate-specific gene set is likely the nitrate ion itself. It is also possible that nitrite (Wang et al., 2007) or nitric oxide (Planchet and Kaiser, 2006) derived from nitrate reduction could act as key signals regulating the nitrate-specific gene set. The large group of genes coordinately regulated by both ammonium and nitrate in our data presumably respond to a metabolite downstream of ammonium assimilation, for example glutamate or glutamine. Indeed, a recent microarray study clearly demonstrated that glutamate and glutamine are potent regulators of gene expression (Gutierrez et al., 2008).
Figure 10.

A model of inorganic nitrogen signaling in Arabidopsis roots. Signals derived from ammonium and nitrate nutrition are italicized.
We identified two separate ammonium-associated signaling pathways, one derived from changes in extracellular pH and the other linked to glutamate/glutamine (Fig. 10). The dual nature of ammonium signaling was also recognized by Goodchild and Givan (1990), using Acer pseudoplatanus cell cultures as a model. Ammonium-induced increases in cellular glutamate dehydrogenase activity were found to be independent of medium pH changes, but alterations in amino acid and organic acid pools could be almost entirely attributed to medium pH, not inorganic nitrogen source per se (Goodchild and Givan, 1990). In our work, a decrease in extracellular pH associated with ammonium transport into root cells appears to activate the expression of several ammonium-specific genes, including WRKY70, PBP1, and NAC47. As discussed above, the pH changes in the bulk nutrient medium over the course of the experiments were minimal, however highly localized pH domains are typical of plant roots, with substantial pH gradients between soil water, the rhizosphere, and the apoplast of the root cortex (Felle, 2001). It should be noted that extracellular acidification is an inevitable consequence of ammonium nutrition under both controlled culture conditions (Escobar et al., 2006) and field conditions (Ruan et al., 2000), so ammonium-associated pH signaling is not a unique feature of our experimental design. Alternatively, some ammonium-induced genes (e.g. GDH2, MIOX4, nodulin At2g39510) appear to be regulated by glutamate/glutamine (as demonstrated by MSX sensitivity). However, because these genes are not upregulated by nitrate addition, the nitrate ion may act as a negative regulator of their expression. A similarly complex and antagonistic relationship between signals derived from organic nitrogen and signals derived from inorganic nitrogen was also described by Gutierrez et al. (2008). This study identified nearly 100 genes in A. thaliana that were transcriptionally regulated by inorganic nitrogen (nitrate and ammonium) only when the synthesis of organic nitrogen (glutamate) was blocked by the application of MSX. Thus, it appears that specific forms of inorganic nitrogen can interfere with regulatory signals derived from organic nitrogen (this study), and that organic nitrogen can interfere with regulatory signals elaborated from inorganic nitrogen (Gutierrez et al., 2008).
Supplementary Material
Supplemental Table S1. Primers used for real-time PCR analysis
Supplemental Table S2. List of genes exclusively regulated by nitrate
Supplemental Table S3. List of genes exclusively regulated by ammonium
Supplemental Table S4. List of genes regulated by both ammonium and nitrate
Supplemental Table S5. BioMaps analysis of nitrate-specific gene sets
Supplemental Table S6. BioMaps analysis of ammonium-specific gene sets
Supplemental Table S7. BioMaps analysis of general inorganic nitrogen gene sets
Supplemental Table S8. “Core” set of nitrate-specific genes
Supplemental Figure S1. MapMan analysis of nitrate-specific gene set (8 h)
Supplemental Figure S2. MapMan analysis of ammonium-specific gene set (8 h)
Supplemental Figure S3. NAD(H) and NADP(H) pool sizes and oxidation states in the roots of ammonium- and nitrate-supplied plants
Supplemental Figure S4. Ascorbate pool size and oxidation state in the roots of ammonium-and nitrate-supplied plants
Supplemental Figure S5. Glutathione pool size and oxidation state in the roots of ammonium-and nitrate-supplied plants
Supplemental Figure S6. Nitrate reductase activity in the roots of ammonium- and nitrate-supplied plants
Acknowledgments
This work was supported by Award Number SC3GM084721 (to M.A.E) from the National Institute of General Medical Sciences. The content is solely the responsibility of the authors and does not necessarily represent the official views of the National Institute of General Medical Sciences or the National Institutes of Health. The project was also supported by the Swedish Research Council grants 623-2007-1224 and 621-2006-4597 to I.L. and A.G.R. We thank Lana Schaffer (The Scripps Research Institute DNA Array Core Facility) and William Kristan (California State University San Marcos) for assistance with statistical analyses. We are also grateful to Ryan Upham (California State University San Marcos) for technical assistance. Microarray hybridizations were performed by The Scripps Research Institute DNA Array Core Facility.
References
- Beers RF, Sizer IW. A spectrophotometric method for measuring the breakdown of hydrogen peroxide by catalase. Journal of Biological Chemistry. 1952;195:133–140. [PubMed] [Google Scholar]
- Benjamini Y, Hochberg Y. Controlling the false discovery rate - a practical and powerful approach to multiple testing. Journal of the Royal Statistical Society. Series B. 1995;57:289–300. [Google Scholar]
- Bi YM, Wang RL, Zhu T, Rothstein SJ. Global transcription profiling reveals differential responses to chronic nitrogen stress and putative nitrogen regulatory components in Arabidopsis. BMC Genomics. 2007;8:1–17. doi: 10.1186/1471-2164-8-281. [DOI] [PMC free article] [PubMed] [Google Scholar]
- Bi YM, Kant S, Clark J, Gidda S, Ming F, Xu J, Rochon A, Shelp BJ, Hao L, Zhao R, Mullen RT, Zhu T, Rothstein SJ. Increased nitrogen use efficiency in transgenic rice plants over-expressing a nitrogen-responsive early nodulin gene identified from rice expression profiling. Plant, Cell and Environment. 2009;32:1749–1760. doi: 10.1111/j.1365-3040.2009.02032.x. [DOI] [PubMed] [Google Scholar]
- Bloom AJ. Nitrogen as a limiting factor: Crop acquisition of ammonium and nitrate. In: Jackson LE, editor. Ecology in Agriculture. Academic Press; San Diego, USA: 1997. pp. 145–172. [Google Scholar]
- Bloom AJ, Meyerhoff PA, Taylor AR, Rost TL. Root development and absorption of ammonium and nitrate from the rhizosphere. Journal of Plant Growth Regulation. 2003;21:416–431. [Google Scholar]
- Bolstad BM, Irizarry RA, Astrand M, Speed TP. A comparison of normalization methods for high density oligonucleotide array data based on variance and bias. Bioinformatics. 2003;19:185–193. doi: 10.1093/bioinformatics/19.2.185. [DOI] [PubMed] [Google Scholar]
- Boyes DC, Zayed AM, Ascenzi R, McCaskill AJ, Hoffman NE, Davis KR, Gorlach J. Growth stage-based phenotypic analysis of Arabidopsis: A model for high throughput functional genomics in plants. Plant Cell. 2001;13:1499–1510. doi: 10.1105/TPC.010011. [DOI] [PMC free article] [PubMed] [Google Scholar]
- Bradford MM. A rapid and sensitive method for quantitation of microgram quantities of protein utilizing the principle of protein-dye binding. Analytical Biochemistry. 1976;72:248–254. doi: 10.1016/0003-2697(76)90527-3. [DOI] [PubMed] [Google Scholar]
- Bräutigam A, Gagneul D, Weber APM. High-throughput colorimetric method for the parallel assay of glyoxylic acid and ammonium in a single extract. Analytical Biochemistry. 2007;362:151–153. doi: 10.1016/j.ab.2006.12.033. [DOI] [PubMed] [Google Scholar]
- Britto DT, Kronzucker HJ. NH4+ toxicity in higher plants: a critical review. Journal of Plant Physiology. 2002;159:567–584. [Google Scholar]
- Cantu D, Vicente AR, Greve LC, Dewey FM, Bennett AB, Labavitch JM, Powell ALT. The intersection between cell wall disassembly, ripening, and fruit susceptibility to Botrytis cinerea. Proceedings of the National Academy of Sciences USA. 2008;105:859–864. doi: 10.1073/pnas.0709813105. [DOI] [PMC free article] [PubMed] [Google Scholar]
- Cataldo DA, Haroon M, Schrader LE, Youngs VL. Rapid colorimetric determination of nitrate in plant-tissue by nitration of salicylic acid. Communications in Soil Science and Plant Analysis. 1975;6:71–80. [Google Scholar]
- Catoni E, Schwab R, Hilpert M, Desimone M, Schwacke R, Flügge UI, Schumacher K, Frommer WB. Identification of an Arabidopsis mitochondrial succinate-fumarate translocator. FEBS Letters. 2003;534:87–92. doi: 10.1016/s0014-5793(02)03782-1. [DOI] [PubMed] [Google Scholar]
- Chaillou S, Vessey JK, Morotgaudry JF, Raper CD, Henry LT, Boutin JP. Expression of characteristics of ammonium nutrition as affected by pH of the root medium. Journal of Experimental Botany. 1991;42:189–196. doi: 10.1093/jxb/42.2.189. [DOI] [PubMed] [Google Scholar]
- Cramer MD, Lewis OAM. The Influence of NO3− and NH4+ nutrition on the gas exchange characteristics of the roots of wheat (Triticum aestivum) and maize (Zea mays) plants. Annals of Botany. 1993;72:37–46. [Google Scholar]
- Crawford NM, Forde BG. Molecular and developmental biology of inorganic nitrogen nutrition. In: Somerville CR, Meyerowitz EM, editors. The Arabidopsis Book. American Society of Plant Biologists; Rockville, USA: 2002. pp. 1–25. [DOI] [PMC free article] [PubMed] [Google Scholar]
- Dhindsa RS, Plumbdhindsa P, Thorpe TA. Leaf senescence is correlated with increased levels of membrane permeability and lipid peroxidation, and decreased levels of superoxide dismutase and catalase. Journal of Experimental Botany. 1981;32:93–101. [Google Scholar]
- Ding XH, Cao YL, Huang LL, Zhao J, Xu CG, Li XH, Wang SP. Activation of the indole-3-acetic acid-amido synthetase GH3-8 suppresses expansin expression and promotes salicylate- and jasmonate-independent basal immunity in rice. Plant Cell. 2008;20:228–240. doi: 10.1105/tpc.107.055657. [DOI] [PMC free article] [PubMed] [Google Scholar]
- Dunkley TPJ, Hester S, Shadforth IP, Runions J, Weimar T, Hanton SL, Griffin JL, Bessant C, Brandizzi F, Hawes C, Watson RB, Dupree P, Lilley KS. Mapping the Arabidopsis organelle proteome. Proceedings of the National Academy of Sciences USA. 2006;103:6518–6523. doi: 10.1073/pnas.0506958103. [DOI] [PMC free article] [PubMed] [Google Scholar]
- Escobar MA, Geisler DA, Rasmusson AG. Reorganization of the alternative pathways of the Arabidopsis respiratory chain by nitrogen supply: opposing effects of ammonium and nitrate. Plant Journal. 2006;45:775–788. doi: 10.1111/j.1365-313X.2005.02640.x. [DOI] [PubMed] [Google Scholar]
- Falkengren-Grerup U. Interspecies differences in the preference of ammonium and nitrate in vascular plants. Oecologia. 1995;102:305–311. doi: 10.1007/BF00329797. [DOI] [PubMed] [Google Scholar]
- Falkengren-Grerup U, Schöttelndreier M. Vascular plants as indicators of nitrogen enrichment in soils. Plant Ecology. 2004;172:51–62. [Google Scholar]
- Felle HH. pH: Signal and messenger in plant cells. Plant Biology. 2001;3:577–591. [Google Scholar]
- Fizames C, Muños S, Cazettes C, Nacry P, Boucherez J, Gaymard F, Piquemal D, Delorme V, Commes TS, Doumas P, Cooke R, Marti J, Sentenac H, Gojon A. The Arabidopsis root transcriptome by serial analysis of gene expression. Gene identification using the genome sequence. Plant Physiology. 2004;134:67–80. doi: 10.1104/pp.103.030536. [DOI] [PMC free article] [PubMed] [Google Scholar]
- Foyer CH, Halliwell B. Presence of glutathione and glutathione reductase in chloroplasts - proposed role in ascorbic acid metabolism. Planta. 1977;133:21–25. doi: 10.1007/BF00386001. [DOI] [PubMed] [Google Scholar]
- Frechilla S, Lasa B, Aleu M, Juanarena N, Lamsfus C, Aparicio-Tejo PM. Short-term ammonium supply stimulates glutamate dehydrogenase activity and alternative pathway respiration in roots of pea plants. Journal of Plant Physiology. 2002;159:811–818. [Google Scholar]
- Gentleman RC, Carey VJ, Bates DM, Bolstad B, Dettling M, Dudoit S, Ellis B, Gautier L, Ge YC, Gentry J, Hornik K, Hothorn T, Huber W, Iacus S, Irizarry R, Leisch F, Li C, Maechler M, Rossini AJ, Sawitzki G, Smith C, Smyth G, Tierney L, Yang JYH, Zhang JH. Bioconductor: open software development for computational biology and bioinformatics. Genome Biology. 2004;5:R80. doi: 10.1186/gb-2004-5-10-r80. [DOI] [PMC free article] [PubMed] [Google Scholar]
- Gifford ML, Dean A, Gutierrez RA, Coruzzi GM, Birnbaum KD. Cell-specific nitrogen responses mediate developmental plasticity. Proceedings of the National Academy of Sciences USA. 2008;105:803–808. doi: 10.1073/pnas.0709559105. [DOI] [PMC free article] [PubMed] [Google Scholar]
- Goodchild JA, Givan CV. Influence of ammonium and extracellular pH on the amino and organic acid contents of suspension culture cells of Acer pseudoplatanus. Physiologia Plantarum. 1990;78:29–37. [Google Scholar]
- Gutierrez RA, Stokes TL, Thum K, Xu X, Obertello M, Katari MS, Tanurdzic M, Dean A, Nero DC, McClung CR, Coruzzi GM. Systems approach identifies an organic nitrogen-responsive gene network that is regulated by the master clock control gene CCA1. Proceedings of the National Academy of Sciences USA. 2008;105:4939–4944. doi: 10.1073/pnas.0800211105. [DOI] [PMC free article] [PubMed] [Google Scholar]
- Herrera-Estrella L. Transgenic plants for tropical regions: Some considerations about their development and their transfer to the small farmer. Proceedings of the National Academy of Sciences USA. 1999;96:5978–5981. doi: 10.1073/pnas.96.11.5978. [DOI] [PMC free article] [PubMed] [Google Scholar]
- Ho CH, Lin SH, Hu HC, Tsay YF. CHL1 functions as a nitrate sensor in plants. Cell. 2009;138:1184–1194. doi: 10.1016/j.cell.2009.07.004. [DOI] [PubMed] [Google Scholar]
- Hoffmann A, Milde S, Desel C, Humpel A, Kaiser H, Hammes E, Piippo M, Soitamo A, Aro EM, Gerendas J, Sattelmacher B, Hansen UP. N form-dependent growth retardation of Arabidopsis thaliana seedlings as revealed from physiological and microarray studies. Journal of Plant Nutrition and Soil Science. 2007;170:87–97. [Google Scholar]
- Igamberdiev AU, Gardeström P. Regulation of NAD- and NADP-dependent isocitrate dehydrogenases by reduction levels of pyridine nucleotides in mitochondria and cytosol of pea leaves. Biochimica et Biophysica Acta. 2003;1606:117–125. doi: 10.1016/s0005-2728(03)00106-3. [DOI] [PubMed] [Google Scholar]
- Jackson RB, Caldwell MM. Geostatistical patterns of soil heterogeneity around individual perennial plants. Journal of Ecology. 1993;81:683–692. [Google Scholar]
- Katari MS, Nowicki SD, Aceituno FF, Nero D, Kelfer J, Thompson LP, Cabello JM, Davidson RS, Goldberg AP, Shasta DE, Coruzzi GM, Gutierrez RA. VirtualPlant: A software platform to support systems biology research. Plant Physiology. 2010 doi: 10.1104/pp.109.147025. In press. [DOI] [PMC free article] [PubMed] [Google Scholar]
- Krömer S. Respiration during photosynthesis. Annual Review of Plant Physiology and Molecular Biology. 1995;46:45–70. [Google Scholar]
- Liu YJ, Norberg FEB, Szilagyi A, De Paepe R, Åkerlund HE, Rasmusson AG. The mitochondrial external NADPH dehydrogenase modulates the leaf NADPH/NADP(+) ratio in transgenic Nicotiana sylvestris. Plant and Cell Physiology. 2008;49:251–263. doi: 10.1093/pcp/pcn001. [DOI] [PubMed] [Google Scholar]
- Lopes MS, Araus JL. Comparative genomic and physiological analysis of nutrient response to NH4+, NH4+: NO3− and NO3− in barley seedlings. Physiologia Plantarum. 2008;134:134–150. doi: 10.1111/j.1399-3054.2008.01114.x. [DOI] [PubMed] [Google Scholar]
- Miller AJ, Cramer MD. Root nitrogen acquisition and assimilation. Plant and Soil. 2005;274:1–36. [Google Scholar]
- Mockler TC, Michael TP, Priest HD, Shen R, Sullivan CM, Givan SA, McEntee C, Kay SA, Chory J. The diurnal project: Diurnal and circadian expression profiling, model-based pattern matching, and promoter analysis. Cold Spring Harbor Symposia on Quantitative Biology. 2007;72:353–363. doi: 10.1101/sqb.2007.72.006. [DOI] [PubMed] [Google Scholar]
- Møller IM. Plant mitochondria and oxidative stress: Electron transport, NADPH turnover, and metabolism of reactive oxygen species. Annual Review of Plant Physiology and Molecular Biology. 2001;52:561–591. doi: 10.1146/annurev.arplant.52.1.561. [DOI] [PubMed] [Google Scholar]
- Muños S, Cazettes C, Fizames C, Gaymard F, Tillard P, Lepetit M, Lejay L, Gojon A. Transcript profiling in the chl1-5 mutant of Arabidopsis reveals a role of the nitrate transporter NRT1.1 in the regulation of another nitrate transporter, NRT2.1. Plant Cell. 2004;16:2433–2447. doi: 10.1105/tpc.104.024380. [DOI] [PMC free article] [PubMed] [Google Scholar]
- Noctor G, Foyer CH. A re-evaluation of the ATP: NADPH budget during C3 photosynthesis: A contribution from nitrate assimilation and its associated respiratory activity? Journal of Experimental Botany. 1998;49:1895–1908. [Google Scholar]
- Pandey SP, Somssich IE. The role of WRKY transcription factors in plant immunity. Plant Physiology. 2009;150:1648–1655. doi: 10.1104/pp.109.138990. [DOI] [PMC free article] [PubMed] [Google Scholar]
- Pasqualini S, Ederli L, Piccioni C, Batini P, Bellucci M, Arcioni S, Antonielli M. Metabolic regulation and gene expression of root phosphoenolpyruvate carboxylase by different nitrogen sources. Plant Cell and Environment. 2001;24:439–447. [Google Scholar]
- Pawlowski K. Nodule-specific gene expression. Physiologia Plantarum. 1997;99:617–631. [Google Scholar]
- Planchet E, Kaiser WM. Nitric oxide production in plants. Plant Signaling and Behavior. 2006;1:46–51. doi: 10.4161/psb.1.2.2435. [DOI] [PMC free article] [PubMed] [Google Scholar]
- Queval G, Noctor G. A plate reader method for the measurement of NAD, NADP, glutathione, and ascorbate in tissue extracts: Application to redox profiling during Arabidopsis rosette development. Analytical Biochemistry. 2007;363:58–69. doi: 10.1016/j.ab.2007.01.005. [DOI] [PubMed] [Google Scholar]
- Rahayu YS, Walch-Liu P, Neumann G, Romheld V, von Wiren N, Bangerth F. Root-derived cytokinins as long-distance signals for NO3−-induced stimulation of leaf growth. Journal of Experimental Botany. 2005;56:1143–1152. doi: 10.1093/jxb/eri107. [DOI] [PubMed] [Google Scholar]
- Rawat SR, Silim SN, Kronzucker HJ, Siddiqi MY, Glass ADM. AtAMT1 gene expression and NH4+ uptake in roots of Arabidopsis thaliana: evidence for regulation by root glutamine levels. Plant Journal. 1999;19:143–152. doi: 10.1046/j.1365-313x.1999.00505.x. [DOI] [PubMed] [Google Scholar]
- Redinbaugh MG, Campbell WH. Nitrate regulation of the oxidative pentose phosphate pathway in maize (Zea mays L.) root plastids: Induction of 6-phosphogluconate dehydrogenase activity, protein and transcript levels. Plant Science. 1998;134:129–140. [Google Scholar]
- Ren QH, Chen KX, Paulsen IT. TransportDB: a comprehensive database resource for cytoplasmic membrane transport systems and outer membrane channels. Nucleic Acids Research. 2007;35:D274–D279. doi: 10.1093/nar/gkl925. [DOI] [PMC free article] [PubMed] [Google Scholar]
- Ruan JY, Zhang FS, Wong MH. Effect of nitrogen form and phosphorus source on the growth, nutrient uptake and rhizosphere soil property of Camellia sinensis L. Plant and Soil. 2000;223:63–71. [Google Scholar]
- Ruffel S, Freixes S, Balzergue S, Tillard P, Jeudy C, Martin-Magniette ML, van der Merwe MJ, Kakar K, Gouzy J, Fernie AR, Udvardi M, Salon C, Gojon A, Lepetit M. Systemic signaling of the plant nitrogen status triggers specific transcriptome responses depending on the nitrogen source in Medicago truncatula. Plant Physiology. 2008;146:2020–2035. doi: 10.1104/pp.107.115667. [DOI] [PMC free article] [PubMed] [Google Scholar]
- Scheible WR, Morcuende R, Czechowski T, Fritz C, Osuna D, Palacios-Rojas N, Schindelasch D, Thimm O, Udvardi MK, Stitt M. Genome-wide reprogramming of primary and secondary metabolism, protein synthesis, cellular growth processes, and the regulatory infrastructure of Arabidopsis in response to nitrogen. Plant Physiology. 2004;136:2483–2499. doi: 10.1104/pp.104.047019. [DOI] [PMC free article] [PubMed] [Google Scholar]
- Schjoerring JK, Husted S, Mäck G, Mattsson M. The regulation of ammonium translocation in plants. Journal of Experimental Botany. 2002;53:883–890. doi: 10.1093/jexbot/53.370.883. [DOI] [PubMed] [Google Scholar]
- Shin R, Berg RH, Schachtman DP. Reactive oxygen species and root hairs in Arabidopsis root response to nitrogen, phosphorus and potassium deficiency. Plant and Cell Physiology. 2005;46:1350–1357. doi: 10.1093/pcp/pci145. [DOI] [PubMed] [Google Scholar]
- Skopelitis DS, Paranychianakis NV, Paschalidis KA, Pliakonis ED, Delis ID, Yakoumakis DI, Kouvarakis A, Papadakis AK, Stephanou EG, Roubelakis-Angelakis KA. Abiotic stress generates ROS that signal expression of anionic glutamate dehydrogenases to form glutamate for proline synthesis in tobacco and grapevine. Plant Cell. 2006;18:2767–2781. doi: 10.1105/tpc.105.038323. [DOI] [PMC free article] [PubMed] [Google Scholar]
- Smyth GK. Limma: Linear models for microarray data. In: Gentleman R, Carrey V, Dudoit S, Irizarry R, Huber W, editors. Bioinformatics and Computational Biology Solutions using R and Bioconductor. Springer; New York, USA: 2004. pp. 397–420. [Google Scholar]
- Somerville CR, Ogren WL. Isolation of Photorespiration Mutants in Arabidopsis thaliana. In: Edelman M, Hallick RB, Chua NH, editors. Methods in Chloroplast Biology. Elsevier Biomedical Press; New York, USA: 1982. pp. 129–138. [Google Scholar]
- Taniguchi M, Taniguchi Y, Kawasaki M, Takeda S, Kato T, Sato S, Tahata S, Miyake H, Sugiyama T. Identifying and characterizing plastidic 2-oxoglutarate/malate and dicarboxylate transporters in Arabidopsis thaliana. Plant and Cell Physiology. 2002;43:706–717. doi: 10.1093/pcp/pcf109. [DOI] [PubMed] [Google Scholar]
- Torres MA, Dangl JL. Functions of the respiratory burst oxidase in biotic interactions, abiotic stress and development. Current Opinion in Plant Biology. 2005;8:397–403. doi: 10.1016/j.pbi.2005.05.014. [DOI] [PubMed] [Google Scholar]
- Upadhyaya A, Sankhla D, Davis TD, Sankhla N, Smith BN. Effect of paclobutrazol on the activities of some enzymes of activated oxygen metabolism and lipid peroxidation in senescing soybean leaves. Journal of Plant Physiology. 1985;121:453–461. [Google Scholar]
- Usadel B, Nagel A, Thimm O, Redestig H, Blaesing OE, Palacios-Rojas N, Selbig J, Hannemann J, Piques MC, Steinhauser D, Scheible WR, Gibon Y, Morcuende R, Weicht D, Meyer S, Stitt M. Extension of the visualization tool MapMan to allow statistical analysis of arrays, display of coresponding genes, and comparison with known responses. Plant Physiology. 2005;138:1195–1204. doi: 10.1104/pp.105.060459. [DOI] [PMC free article] [PubMed] [Google Scholar]
- Walch-Liu P, Neumann G, Bangerth F, Engels C. Rapid effects of nitrogen form on leaf morphogenesis in tobacco. Journal of Experimental Botany. 2000;51:227–237. doi: 10.1093/jexbot/51.343.227. [DOI] [PubMed] [Google Scholar]
- Wang RC, Guegler K, LaBrie ST, Crawford NM. Genomic analysis of a nutrient response in Arabidopsis reveals diverse expression patterns and novel metabolic and potential regulatory genes induced by nitrate. Plant Cell. 2000;12:1491–1509. doi: 10.1105/tpc.12.8.1491. [DOI] [PMC free article] [PubMed] [Google Scholar]
- Wang RC, Okamoto M, Xing XJ, Crawford NM. Microarray analysis of the nitrate response in Arabidopsis roots and shoots reveals over 1,000 rapidly responding genes and new linkages to glucose, trehalose-6-phosphate, iron, and sulfate metabolism. Plant Physiology. 2003;132:556–567. doi: 10.1104/pp.103.021253. [DOI] [PMC free article] [PubMed] [Google Scholar]
- Wang RC, Tischner R, Gutierrez RA, Hoffman M, Xing XJ, Chen MS, Coruzzi G, Crawford NM. Genomic analysis of the nitrate response using a nitrate reductase-null mutant of Arabidopsis. Plant Physiology. 2004;136:2512–2522. doi: 10.1104/pp.104.044610. [DOI] [PMC free article] [PubMed] [Google Scholar]
- Wang RC, Xing XJ, Crawford N. Nitrite acts as a transcriptome signal at micromolar concentrations in Arabidopsis roots. Plant Physiology. 2007;145:1735–1745. doi: 10.1104/pp.107.108944. [DOI] [PMC free article] [PubMed] [Google Scholar]
- Wang RC, Xing X, Wang Y, Tran A, Crawford NM. A genetic screen for nitrate regulatory mutants captures the nitrate transporter gene NRT1.1. Plant Physiology. 2009;151:472–478. doi: 10.1104/pp.109.140434. [DOI] [PMC free article] [PubMed] [Google Scholar]
- Yu XD, Sukumaran S, Marton L. Differential expression of the Arabidopsis Nia1 and Nia2 genes - Cytokinin-induced nitrate reductase activity is correlated with increased Nia1 transcription and mRNA levels. Plant Physiology. 1998;116:1091–1096. doi: 10.1104/pp.116.3.1091. [DOI] [PMC free article] [PubMed] [Google Scholar]
- Zhu GH, Zhuang CX, Wang YQ, Jiang LR, Peng XX. Differential expression of rice genes under different nitrogen forms and their relationship with sulfur metabolism. Journal of Integrative Plant Biology. 2006;48:1177–1184. [Google Scholar]
Associated Data
This section collects any data citations, data availability statements, or supplementary materials included in this article.
Supplementary Materials
Supplemental Table S1. Primers used for real-time PCR analysis
Supplemental Table S2. List of genes exclusively regulated by nitrate
Supplemental Table S3. List of genes exclusively regulated by ammonium
Supplemental Table S4. List of genes regulated by both ammonium and nitrate
Supplemental Table S5. BioMaps analysis of nitrate-specific gene sets
Supplemental Table S6. BioMaps analysis of ammonium-specific gene sets
Supplemental Table S7. BioMaps analysis of general inorganic nitrogen gene sets
Supplemental Table S8. “Core” set of nitrate-specific genes
Supplemental Figure S1. MapMan analysis of nitrate-specific gene set (8 h)
Supplemental Figure S2. MapMan analysis of ammonium-specific gene set (8 h)
Supplemental Figure S3. NAD(H) and NADP(H) pool sizes and oxidation states in the roots of ammonium- and nitrate-supplied plants
Supplemental Figure S4. Ascorbate pool size and oxidation state in the roots of ammonium-and nitrate-supplied plants
Supplemental Figure S5. Glutathione pool size and oxidation state in the roots of ammonium-and nitrate-supplied plants
Supplemental Figure S6. Nitrate reductase activity in the roots of ammonium- and nitrate-supplied plants