Abstract
Two strategies are applied to mimic the ampholytic nature of the surfaces of half-generation PAMAM dendrimers and yet retain the very narrow dispersity inherent of triazine dendrimers. Both strategies start with a monodisperse, single-chemical entity, generation two triazine dendrimer presenting twelve surface amines that is available at the kilogram scale. The first method relies on reaction with methyl bromoacetate. Complete conversion of the surface primary amines to tertiary amines occurs to provide 24 surface esters. Extended reaction times lead to quarternization of the amines while other unidentified species are also present. The resulting polyester can be quantitatively hydrolyzed using 4M aqueous HCl to yield a dendrimer with 12 tertiary amines and 24 carboxylic acids about a hydrophobic triazine core. The second method utilizes Michael additions of methyl acrylate to yield 24 surface esters. This reaction proceeds more rapidly and more cleanly than the former strategy. Hydrolysis of this material proceeds quantitatively using 4M aqueous HCl to yield desired dendrimer. In both cases, MALDI-TOF mass spectrometry provides compelling evidence of reaction progress. Electrophoretic analysis confirms the ampholytic nature of these materials with the former targets having a pI value in the 1.8 < pI < 3.4 range, and the latter having a pI value in the 4.7 < pI < 5.9. These ranges bookend the pH range within which PAMAM dendrimers become zwitterionic, 3.4 < pI < 4.7. The strategy of using monodisperse amine-terminated dendrimer constructs as core offers significant advantage over PAMAM homopolymers including dispersity, ease of characterization and batch-to-batch reproducibility. These triazine dendrimers could ultimately be adopted into materials with applications wherein the demands of purity have hitherto remained unsatisfied.
Keywords: Dendrimers, Triazine, Melamine, PAMAM, Michael reaction, capillary electrophoresis, mass spectrometry
Introduction
The impact of polyamidoamine (PAMAM) dendrimers across diverse fields—including applications in therapeutics1,2, diagnostics3, sensing4, material science5 and catalysis6—since Tomalia’s first report7 cannot be understated. Indeed, PAMAM or Starburst® dendrimers are the most extensively studied family of these materials.8 PAMAM dendrimers are commercially available with amine terminal groups referred to as full-generation dendrimers, or with carboxylate terminal groups referred to as half-generation dendrimers. Full-generation dendrimers can have a cationic or a neutral surface depending on the pH. Half-generation dendrimers have an ampholytic (and under certain pH conditions, zwitterionic) surface. With these materials going into preclinical trials9 precise knowledge of the structural complexity of these dendrimeric nanodevices becomes increasingly important.10 Significant effort has been invested in characterizing these materials using a combination of corroborative methods.11 In general, PAMAM materials exist as highly complex mixtures: the two-step iterative polyamidoamine chemistry utilized in PAMAM dendrimer synthesis introduces the possibility of non-ideal dendrimer growth through a variety of factors that affect the monodispersity of the growing polymer.7 Retro-Michael reactions account for another source of structural heterogeneity.
As an alternative to PAMAM dendrimers, our efforts have been towards providing single-entity dendrimers that can be synthesized reproducibly and with high purity: we use 2,4,6-trichloro-1,3,5-triazine (cyanuric chloride), a low-cost and readily available reagent. Using this chemistry, kilogram-scale synthesis of a generation two triazine dendrimer12 has been reported that used only a single chromatographic step and which provided materials judged conservatively as being approximately 93% pure based on reversed-phase HPLC analysis of the BOC-protected intermediate. Higher purities can be achieved if intermediates are subjected to more rigorous purification than the precipitation strategy utilized in the scale-up procedure. Recently, this material was used in the synthesis of anionic triazine dendrimers derived from the succinylation of generation two and generation three amine-terminated triazine dendrimers.13 Analysis of these materials using capillary electrophoresis (CE) in comparison to the commercially available PAMAM analogues showed a significant difference in molecular heterogeneity: PAMAM dendrimers were highly disperse mixtures whereas triazine dendrimers approached single-chemical-entity materials.
Full-generation (amine terminated) and half-generation (carboxylate terminated) PAMAM dendrimers have shown markedly different behavior in biological applications: in a report by Malik et al., amine-terminated PAMAM dendrimers displayed generation-dependent haemolysis and changes in red cell morphology whereas anionic dendrimers were neither haemolytic, nor cytotoxic;14 El-Sayed et al. reported increased paracellular permeability within a “size window” of generation 2.5 and 3.5 PAMAM carboxylate terminated dendrimers;15 an investigation on the effect of PAMAM dendrimers on planar phosphatidyl choline membranes by Shcharbin et al.16 showed that cationic PAMAM generation 5 dendrimer disrupted the membranes whereas carboxylate-terminated PAMAM generation 4.5 dendrimer did not. From these demonstrated examples, and many more, it is evident that the surface chemistry and topology of dendrimers is a critical parameter in their applications-based utility.
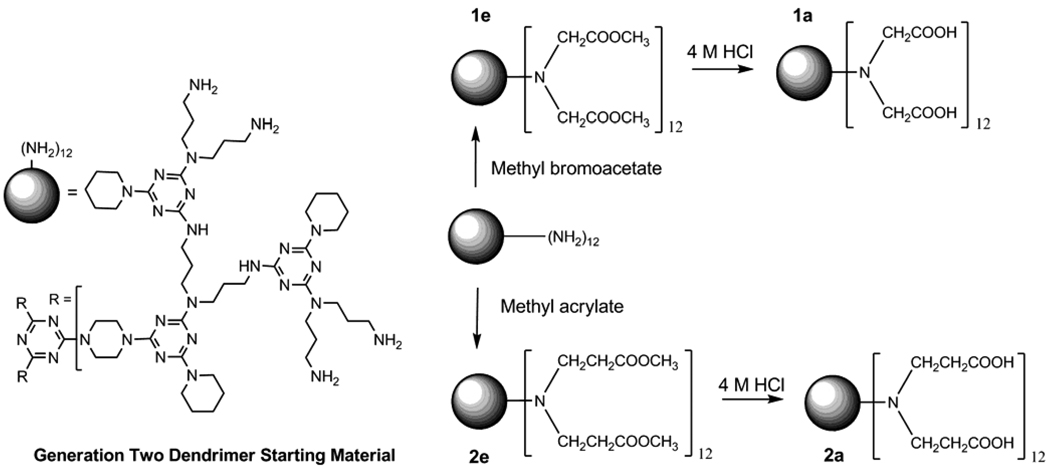
In this manuscript we report the synthesis and characterization of ampholytic triazine dendrimers obtained using two strategies. The first scheme involves reacting methyl bromoacetate with generation two amine-terminated triazine dendrimer, followed by exhaustive hydrolysis of the ester groups. Two hydrolysis conditions are tested: use of 4M HCl and 5M NaOH, both at room temperature. The rates of ester hydrolysis and purity of final products in the tested conditions are compared. Overall, the first scheme yields a triazine dendrimer bearing 24 acetate groups. Similarly, in the second scheme, generation two amine-terminated triazine dendrimer is reacted with methyl acrylate via Michael addition to result in a material with 24 surface ester groups. Subsequent hydrolysis of this material was affected in 4M aqueous HCl and 5M NaOH. Overall, the second scheme resulted in a triazine dendrimer displaying 24 propionate groups. From our work on the succinylation of triazine dendrimers13 it was observed that progress of the succinylation reaction can be meticulously followed using MALDI-TOF-MS and CE: mass spectrometry identifies the species present in the mixture at the end of the reaction and CE provides quantitative information on purity. As such, the synthesis of the ester-bearing intermediates and the carboxylate-bearing final products was closely monitored using MALDI-TOF-MS. Purity and molecular heterogeneity assessments were obtained using CE and were compared with commercially available PAMAM analogues. PAMAM dendrimers with the DAB (diaminobutane) core were selected for comparison instead of EDA (ethylenediamine) core analogues because of their inherent interest to the group, their broader spectrum of use, and lower dispersity as indicated by slab gel electrophoresis in the available product literature.
Experimental Section
Materials
All reagents and solvents needed in the synthesis and the analysis of triazine dendrimers were purchased from Aldrich Chemical Company (Milwaukee, WI, USA) and were used as received. Uncoated fused silica capillaries were purchased from Polymicro Technologies, LLC, (Phoenix, AZ). Commercial half-generation, diaminobutane-core PAMAM carboxylate dendrimers were also purchased from Aldrich Chemical Company. The second generation triazine dendrimer used in this work was synthesized in our laboratory as previously reported.12
Synthesis of tetraicosa-acetate triazine dendrimer 1e
A solution of the generation two amine-terminated triazine dendrimer was prepared by dissolving 50.0 mg (0.0169 mmol) of the solids into 2.0 mL of the appropriate solvent (methanol or tetrahydrofuran). To this, methyl bromoacetate (37.2 mg, 22.4 µL, 0.244 mmol) corresponding to 1.2 mole equivalents per NH2, was added. The reaction mixture was allowed to stir at room temperature for 2 hours. Formation of white precipitate was observed (presumably the hydrobromide salt of the partially substituted dendrimer). Then, 68.7 µL of a separately-prepared methanolic solution of potassium hydroxide (prepared by dissolving 206 mg of solid potassium hydroxide in 1.0 methanol under rigorous stirring) was added to the dendrimer-containing reaction mixture. The mixture was stirred at room temperature and sample was taken for analysis by MALDI-TOF-MS after 14 hours of reaction time. Further additions of 1.2 mole equivalents of methyl bromoacetate per NH2 were required, each one accompanied by the addition of 68.7 µL of the methanolic potassium hydroxide solution. Progress of the reaction was monitored using MALDI-TOF-MS. A total of 8.4 mole equivalents of methyl bromoacetate per NH2 had been added when signals corresponding to 25- and 26-ester-bearing dendrimers were observed along with the desired 24-ester-bearing species, along with signals corresponding to incompletely substituted dendrimers.
An aliquot of the reaction mixture corresponding to 10.0 mg of dendrimer was taken, and the solvent was removed under reduced pressure. The glassy material that remained was dissolved in 400 µL of 4M HCl and allowed to react at room temperature. Progress of the hydrolysis reaction was monitored using MALDI-TOF-MS. A 200 µL aliquot of the solution was then transferred into a preconditioned Centricon centrifugal filter device (Amicon Bioseparations) having a regenerated cellulose membrane with a 3,000 molecular weight cut-off. The retained solution was collected and used as is for further analysis.
Synthesis of tetraicosa-propionate triazine dendrimer 2e
A solution of the generation two amine-terminated triazine dendrimer was prepared by dissolving 300 mg (0.101 mmol) of the solids into 5.0 mL of methanol under constant stirring. To this solution, 252 mg (263 µL, 2.92 mmol) methyl acrylate was added slowly, corresponding to 2 mole equivalents per NH2 and a corresponding 20% mol/mol excess per addition. The reaction mixture was allowed to stir at room temperature. Samples were taken over time and analyzed by MALDI-TOF-MS. Reaction was deemed complete after 3 days of reaction time.
An aliquot of the reaction mixture corresponding to 10.0 mg of dendrimer was taken, and the solvent was removed under reduced pressure. The glassy material that remained was dissolved in 400 µL of 4M HCl and allowed to react at room temperature. Progress of the hydrolysis reaction was monitored using MALDI-TOF-MS which showed complete hydrolysis of the esters within 2 days. A 200 µL aliquot of the solution was then transferred into a preconditioned Centricon centrifugal filter device (Amicon Bioseparations) having a regenerated cellulose membrane with a 3,000 molecular weight cutoff. The retained solution was collected and used for further analysis as is.
Capillary Electrophoresis
A P/ACE MDQ Capillary Electrophoresis System with a Photodiode Array Detector (Beckman-Coulter, Fullerton, CA, USA) was used to obtain all of the CE separations. Uncoated fused silica capillaries were treated according to the coating procedure described by Kaneta et al.17 using poly(vinylpyrrolidone) as a semi-permanent coating. Capillaries used had an internal diameter of 50µm and typical lengths as follows: total length of the capillary, Lt, 30.6 cm; length of the capillary from injection point to the detection window, Ld, 20.7 cm. Lengths Lt and Ld varied from cartridge-to-cartridge by ±0.5 cm.
The different background electrolytes (BGEs) used were made by first preparing a solution of the buffering species of the desired concentration, followed by titration to the desired pH using the titrant in the pure form (as solid or liquid). Further details on the selection of BGE components and preparation are provided as part of the supporting information. Solutions of 0.2–0.5% dimethyl sulfoxide (DMSO) in water were used as the neutral marker. All purity and dispersity analysis were performed using conventional CE protocols (i.e., capillary rinse; pressure injection of sample; optional pressure injection of neutral marker; electrophoresis) whereas determination of pH ranges which bracket the respective isoelectric points of the dendrimers were determined by pressure-mediated capillary electrophoretic (PreMCE) separations.18
MS Characterization
MALDI-TOF mass spectra were performed on a ABI Voyager-DE STR mass spectrometer operating in reflected mode using 2,4,6-trihydroxyacetophenone (THAP) as matrix. When needed, MS data was reprocessed using Origin® 8 and Microsoft Excel software packages.
Computation
Computational results were obtained using the software package Materials Studio (MS) 4.4 (Accelrys, Inc). The dendrimers were built in the fully extended conformation using the dendrimer builder tools in MS. The conformational space of each dendrimer was sampled via 300 Simulated Annealing (SA) cycles over a period of 840 ps using the Forcite Plus program and the polymer consistent force-field (pcff) as implemented in MS 4.4. The SA runs utilized constant volume and temperature (NVT) molecular dynamics (MD) over a temperature range of 300–1000 K using the Nosé thermostat, ΔT = 50K, untruncated atom-based electrostatic and van der Walls interactions, and a time step of 1 fs. The dendrimer was minimized after each annealing cycle, resulting in 300 minimized structures per dendrimer. Electrostatic Potential Maps were generated at the AM1 level of theory using the vamp program as implemented in MS for the lowest energy conformation of each dendrimer obtained from the SA simulations.
Results and Discussion
Nomenclature
Scheme 1 shows the synthesis of the target dendrimers from a previously reported, generation two dendrimer with 12 amine groups. Reaction with methyl bromoacetate yields 1e, a generation 2.5 (adopting the PAMAM nomenclature) hybrid dendrimer wherein the “e” reflects the ester periphery.12 Hydrolysis yields the polyacid, 1a. Similarly, reaction with methyl acrylate yields 2e that is subsequently hydrolyzed to polyacid 2a.
Synthesis of 1e and 1a
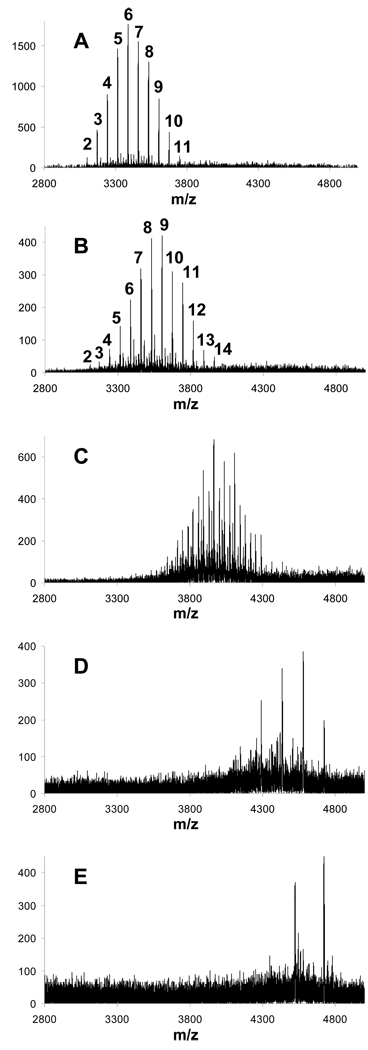
Reaction of the generation two amine-terminated triazine dendrimer with methyl bromoacetate was attempted in two solvents, methanol and tetrahydrofuran. Aliquots were removed to monitor the progress of the reaction by MALDI-TOF-MS. Figure 1 shows the traces obtained for the reaction in methanol. The starting material shows a single line at m/z 2954. Panels A and B capture the reaction at 3 hrs and 7 hrs. The characteristic separation of 72 mass units corresponding to the primary ladder of peaks represents additional “CH2COOCH3” groups. The numbers above the peaks correspond to the number of additions. The suggestion of greater complexity in panel B and clear presence in panel C results from (i) the detection of both proton and potassium adducts and (ii) undesired ester hydrolysis. Potassium adducts are prominent due to the use of KOH as a base in the reaction. Finally, panel D provides clear warning against the over-interpretation of mass data. Here, as a function of ionization conditions, it is possible to obtain spectra that show intermediates wherein only an even number of substitutions have occurred including prominent lines at 18, 20, 22, and the desired 24 substitutions. Optimizing ionization conditions allows for the expected spectra. Curiously, we are unable to suppress the even products in favor of the odd as a function of ionization conditions or matrix. The supporting information details some of these matrix effects, and as a result, we decided to use 2,4,6-trihydroxyacetophenone (THAP) throughout this study. The spectrum shown in panel E reveals a limitation to this chemistry. At increasing reaction times, an additional species that we attribute to a cyclization product (lactam) becomes increasingly abundant.
Figure 1.
MALD-TOF-MS traces for aliquots taken from the reaction mixture for the synthesis of 1e using methanol as the solvent. Number above the peaks represents the number of methyl acetate substitutions on the generation two triazine dendrimer. The corresponding reaction times are as follows: A = 3 hours, B = 1 day, C = 5 days, D = 6 days, E = 11 days.
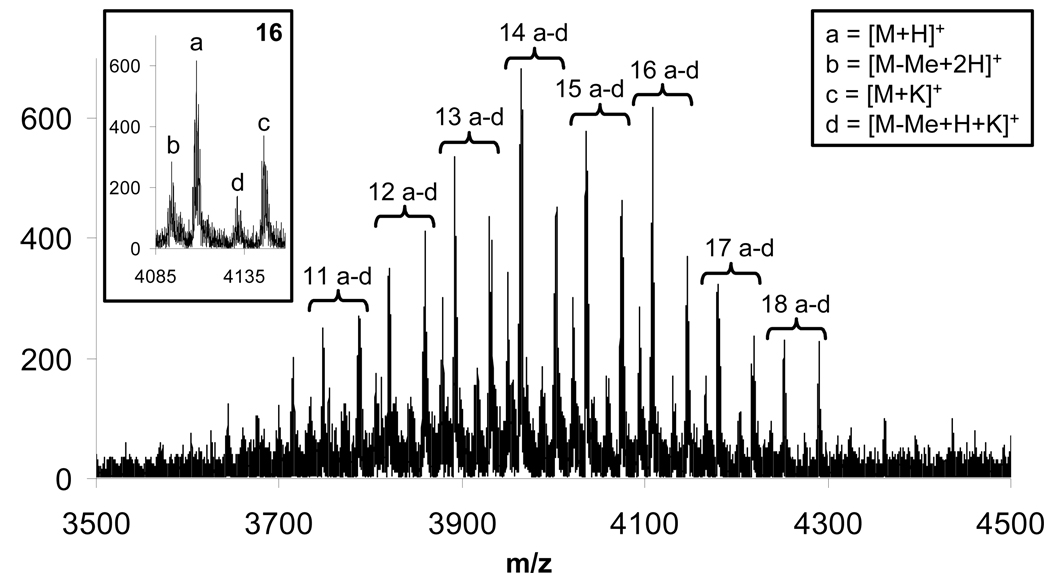
As eluded to, closer inspection of the data reveals an even richer description of the chemistries (Figure 2). Again, numbers above the peaks correspond to the number of methyl acetate units on the molecule. Four signals are observed for each substitution: peaks corresponding to the proton adduct (labeled as a) and potassium adduct (labeled as c) in addition to peaks labeled as b and d at m/z values of 14-less than signals labeled as a and c respectively, corresponding to the loss of a methyl group (hydrolysis). These lines result from the use of a methanolic solution of potassium hydroxide to scavenge the hydrobromic acid produced in the reaction. Another potential side reaction, the substitution of the bromide functionality in the unreacted methyl bromoacetate with a hydroxyl group also occurs. Although this would not affect the number of signals observed in the mass spectrum, the occurrence of such side reaction is evident from the amount of excess reagent required to drive the reaction to completion.
Figure 2.
MALD-TOF-MS trace for an aliquot of the reaction mixture for the synthesis of 1e. The number above the set of peaks represents the number of methyl acetate substitutions on the generation two triazine dendrimer. Legend for the corresponding peaks a-d is indicated as an inset in the spectrum.
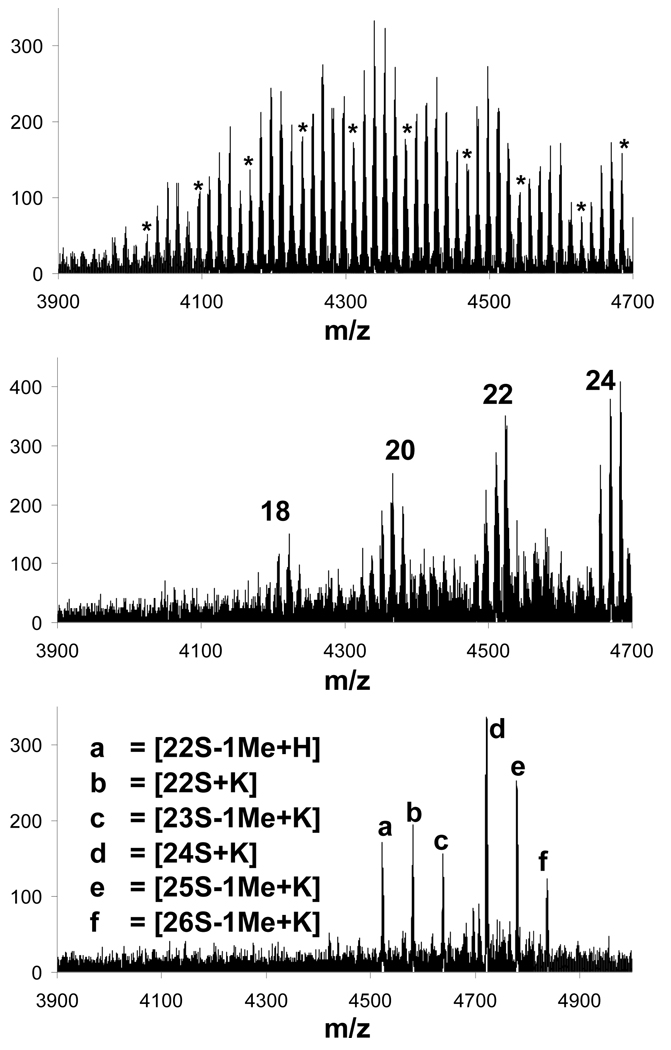
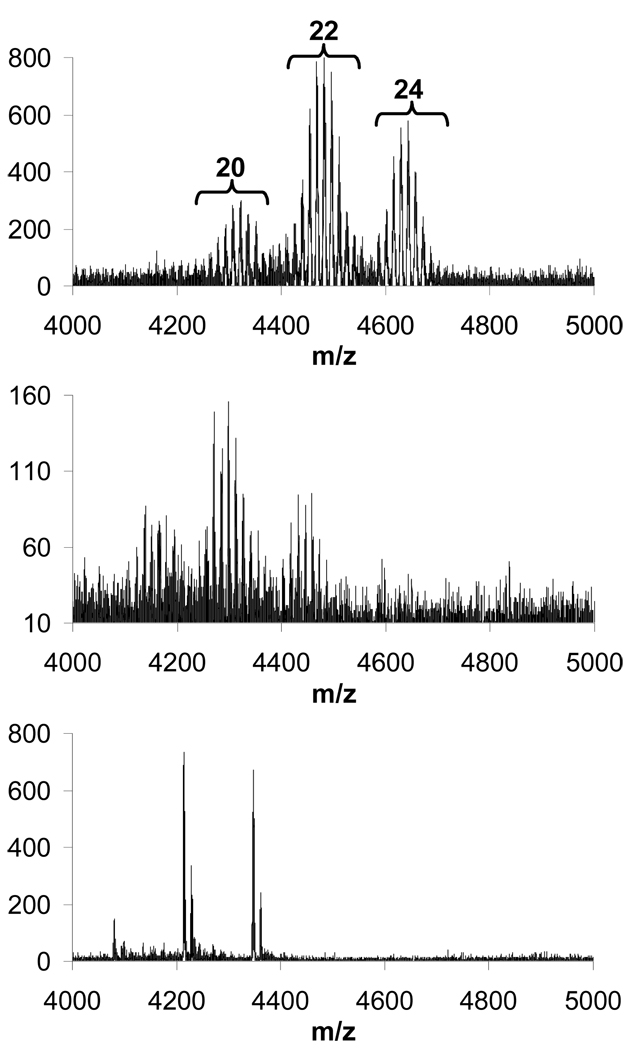
Further, the nature of the chemistry employed does not provide sufficient control over the formation of tertiary amine versus quaternary ammonium bearing products as evident from mass spectra for the reaction in tetrahydrofuran obtained after 5 days of reaction time at room temperature (Figure 3, bottom trace). While complete substitution has not yet been achieved, as revealed by lines corresponding to 22 and 23 methyl acetate substitutions in addition to the desired product, we also observe signals corresponding to products with 1 and 2 quaternary ammonium groups. Just as in the previous case, complicated spectra due to undesired ester hydrolysis (Figure 3, top trace) and varying ionization tendencies are also observed in these samples, as evident from the change in the relative intensities of signals corresponding to species with odd- and even-numbered additions of methyl bromoacetate (top and middle traces in Figure 3).
Figure 3.
MALDI-TOF-MS traces for aliquots taken from the reaction mixture for the synthesis of 1e using tetrahydrofuran as the solvent. Spectrum obtained after 1 day of reaction time (top trace) shows 15–24 substitutions on the generation two triazine dendrimer (marked with “*”) and signals decreasing by steps of m/z = 14 corresponding to increasing ester hydrolysis. Spectrum obtained after 4 days (middle trace) shows prevalent signals for species with even number of substitutions whereas signals for odd number of substitutions seem appear to be disfavored. Spectrum obtained after 5 days (bottom trace) shows products ranging from 22 to 26 substitutions (abbreviated as 22S to 26S), derivatives due to ester hydrolysis and potassium adducts thereof.
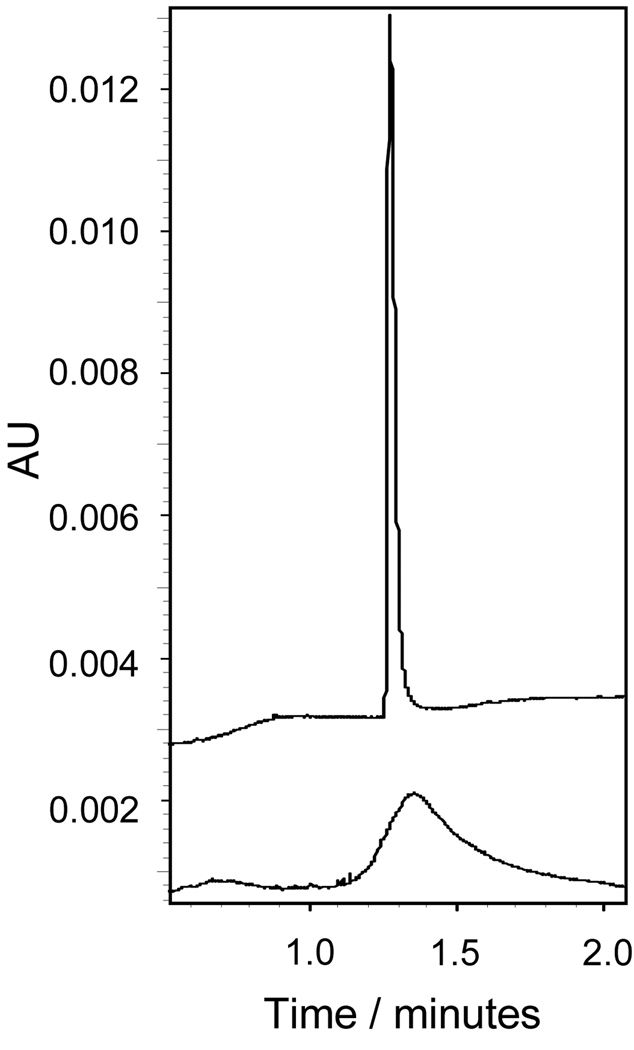
A sample from the tetrahydrofuran-containing reaction mixture was analyzed by capillary electrophoresis, CE, using a pH 3.4, 100mM formate/lithium background electrolyte (BGE). Under these conditions, 1e and other dendrimeric products of the reaction are expected to migrate as cations. Electrophoresis was therefore performed using a positive-to-negative polarity set-up, where the positively charged electrode is placed near the point of injection and the negatively charged electrode is placed near the outlet end of the capillary. The bottom trace in Figure 4 shows the electropherogram. The observed peak width for 1e indicates a more diverse composition than 2e. This is in agreement with results of MALDI-TOF-MS analysis, which indicates the presence of both incompletely substituted dendrimer products and those containing quaternary ammonium groups. Further, CE provides hints towards the structural diversity of this mixture. Due to the use of a pH 3.4 BGE for analysis using CE, resolution between species having a different number of ester groups is not expected, since the cationic character of the molecule does not change (number of charge-bearing amines remains constant). This is also true when quaternary ammonium groups are formed, as even the secondary amines are expected to be fully protonated at a pH of 3.4. However, the cationic character of the dendrimer can decrease by two paths: (i) ester hydrolysis and (ii) amide bond formation with either the free methyl bromoacetate or intramolecular cyclization. In both cases, cations having a migration velocity slightly slower than the desired product 1e will be generated. Incomplete resolution of these dendrimers will result in a greater peak width. We believe both of the mentioned processes contribute to the observed dispersity.
Figure 4.
CE traces for 1e (bottom trace) and 2e (top trace) obtained using a pH 3.4 100mM formate/lithium buffer.
Products from the interrupted synthesis of 1e were subjected to hydrolysis in 4 M HCl solution at room temperature. Aliquots were taken after 1, 4, 10 and 22 days of reaction and analyzed by MALDI-TOF-MS (top, middle and bottom traces respectively shown in Figure 5). After 10 days, significant incomplete hydrolysis of the esters was observed (data not shown) whereas by the 22nd day only the completely hydrolyzed and 1-ester-group-bearing species are observed. The pattern showing dendrimer species with three different degrees of substitution as seen in the initial sample was preserved throughout the course of the hydrolysis reaction. Intentional hydrolysis in 5M NaOH proceeded much more rapidly: complete hydrolysis was observed in two days at room temperature as determined using MALDI-TOF-MS (data shown as part of Figure 9). Overall, it appears unlikely that single-entity triazine dendrimers can be obtained using this chemistry. Nonetheless, as shown in the MS and CE analysis of the final products, the synthesized triazine dendrimers are still of significantly higher purity in comparison with the commercially available PAMAM analogues.
Figure 5.
MALD-TOF-MS traces for aliquots of the reaction mixture wherein 1a is produced from the hydrolysis of the esters of 1e recorded after reaction times of 1 day (top trace), 4 days (middle trace) and 22 days (bottom trace). The spectra reveal different degrees of substitution: sets of signals corresponding to triazine dendrimers with 20, 22 and 24 substitutions are observed. Within each set, peaks separated by an m/z of 14 indicate an increasing number of ester groups still present.
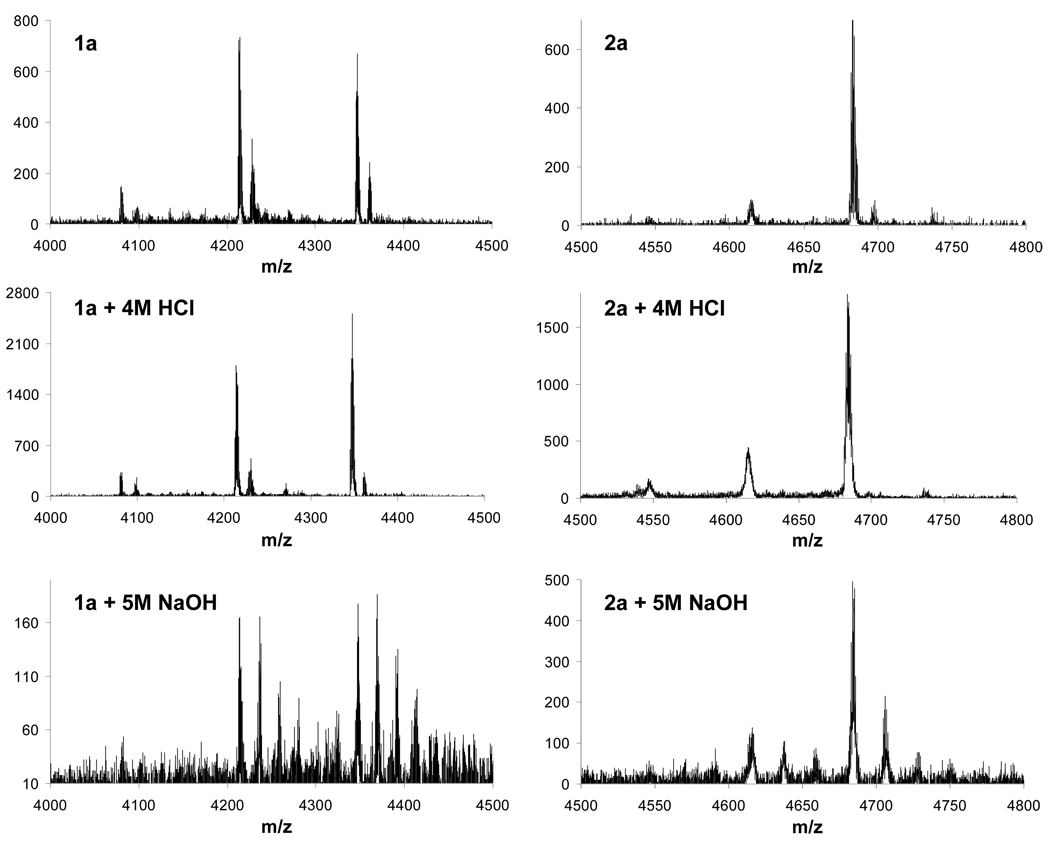
Figure 9.
MALDI-TOF-MS traces for 1a (left) and 2a (right) obtained to determine their stability under relatively harsh conditions: top traces were obtained from samples immediately after hydrolysis of the corresponding ester precursors; middle traces were obtained after storage in 4M HCl and bottom traces were obtained after storage in 5M NaOH (signals in the bottom traces separated by an m/z of 22 result from species with multiple sodium counterions).
Synthesis of 2e and 2a
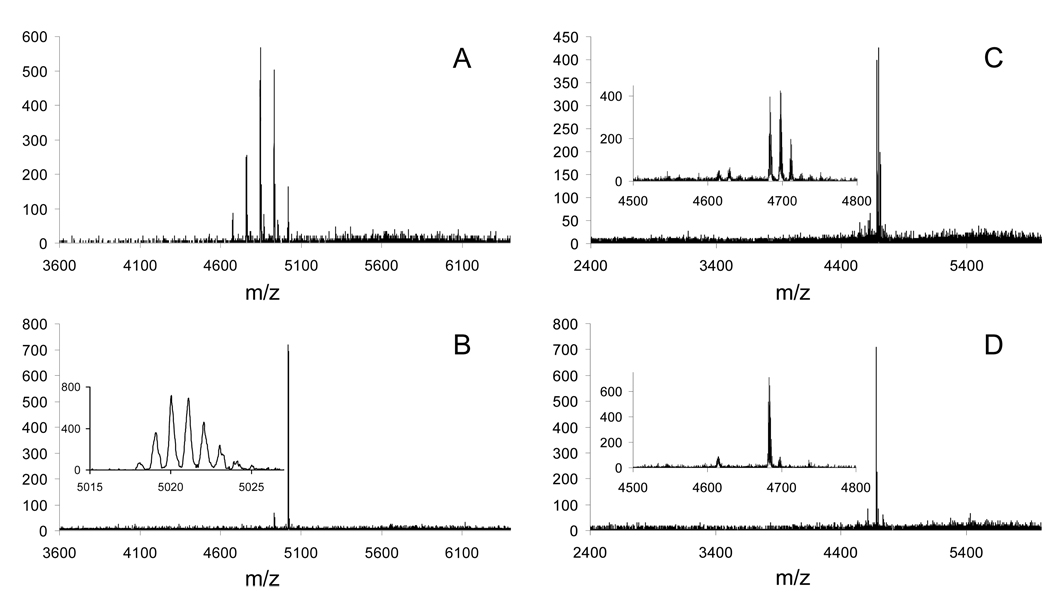
While reaction with methyl bromoacetate produces materials that resemble the structure of PAMAM dendrimers, using methyl acrylate exactly mirrors PAMAM chemistry. Indeed, the strategy proves remarkably clean and straightforward. Samples of the reaction between the triazine dendrimer and methyl acrylate were analyzed over a 3-day period using MALDI-TOF-MS. Figure 6 shows the traces that were obtained. As a consequence of starting with a well-characterized amine-terminated dendrimer, the addition of each methyl acrylate unit onto the dendrimer can be observed (panel A recorded after 1 day of reaction time). Mass spectrum obtained after a 3 days at room temperature is very simple and easy to interpret: one major signal corresponding to a dendrimer 2e with 24 propionate esters and two minor signals corresponding to species with 22 and 23 substitutions (panel B).
Figure 6.
MALD-TOF-MS traces for aliquots of the reaction mixture for the synthesis of 2e (panels A and B) and for the synthesis of 2a (panels C and D). Peaks in panel A are separated by an m/z of 86 indicating an increasing number of methyl acrylate additions; panel B shows dendrimer with 23 and 24 additions. Inset in panel C shows peaks separated by an m/z of 14 indicating incomplete hydrolysis of the ester groups. Lastly, panel D shows two peaks separated by an m/z of 72, indicating products with 23 and 24 carboxylic acids.
This choice of chemistry offers several advantages. First, due to the nature of the Michael reaction, addition of base to the reaction is not required, and as such, hydrolysis of the ester groups is not observed. Also, a large excess of the active reagent (methyl acrylate) is not needed: the reaction proceeds close to completion with just 20% mol/mol excess reagent (per addition) within the 3-day reaction time at room temperature.
A sample of the reaction mixture from the synthesis of 2e was analyzed using CE. Identical conditions to those described earlier were used: a pH 3.4, 100mM formate/ lithium solution as BGE and a positive-to-negative polarity set-up. Under the chosen conditions, the desired product 2e and other products of the reaction are expected to migrate as cations. The bottom panel in Figure 4 shows the obtained electropherogram. The single and narrow peak observed, in comparison to the first derivative, 1e (top panel), must be treated with tempered enthusiasm as there are limitations to this analysis: the method is unable to resolve species having a different number of ester groups. Indeed, MALDI-TOF-MS indicates the presence of dendrimers substituted 22 and 23 times. These derivatives are not resolved by our CE method.
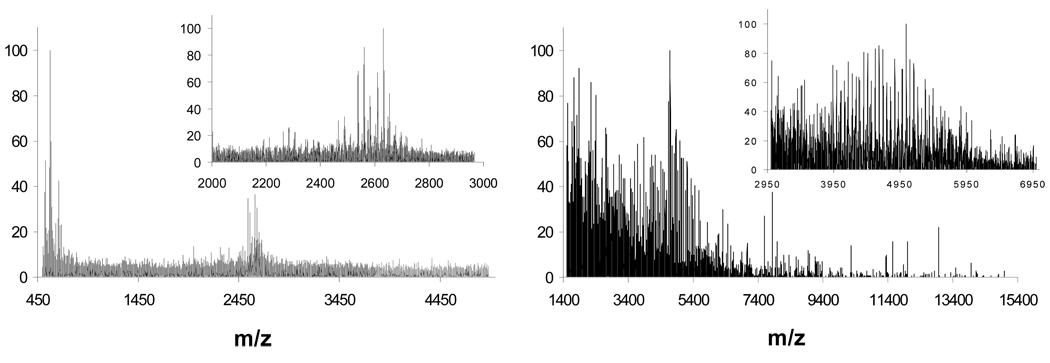
Hydrolysis was affected by a strong acid instead of a strong base to limit retro-Michael reactions. Hydrolysis in 4M HCl solution at room temperature was followed using MALDI-TOF-MS and was found to proceed cleanly: the three-peak-pattern for dendrimers with different number of added methyl acrylates observed prior to hydrolysis was seen in both an intermediate sample (Figure 6, panel C) and the final sample upon complete hydrolysis (Figure 6, panel D). The spectrum for the final sample showed a major signal corresponding to the dendrimer 2a with 24 propanoic groups as well as the side products from the addition, dendrimers now with 22 and 23 acids. These materials prove to be much cleaner than the corresponding PAMAM dendrimers available to us commercially (Figure 7) using both MALDI-MS and capillary electrophoresis (Figure 8).
Figure 7.
MALDI-TOF-MS spectra of generation 1.5 (left panel) and generation 2.5 (right panel) PAMAM analogues bearing 16 and 32 carboxylic acid groups, respectively. The number of carboxylic acid groups is based on an ideal structure and signals with lower mass units observed may be due to structural defects in the dendrimer.
Figure 8.
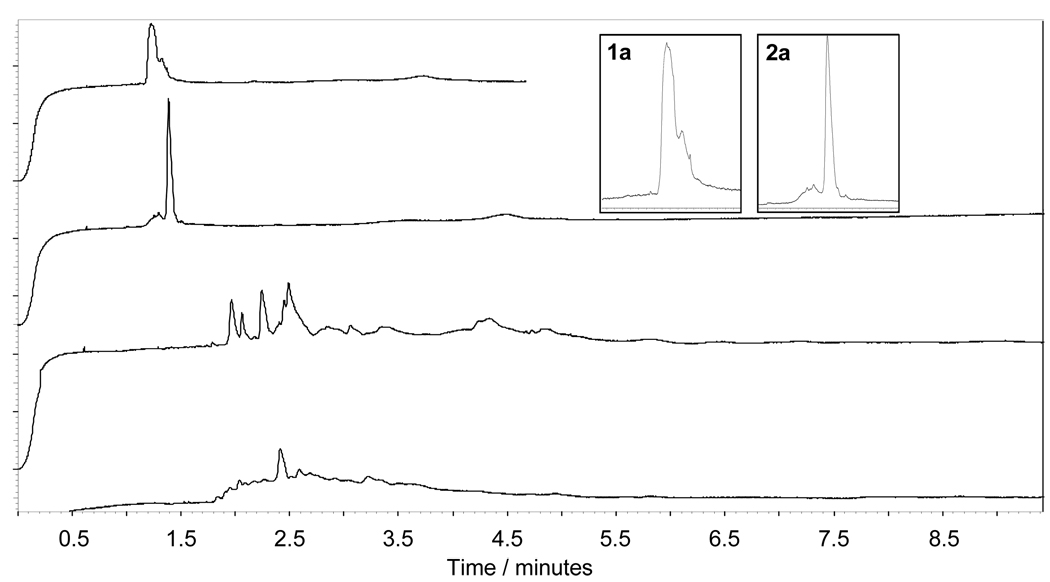
Electropherograms for the dendrimers included in this study obtained using a pH 6.9, 50 mM phosphate/lithium BGE in negative-to-positive polarity: 1a (top trace), 2a (second trace), PAMAM G1.5 (third trace) and PAMAM G2.5 (bottom trace).
Comparison of Dispersity
The dispersity of the synthesized hybrid triazine dendrimers and the commercially available PAMAM analogues was compared by two means: MALDI-TOF-MS and CE. Shown in Figure 7 are the MS traces obtained for generation 1.5 and generation 2.5 diaminobutane core-PAMAM dendrimers. Based on the ideal structure of the dendrimer, signals corresponding to m/z values of 2610 and 5588 are expected for the two materials. However, the obtained MS traces show a significantly greater number of signals in the 2200 to 2800 and the 3400 to 6500 m/z ranges respectively, indicating a complex mixture of dendrimer molecules having a non-ideal structure. The notion that PAMAM analogues of the hybrid triazine dendrimers reported in this work are highly complex mixtures is further corroborated by analysis using CE. Figure 8 shows the electropherograms obtained for the four dendrimers analyzed in this work. Analysis was performed using a pH 6.9, 50 mM phosphate/lithium buffer using negative-to-positive polarity (negatively charged electrode is placed near the injection end of the capillary and positively charged electrode is placed near the outlet end). The choice of BGE was guided by our previous work on the development of a CE method for analysis of anionic dendrimers.13 Unlike the CE analysis for 1e and 2e using a pH 3.4 BGE, here we expect to be able to resolve species based on both a difference in the cationic charge on the dendrimer.
The drastic difference in dispersity between triazine and PAMAM dendrimers is obvious: traces for 1a and 2a (top and second from the top respectively) show a major component and some minor components whereas traces obtained for generation 1.5 and generation 2.5 PAMAM dendrimers (second from the bottom and bottom trace respectively) show a highly complex mixture of species where it becomes difficult to determine which of the observed signals represents the dendrimer having the ideal structure.
We were interested in quantifying the purity of the ideal dendrimer 2a as this proved to be present as the least disperse mixture. Although the pH 6.9 phosphate/lithium buffer provided sufficient resolution, the fear of interference from the “system peak” (a.k.a. eigenpeak) generated close to the dendrimer signals prevented reliable integration. Based on simulation experiments using the Peakmaster software package19 an alternative BGE was determined: a 100 mM, pH 6.5 BisTris/acetate BGE did not generate system peaks with a mobility values close to that of the analyte. Using this BGE, the resolution remained unchanged and the major signal in the trace for dendrimer 2a was found to integrate to a corrected area of ∼80% relative to the other observed signals (data not shown). Integration of signals was not relevant for the other derivatives due to the dispersity and/or low resolution of the signals, and was thus further analysis on these samples was not performed.
Comparison of Stability
Peterson et al. showed that PAMAM half-generation dendrimers are highly susceptible to degradation in the 50°C to −15°C temperature range.20 Our objective was to determine the structural integrity of the synthesized hybrid dendrimers in two extremely harsh conditions: 4M aqueous HCl solution and 5M NaOH solution. Shown in Figure 9 are the MS traces obtained for the two samples. Each panel has been labeled to indicate the corresponding dendrimer and consists of three traces representing: initial sample (top), sample stored in 4M HCl (middle trace) and sample stored in 5M NaOH (bottom trace). It is evident from the preserved three-species-pattern, based on the number of substitutions on the triazine core, for the hybrid dendrimer 1a that noticeable degradation has not occurred in either of the two conditions. In the case of the hybrid triazine dendrimer 2a, species corresponding to less than 22 substitutions are not observed, and only a slight change in the relative intensities of signals is seen, regardless of whether the sample was stored for 21 days in 4M HCl (middle trace) or for 3 days in 5M NaOH (bottom trace), although the latter conditions lead to multiple sodiated species. The slight change in relative intensities may be due to the conditions favoring degradation via retro-Michael reactions or may simply be an artifact attributed to possible changes in the efficiency of ionization in MS.
Comparison of pI values
To rapidly compare the pI values of 1a and 2a with their PAMAM analogues, the method of Glukhovskiy and Vigh21 was adopted, where pressure-mediated CE (PreMCE) was used to determine the mobility of the dendrimers in BGEs having different pH values. Both the effective mobility of the analyte and the mobility due to the electroosmotic flow can be calculated from the traces obtained using this method. However, since the objective was to compare the charge state of these dendrimers under different pH conditions, a simple determination of whether the analyte band was moving as an anion or as a cation suffices. The charge state on the dendrimer can be inferred from the direction in which it migrates with respect to a neutral marker as a result of the applied potential: under our chosen conditions, if the distance between the bands increases, it can be inferred that the analyte migrated as a cation. If the opposite is true, the analyte migrated as an anion. Additional details of the technique are provided in the supporting information.
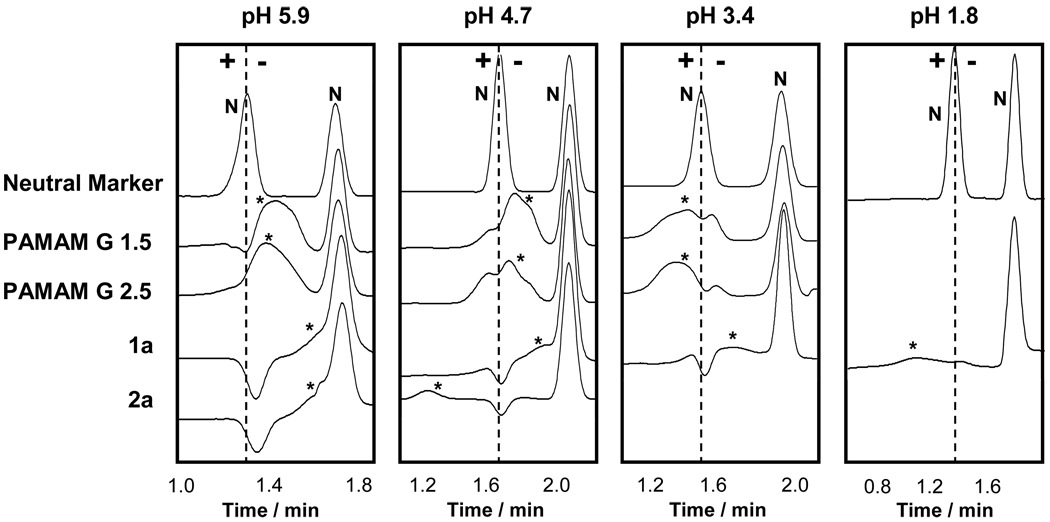
Our previous work13 established that half-generation PAMAM dendrimers migrate as anions at pH 6.9. Accordingly, we expect pI values for these dendrimers and their triazine analogues to be less than 6.9. The mobility of these dendrimers under varying conditions using BGEs with pH values of 1.8, 3.4, 4.7 and 5.9 were determined (details as to the formulation of the BGEs are given in the supporting information). Figure 10 shows the obtained PreMCE traces (only relevant portions shown), separated into panels corresponding to the BGE used. Each trace consists of two signals: the first trace in each panel shows two signals corresponding to two distinct neutral marker bands within the capillary whereas the first signal in succeeding traces corresponds to the dendrimer being analyzed and the second signal corresponds to the neutral marker acting as a mobility reference. A common artifact in all of the traces is a “system peak” (a.k.a. eigenpeak) which appears at the same location as a neutral marker. In the presence of a neutral marker, this artifact is not observed, however, in the absence of a neutral marker (as in the case of the dendrimer samples) this system peak appears as a dip overlapping with the signal corresponding to the dendrimer making it appear as if the analyte band was split with some of the components migrating as cations and others as anions.
Figure 10.
Traces obtained using Pressure-Mediated Capillary Electrophoresis for PAMAM and triazine dendrimers at different pH values: pH 5.9 (first panel), pH 4.7 (second panel), pH 3.4 (third panel) and pH 1.8 (fourth panel). Neutral marker signals are labeled as “N”; dendrimer signals are labeled with an “*”. Dashed line from the centroid of the first neutral marker in the first trace of each panel serves as a guide: analytes that migrate to the left of the line migrate as cations, those migrating to the right migrate as anions. The dip observed in-line with the first neutral marker results from a co-migrating system peak.
Traces that were obtained using a pH 5.9 BGE are shown in the first panel from the left. All of the dendrimers migrate as anions. When a pH 4.7 BGE is used (second panel from the left), triazine dendrimer 2a migrates as a cation, whereas all other dendrimers continue to migrate as anions, indicating the pI for 2a is in the 4.7 < pI < 5.9 range. Use of a pH 3.4 BGE (third panel) places the pI value for the PAMAM dendrimers in the 3.4 < pI < 4.7 since PAMAM dendrimers migrate as cations in this BGE. Triazine dendrimer 1a migrates as an anion in BGEs with pH values above 3.4, and migrates as a cation in a pH 1.8 BGE (shown in the last panel) and so its pI value must fall within the 1.8 < pI < 3.4 range. Having such low pI values is an important property for these dendrimers as this results in a net-anionic charge on the respective dendrimers under neutral conditions, bestowing upon them high aqueous solubility, such as that observed for many proteins with pI values greater than or less than 7 (e.g., human albumin, a common protein in serum has a pI of 4.722).
The difference in pI values between the different dendrimers can be explained based on the structure of the molecules. Based on the difference between the pKa values for the carboxylic acids of glycine (2.36)23 and β-alanine (3.53)23 triazine dendrimer 1a is expected to have the lowest pI value among all of the dendrimers tested. The two PAMAM dendrimers are expected to have similar pI values: the ratio of the number of carboxylic acids to the number of amines remains the same and the pKa values for both the carboxylic acids and amines are not expected to be significantly different. The triazine dendrimer 2a however is expected to have a higher pI value than the PAMAM dendrimers due to the additional contribution to the basic (and cationic) character of the dendrimer coming from the protonation of the triazine ring nitrogens (pKa for the ring nitrogens of melamine, a model compound, is 5.124).
Computation
To complete this comparison of PAMAM and hybrid triazine dendrimers, computation analyses were performed. Table 1 summarizes the results of these studies as well as a summary of other physical characteristics. All four molecules are sufficiently small that the red core (triazine or diaminobutane) groups have access to the surface. The acid groups on the periphery are shown in green and hydrogen-bonding interactions between these groups as well as with the backbone are observed. Both the gas-phase diameters of these species the amount of free volume within the structure is visually similar. The calculated radii of gyration (reported as diameter) corroborate this expectation, although G1.5 PAMAM is a flattened structure that leads to a smaller number. This porosity is perhaps the only clue to the non-proteinaceous (that is, well-organized and tightly packed) nature of these macromolecules. Triazine groups of the hybrid dendrimers are readily evident in yellow/orange hues on the electrostatic potential maps. The high degree of similarity in these structures leads us to hypothesize that these hybrid dendrimers could serve as well-defined surrogates for low generation PAMAM materials. This similarity, however, must be taken with some caution, as it derives from gas-phase calculations. While valuable, these calculations invariably lead to densely packed structures that may not adequately communicate differences in solution. Such differences might be expected due to the different hydrophobicity of the interiors of the hybrid and native PAMAM structures. In preliminary studies, we have established that the relative accessibility of the peripheral groups is similar as judged by synthetic transformation: In due course, studies of elaboration of these hybrid structures with additional layers of PAMAM chemistry will be communicated.
Table 1.
Summary of physical and computational data. The cores of the dendrimers are shown in red and the terminal carboxylic acid groups shown in green. Stick representations show the lowest energy structure obtained from the SA calculations. AM1 electrostatic potential maps range from –0.2 kcal/mol (red) to 0.2 kcal/mol (blue) mapped on the 0.02 Å−3 electron density surface. The number of amine and carboxylate groups are based on idealized structures for the targets. Triazinyl amines are counted to include the exocyclic nitrogen and aromatic ring nitrogen as a single unit, a strategy that undercounts the nitrogen atoms by 2×, but may overcount proton-accepting sites by 3× if the triazine unit is only protonated once.
| Cmpd: 1a | 2a | PAMAM 1.5 | PAMAM 2.5 |
|---|---|---|---|
 | |||
 | |||
| 3o Amines: 12 | 3o Amines: 12 | 3o Amines: 14 | 3o Amines: 30 |
| Triazinyl: 30 | Triazinyl: 30 | ||
| COOH: 24 | 24 | 16 | 32 |
| 1.8< pI < 3.4 | 4.7 < pI < 5.9 | 3.4 < pI < 4.7 | 3.4 < pI < 4.7 |
| Dia.: 1.8 nm | 1.9 nm | 1.5 nm | 2.0 nm |
Conclusion
Two high-purity triazine dendrimers that mimic the ampholytic surface of half-generation PAMAM dendrimers have been synthesized. Capillary electrophoresis and MALDI-TOF-MS have been successfully employed in monitoring the progress of the reactions and determination of purity and dispersity. Capillary electrophoresis was also used to determine the pH range within which fall the pI values of the respective dendrimers. Of the two new hybrid dendrimers, the tetraicosa-propionate triazine dendrimer, 2a, appears to be the preferred choice: the design exactly mirrors that of PAMAM dendrimers, synthesis proceeds with relative ease and final products are of significantly higher purity, approaching single entity systems. Although the synthesis of the tetraicosa-acetate triazine dendrimer, 1a, proceeds with more difficulty and results in a mixture of products, both capillary electrophoresis and MS confirm the dispersity to be much lower than that of commercially available PAMAM mixtures. Further, having pI values less than 7 provides sufficient aqueous solubility for all of the dendrimers under neutral and/or biological conditions. Overall, we believe the new hybrid triazine-PAMAM dendrimers could serve as alternatives to the widely studied and useful, but highly disperse commercially available PAMAM dendrimers.
Supplementary Material
Acknowledgment
This work was supported by the NIH (U01 5U01AI075351-02; R01 GM64560-07).
Footnotes
Supporting Information Available. This information is available free of charge via the Internet at http://pubs.acs.org.
REFERENCES
- 1.Eichman JD, Bielinska AU, Kukowska-Latallo JF, Baker JR., Jr PSTT. 2000;3:232–245. doi: 10.1016/s1461-5347(00)00273-x. [DOI] [PubMed] [Google Scholar]
- 2.(a) Lim Y, Kim S, Lee Y, Lee W, Yang T, Lee M, Suh H, Park J. J.Am.Chem.Soc. 2001;123:2460–2461. doi: 10.1021/ja005715g. [DOI] [PubMed] [Google Scholar]; (b) Radu DR, Lai C, Jeftinija K, Rowe EW, Jeftinija S, Lin VS-Y. J.Am. Chem. Soc. 2004;126:13216–13217. doi: 10.1021/ja046275m. [DOI] [PubMed] [Google Scholar]; (c) Choi Y, Baker JR., Jr Cell Cycle. 2005;4:669–671. doi: 10.4161/cc.4.5.1684. [DOI] [PubMed] [Google Scholar]
- 3.(a) Dear JW, Kobayashi H, Brechbiel MW, Star RA. Nephron Clin Pract. 2006;103:c45–c49. doi: 10.1159/000090608. [DOI] [PubMed] [Google Scholar]; (b) Xu H, Regino CAS, Koyama Y, Hama Y, Gunn AJ, Bernardo M, Kobayashi H, Choyke PL, Brechbiel MW. Bioconjugate Chem. 2007;18:1474–1482. doi: 10.1021/bc0701085. [DOI] [PubMed] [Google Scholar]; (c) Waengler C, Waengler B, Eisenhut M, Haberkorn U, Mier W. Bioorg Med Chem. 2008;16:2606–2616. doi: 10.1016/j.bmc.2007.11.044. [DOI] [PubMed] [Google Scholar]
- 4.(a) Wells M, Crooks RM. J. Am. Chem. Soc. 1996;118:3988–3989. [Google Scholar]; (b) Oh E, Hong M, Lee D, Nam S, Yoon HC, Kim H. J. Am. Chem. Soc. 2005;127:3270–3271. doi: 10.1021/ja0433323. [DOI] [PubMed] [Google Scholar]; (c) Mynar JL, Lowery TJ, Wemmer DE, Pines A, Frechet JMJ. J. Am. Chem. Soc. 2006;128:3270–3271. doi: 10.1021/ja061735s. [DOI] [PubMed] [Google Scholar]; (d) Das J, Aziz MdA, Yang H. J.Am. Chem. Soc. 2006;128:16022–16023. doi: 10.1021/ja0672167. [DOI] [PubMed] [Google Scholar]; (e) Ajikumar PK, Ng JK, Tang YC, Lee JY, Stephanopoulos G, Too H. Langmuir. 2007;23:5670–5677. doi: 10.1021/la063717u. [DOI] [PubMed] [Google Scholar]
- 5.(a) Watanabe S, Regen SL. J. Am. Chem. Soc. 1994;116:8855–8856. [Google Scholar]; (b) Miller LL, Duan RG, Tully DC, Tomalia DA. J. Am. Chem. Soc. 1997;119:1005–1010. [Google Scholar]; (c) Yin R, Zhu Y, Tomalia DA, Ibuki H. J. Am. Chem. Soc. 1998;120:2678–2679. [Google Scholar]; (d) Kovvali AS, Chen H, Sirkar KK. J. Am. Chem. Soc. 2000;122:7594–7595. [Google Scholar]; (e) Ispasoiu RG, Balogh L, Varnavski OP, Tomalia DA, Goodson T., III J. Am. Chem. Soc. 2000;122:11005–11006. [Google Scholar]; (f) Gehringer L, Bourgogne C, Guillon D, Donnio B. J. Am. Chem. Soc. 2004;126:3856–3867. doi: 10.1021/ja031506v. [DOI] [PubMed] [Google Scholar]
- 6.(a) Chechik V, Zhao M, Crooks RM. J. Am. Chem. Soc. 1999;121:4910–4911. [Google Scholar]; (b) Niu Y, Yeung LK, Crooks RM. J. Am. Chem. Soc. 2001;123:6840–6846. [Google Scholar]; (c) Liu L, Breslow R. J. Am. Chem. Soc. 2003;125:12110–12111. doi: 10.1021/ja0374473. [DOI] [PubMed] [Google Scholar]; (d) Garcia-Martinez JC, Lezutekong R, Crooks RM. J. Am. Chem. Soc. 2005;127:5097–5103. doi: 10.1021/ja042479r. [DOI] [PubMed] [Google Scholar]; (e) Jiang Y, Gao Q. J. Am. Chem. Soc. 2006;128:716–717. doi: 10.1021/ja056424g. [DOI] [PubMed] [Google Scholar]
- 7.Tomalia DA, Baker H, Dewald J, Hall M, Kallos G, Martin S, Roeck J, Ryder J, Smith P. Polymer J. 1985;17:117–132. [Google Scholar]
- 8.Svenson S, Tomalia DA. Adv.Drug Delivery Rev. 2005;57:2106–2129. doi: 10.1016/j.addr.2005.09.018. [DOI] [PubMed] [Google Scholar]
- 9.Myc A, Douce TB, Ahuja N, Kotlyar A, Kukowska-Latallo J, Thomas TP, Baker JR., Jr Anti-cancer drugs. 2008;19:143–149. doi: 10.1097/CAD.0b013e3282f28842. [DOI] [PubMed] [Google Scholar]
- 10.Shi X, Majoros IJ, Baker JR., Jr Mol.Pharmaceutics. 2005;2:278–294. doi: 10.1021/mp0500216. [DOI] [PubMed] [Google Scholar]
- 11.(a) Caminade A-M, Laurent R, Majoral J-P. Adv. Drug Delivery Rev. 2005;57:2130–2146. doi: 10.1016/j.addr.2005.09.011. [DOI] [PubMed] [Google Scholar]; (b) Shi X, Wojciech L, Islam MT, Muniz MC, Balogh LP, Baker JR., Jr Colloids and Surfaces A: Physicochem. Eng. Aspects. 2006;272:139–150. [Google Scholar]
- 12.Chouai A, Simanek EE. J. Org. Chem. 2008;73:2357–2366. doi: 10.1021/jo702462t. [DOI] [PubMed] [Google Scholar]
- 13.Lalwani S, Venditto VJ, Rivera GE, Chouai A, Shaunak S, Simanek EE. Macromolecules. 2009;42:3152–3161. doi: 10.1021/ma802250c. [DOI] [PMC free article] [PubMed] [Google Scholar]
- 14.Malik N, Wiwattanapatapee R, Klopsch R, Lorenz K, Frey H, Weener JW, Meijer EW, Paulus W, Duncan RJ. Controlled Release. 2000;65:133–148. doi: 10.1016/s0168-3659(99)00246-1. [DOI] [PubMed] [Google Scholar]
- 15.El-Sayed M, Ginski M, Rhodes CA, Ghandehari H. J.Bioact.Compat.Polym. 2003;18:7–22. [Google Scholar]
- 16.Shcharbin D, Drapeza A, Loban V, Lisichenok A, Bryszewska M. Cell.Mol.Biol.Lett. 2006;11:242–248. doi: 10.2478/s11658-006-0018-2. [DOI] [PMC free article] [PubMed] [Google Scholar]
- 17.Kaneta T, Ueda T, Hata K, Imasaka T. J Chromatogr.A. 2006;1106:52–55. doi: 10.1016/j.chroma.2005.08.062. [DOI] [PubMed] [Google Scholar]
- 18.Williams BA, Vigh G. Anal.Chem. 1996;68:1174–1180. doi: 10.1021/ac950968r. [DOI] [PubMed] [Google Scholar]
- 19.(a) Gas B, Coufal P, Jaros M, Muzikar J, Jelinek I. J. Chromatogr. A. 2001;905:269–279. doi: 10.1016/s0021-9673(00)00983-3. [DOI] [PubMed] [Google Scholar]; (b) Jaros M, Vcelakova K, Zuskova K, Gas B. Electrophoresis. 2002;23:2667–2677. doi: 10.1002/1522-2683(200208)23:16<2667::AID-ELPS2667>3.0.CO;2-S. [DOI] [PubMed] [Google Scholar]; (c) Gas B. http://www.natur.cuni.cz/gas. [Google Scholar]
- 20.Peterson J, Allikmaa V, Pehk T, Lopp M. Proc.Estonian Acad.Sci.Chem. 2001;50:167–172. [Google Scholar]
- 21.Glukhovskiy P, Vigh G. Electrophoresis. 1998;19:3166–3170. doi: 10.1002/elps.1150191819. [DOI] [PubMed] [Google Scholar]
- 22.Nayak NC, Shin K. Nanotechnology. 2008;19:265603. doi: 10.1088/0957-4484/19/26/265603. [DOI] [PubMed] [Google Scholar]
- 23.Martell AE, Smith RM. Critical Stability Constants Volume 1: Amino Acids. Plenum Press; 1974. pp. 1–20. [Google Scholar]
- 24.Hirt RC, Schmitt RG. Spectrochim.Acta. 1958;12:127–138. [Google Scholar]
Associated Data
This section collects any data citations, data availability statements, or supplementary materials included in this article.


