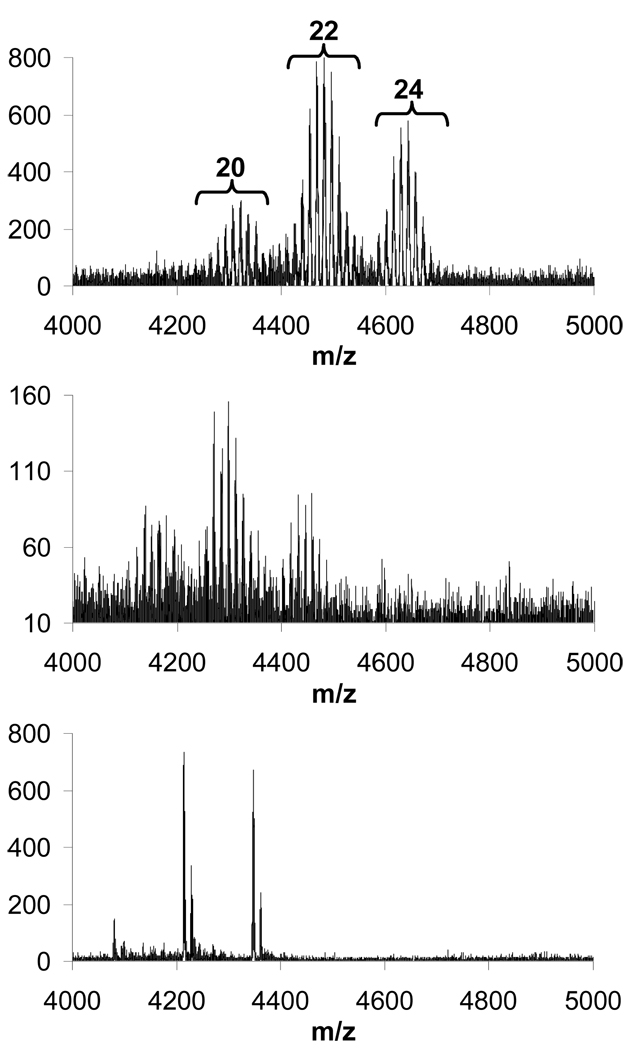
Figure 5.
MALD-TOF-MS traces for aliquots of the reaction mixture wherein 1a is produced from the hydrolysis of the esters of 1e recorded after reaction times of 1 day (top trace), 4 days (middle trace) and 22 days (bottom trace). The spectra reveal different degrees of substitution: sets of signals corresponding to triazine dendrimers with 20, 22 and 24 substitutions are observed. Within each set, peaks separated by an m/z of 14 indicate an increasing number of ester groups still present.

