

Abstract
Vinculin activation plays a critical role in focal adhesion initiation and formation. In its native state, vinculin is in an autoinhibitory conformation in which domain 1 prevents interaction of the vinculin tail domain with actin by steric hindrance. Once activated, vinculin is able to interact with both actin and talin. Several hypotheses have been put forth addressing the mechanisms of vinculin activation. One set of studies suggests that vinculin interaction with talin is sufficient to cause activation, whereas another set of studies suggests that a simultaneous interaction with several binding partners is necessary to achieve vinculin activation. Using molecular-dynamics (MD) simulations, we investigate the mechanisms of vinculin activation and suggest both a trajectory of conformational changes leading to vinculin activation, and key structural features that are likely involved in stabilizing the autoinhibited conformation. Assuming that the simultaneous interaction of vinculin with both actin and talin causes a stretching force on vinculin, and that vinculin activation results from a removal of steric hindrance blocking the actin-binding sites, we simulate with MD the stretching and activation of vinculin. The MD simulations are further confirmed by normal-mode analysis and simulation after residue modification. Taken together, the results of these simulations suggest that bending of the vinculin-binding-site region in vinculin away from the vinculin tail is the likely trajectory of vinculin activation.
Introduction
Cellular response to external stress involves both a passive and an active cytoskeletal rearrangement. External force is transduced through membrane-bound integrin to the cytoskeleton, causing both passive reinforcement via focal adhesion formation and active reinforcement via tyrosine kinase activity (1–3). Focal adhesions are formed at plasma membrane sites of external stress and function as molecular glues cementing the actin filaments (F-actin) to external stress (4–9). The formation of focal adhesion sites is initiated by the formation of a molecular connection between talin (bound to integrin) and F-actin, reinforced by vinculin (10–12). Once the talin-vinculin-F-actin complex is formed, other focal adhesion molecules are recruited to form the molecular glue (13,14). Vinculin null-cells can produce focal adhesions but show significant defects in cell spreading, cell stiffness, cell shape, and regulation of apoptotic cues (15–19).
Vinculin can exist in two conformations: autoinhibited or activated. It is in the activated conformation that vinculin is able to initiate focal adhesion site formation (20). The crystal structure of the autoinhibited conformation shows that vinculin has five major structural domains (Fig. 1 A). Residues 1–252 make up domain 1 (D1) (light green), residues 253–485 make up domain 2 (D2) (purple), residues 493–717 make up domain 3 (D3) (tan), residues 719–839 make up domain 4 (D4) (green), and residues 896–1066 make up the vinculin tail domain (Vt) (orange). Together D1, D2, D3, and D4 constitute the vinculin head domain (Vh). There is also a proline-rich linker region connecting Vh to Vt (yellow) (21). Vinculin has several binding sites, including one for the talin vinculin-binding site (VBS) in D1 and one for F-actin in Vt (22). In its autoinhibitory conformation, vinculin interaction with talin in the VBS binding regions (Fig. 1 B) is limited by the higher affinity interaction between Vt and the VBS binding region (23), whereas interaction with F-actin at the Vt domain is limited by steric hindrance by the VBS binding region (24) (Fig. 1 B). Vt is a five-helix antiparallel bundle. All five of its helices are amphipathic, with the hydrophobic regions pointed inward and the hydrophilic regions pointed outward. However, there is an exposed hydrophobic surface near the interface with domain 1 that is involved in stabilizing the autoinhibited conformation (21). The Vt domain also has two positively charged regions: a basic collar near the C-terminus, and a basic ladder near the center (25) (Fig. 1 B). These positively charged regions have been implicated as binding sites for F-actin (24). In its activated conformation, vinculin can interact with both talin and F-actin.
Figure 1.
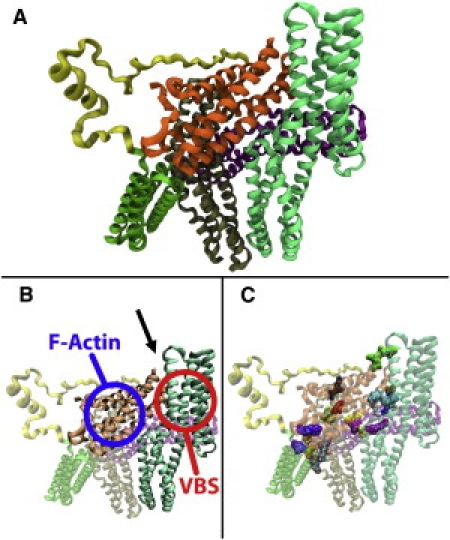
Structure of full-length vinculin. (A) Vinculin has five structural domains: D1, D2, D3, D4, and Vt. (B) Vinculin is suggested to bind talin at its D1 region and F-actin at its Vt region once activated. In its inactive conformation, vinculin is autoinhibited, i.e., D1 of the Vh region sterically inhibits interaction of F-actin with Vt (arrow points to region of steric hindrance). (C) Fourteen salt-bridges between Vt and Vh stabilize the autoinhibitory conformation. Of these, only three are between D1 and Vt, whereas 11 are between Vt and the other Vh domains.
Vinculin interacts critically with talin, and this interaction is potentially able to activate vinculin (20). Initial studies of the VBSs in talin pinpointed three VBSs in the talin rod: residues 607–636, 852–876, and 1944–1969. Early experimental data suggested that all three VBSs are amphipathic α-helices that interact with D1 via hydrophobic residues (26). Later studies showed eight additional talin VBSs, all with properties similar to those of VBS1, VBS2, and VBS3 (27). The VBS regions are cryptic binding sites, and only upon talin activation by external force are the VBS regions exposed for interaction with vinculin (28–31). The interaction between talin VBS and Vh shows high affinity, with Kd values of 14.7 nM for VBS1, 32.8 nM for VBS2, and 3.2 nM for VBS3 (32), but is kinetically slow due to local conformational changes in D1 resulting from VBS binding (33). X-ray crystallization studies have revealed the structure of VBS1 (32,34) and VBS3 (35) with D1. The interaction is mediated by a helical bundle conversion mechanism in D1. A computational simulation of the interaction between VBS and D1 elucidated potential mechanisms of helical bundle conversion: 1), insertion of the VBS hydrophobic patch; 2), movement of two helices in D1 away from VBS; and 3), rotation of the VBS α-helix to form a hydrophobic core with D1 helices (36).
Two competing hypotheses have been proposed to describe the mechanism of vinculin activation: 1), talin binding to D1 is sufficient to activate vinculin (37); or 2), a simultaneous interaction of both talin and F-actin is necessary to achieve activation (i.e., a combinatorial mechanism is necessary for vinculin activation) (23). Using a fluorescence resonance energy transfer probe, Chen et al. (38) first demonstrated in vivo that vinculin becomes activated in focal adhesions, and later demonstrated in vitro that only after F-actin and talin coincide does vinculin become activated and show cosedimentation with F-actin (23). Conversely, using vinculin captured on a gold surface, Bois et al. (37) showed that VBSs are able to bind even full-length vinculin with the following affinities: VBS1 with a Kd of 78 nM, VBS2 with a Kd of 530 nM, and VBS3 with a Kd of 74 nM. Taken together with previous results suggesting that VBS binding involves dissociation of Vt from D1 (32), these findings suggest that talin VBS is sufficient to cause activation in vinculin. In addition to questions regarding the mechanism of vinculin activation, several related questions likewise remain unanswered: What are the structural mechanisms of vinculin autoinhibition? What is the trajectory of conformational changes during vinculin activation? What is the final conformation of an activated vinculin molecule?
In this study we examine the detailed structural mechanisms of vinculin activation. Using molecular-dynamics (MD) simulation, we investigate the likely conformational changes that lead to vinculin activation with regard to both existing hypotheses for vinculin activation. We simulate the effects that VBS association with full-length vinculin might have on vinculin activation, as well as the activating conformational changes resulting from the stretching forces to which vinculin and the vinculin-VBS complex are likely exposed by simultaneous interaction with F-actin and talin (Fig. 2).
Figure 2.
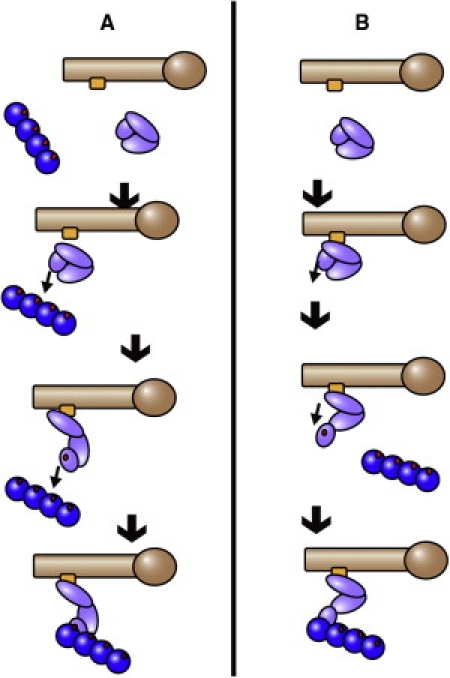
Suggested models of vinculin activation in the cell. Two competing hypotheses regarding the method of vinculin activation have been presented. (A) Simultaneous interaction of actin and talin with the two binding sites on vinculin would induce activation, possibly through a stretching force. (B) Talin VBS interacts with vinculin via a helical bundle conversion mechanism. Subsequently, vinculin is activated and its Vt domain can then interact with actin. MD is used to simulate conformational changes due to stretching of vinculin as suggested by the simultaneous interaction hypothesis, and to simulate conformational changes due to helical bundle conversion. The two sets of simulations are compared to see which is consistent with the structural changes needed for vinculin activation.
Methods
Homology modeling of the proline-rich loop region
We used SWISSMODEL (39) to create a homology model of full-length vinculin, including its proline-rich domain. The original sequence was taken from the crystal structure (PDB 1TR2) (21) and submitted to SWISSMODEL using the Swiss-Pdb Viewer DeepView (40) interface. Sequence alignment and structural information are available for PDB 1TR2 (21) for all regions of the vinculin sequence except residues P843–P877. The structure of the proline-rich loop region was taken from PDB 3PTE (41) because of the high sequence homology between 3PTE and the loop region. The final merged structure had no changes to any residues from PDB 1TR2. The total number of bad φ angles in the merged structure before minimization was six. CHARMM (42) was then used to minimize the homology structure and alleviate the bad φ angles. The minimization was carried out in CHARMM by alternately applying the steepest-descent and adopted-basis Newton Raphson methods for 3000 steps each.
MD simulation of vinculin activation
MD simulations were carried out to explore the molecular trajectory of vinculin activation. CHARMM (42) was installed on Intel Xeon workstations and used for all MD simulations. The CHARMM simulations were set up to first load the structure, topology, and parameter information; then heat and equilibrate the system; and finally simulate the response to stretching forces. The effective energy function (EEF1) (43) implicit solvent model was used to calculate solvent effects. Implicit solvent models such as EEF1 are viable alternatives to computationally costly explicit solvent approximations and have been used repeatedly in simulations (44). The model has also been compared with experimental results for validation (45). The use of the implicit solvent model is appropriate in this study because our main consideration is the large-scale conformational change resulting from the stretching force. With the implicit model, significant solvent viscous effects are absent and large-scale conformational changes can take place within the simulation window, whereas the use of an explicit solvent would require prohibitively longer simulation times. One potential artifact that could result from the use of an implicit solvent model would be a lack of dielectric screening in nonbonded interactions; however, such an effect should not alter the large-scale conformational changes. The SHAKE method (46) was used to constrain bond lengths between heavy atoms and hydrogen atoms. All MD simulations used the CHARMM19 force fields (47). Each simulation was first heated to 300 K for 40 ps and then equilibrated. Equilibration simulations were run until no further total root mean-square deviation was calculated, indicating no further net conformational change. An average of 400 ps of simulation was sufficient to achieve equilibration. All results from the simulations were visualized in VMD (48). Trajectory data from the simulations were recorded and saved in VMD.
Forced activation in three directions
Forces were applied to Vt in three directions: a stretching direction to simulate simultaneous interaction of vinculin with talin and actin, and two directions to simulate complete separation of Vt from Vh. Forces were applied to the center of mass of Vt in each of the three directions. To simulate complete separation of Vt from Vh, first N193, K261, V491, and Q662 were constrained fixed, and the direction of force was away from the center of mass of Vh. Then the fixation constraints were applied to D505–D510 and A560–R570. The direction of force was away from the center of those residues in domain 3. To simulate stretching of vinculin due to simultaneous interaction, the center of mass of the VBS binding region (M1–R132) was constrained with residues V16, V51, V81, and I115 fixed. In all three simulations the forces were applied to the center of mass of Vt at M926, S958, I988, and M1031. Forces were applied at 50 pN and 100 pN in the three directions for 800 ps. The force levels used here are comparable to those used in numerous previous MD simulations (49,50); however, they are significantly higher than those used for in vitro or physiological experiments because of the faster timescales required for computational simulation (51). Molecular conformational changes, including vinculin activation, are expected to occur on a millisecond timescale in vivo, whereas the conformational changes simulated here occur on a nanosecond timescale. Quantitatively this difference in timescale results in a difference in reported force and energy levels reported for conformational changes, and qualitatively it can result in significant local conformational changes, such as loss of helical integrity. However, in other computational simulations, the major molecular conformational changes have been shown to be consistent between nanosecond simulations and millisecond experiments. For example, the activation of talin's VBS in silico (28,52) is comparable to its activation in vitro (31).
Simulation of vinculin activation with VBS bound
To investigate the effects of VBS binding to D1 on vinculin activation using MD, we formed a vinculin-VBS complex using the crystal structure for D1 bound to VBS1 (PDB 1T01) (34) to obtain the structure of the D1 region with VBS bound and the full-length vinculin structure (21) with a homology-modeled loop region. The hybrid vinculin structure was minimized in CHARMM (42) using steered-descent and adopted-basis Newton Raphson minimization techniques for 3000 steps each. For the activation simulation of the vinculin-VBS complex, we used methods similar to those employed for activation of the vinculin molecule itself. Fixation constraints were applied to V16, V51, V81, and I115, and constant forces were applied to M926, S958, I988, and M1031. These represent the center of mass of the VBS binding region and the Vt region, respectively. Forces of 50 pN, 100 pN, 125 pN, 150 pN, and 200 pN were applied to the Vt residues for 800 ps.
Residue modification in D1
Before vinculin can be activated, electrostatic interactions between Vt and the VBS binding region must be overcome. To further test the role played by electrostatic interactions in stabilizing the autoinhibited vinculin structure, we introduced residue modifications to the charged residues in D1 of the vinculin-VBS complex. Three residues were chosen and modified to GLY: E29 was modified to G29, E14 was modified to G14, and R7 was modified to G7. Modification removed the electrostatic interactions. The MD simulations of activation were rerun with the modifications using 50 pN, 100 pN, and 125 pN of force.
Full-length vinculin normal-mode analysis
The natural vibrational frequencies of the full-length vinculin molecule were determined using the normal-mode analysis (NMA) software WEBnm@ (53) and ElNemo (54). The normal modes, which are a function of vinculin molecular structure, show natural movements in flexible molecular regions and little movement in rigid regions. WEBnm@ uses the MMTK (55) software internally and computes natural frequencies using Hinsen's computational methods (56), which calculates approximate normal modes by determining the eigenvectors of the matrix of second derivatives of potential energy with respect to displacement of the Cα atoms of each residue. The potential energy function used for this calculation utilizes a Hookian potential between Cα atoms within an 8 Å cutoff distance. Because NMA represents movements resulting from the overall structure, the use of Cα atoms is sufficient for NMA calculations (57). WEBnm@ calculates the six lowest-frequency vibrational modes (modes 7–12). These modes are then analyzed and visualized using VMD (48). In similarity to WEBnm@, ElNemo uses the elastic network model (58) to determine the normal modes, but it can produce up to 100 of the lowest-frequency modes.
Results and Discussion
To date, the structure of activated vinculin has not been solved. However, features of the inactive vinculin structure play a critical role in autoinhibition. Considering previous suggestions (24) that vinculin autoinhibition results from steric hindrance of the actin-binding domain in Vt by regions in domain 1 (Fig. 1 B), any conformational change in vinculin that would remove the steric hindrance would also result in activation. To investigate the two hypotheses regarding vinculin activation, we devised a series of MD simulations to induce conformational changes in vinculin by removing the steric hindrance and potentially activating vinculin, and allow us to compare the two hypotheses. First, vinculin is simulated with a stretching force that is carefully defined to be consistent with the simultaneous interaction hypothesis. During simultaneous interaction, the actin-binding domain would be attracted to actin, whereas the talin-binding domain would be attracted to VBS, resulting in a simultaneous stretch of vinculin with those two binding domains (Vt and domain 1) stretched away from each other. Second, the simulations are extended to include VBS binding and evaluate the effects of talin binding on activation. Third, to control for the effects of pull direction and to investigate other conformational changes, the simulations are repeated with several different pull directions. Finally, to confirm the validity of the structural mechanism, the simulations are repeated with specific residue modifications introduced, and the vinculin normal modes are analyzed. We aim to simulate a simultaneous interaction by applying a stretching force. The use of a stretching force is a novel approach (to our knowledge) to indirectly measure a binding interaction and can therefore have several limitations. The potential limitations of our study are discussed in the Discussion section.
Simulation of activation by simultaneous interaction
Actin interacts directly with Vt while talin VBS interacts with Vh at domain 1 (22). The interaction of talin with Vh involves hydrophobic insertion (35) and is likely to anchor vinculin to talin, even if this interaction alone is not sufficient to activate vinculin. The interaction of Vt with actin is polar and therefore there is likely to be a strong electrostatic force that attracts Vt toward actin before binding (24). A simultaneous interaction of vinculin with talin and actin would likely involve anchoring of Vh to talin while Vt is attracted and pulled toward actin, resulting in a stretching force pulling Vt away from the talin-binding domain (Fig. 2 A). The direction of force for our simulation is then chosen to simulate the stretching of vinculin during simultaneous interaction, i.e., we apply a pulling force to Vt and pull it away from the VBS binding domain (Fig. 3 A). The center of mass of the VBS binding domain is held fixed, as if anchored to talin during the simultaneous interaction.
Figure 3.
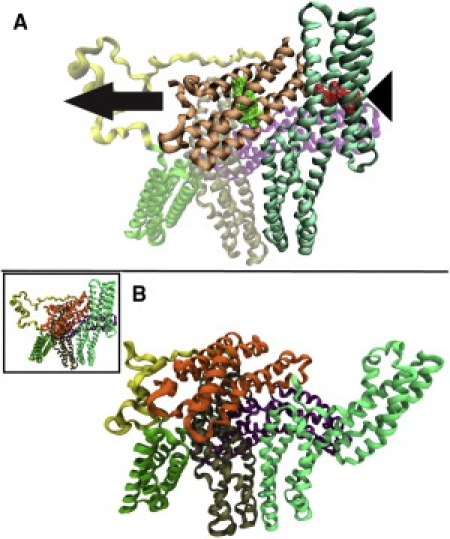
Simulation of vinculin activation by simultaneous interaction. To simulate the stretching of vinculin due to simultaneous interaction with actin and talin, force was applied to Vt (binds to actin) away from the VBS binding region of Vh. (A) The direction of force is indicated by the arrow. The four residues nearest the center of mass of the VBS binding region of Vh were constrained (triangle) while 50 pN and 100 pN of constant force was applied to the four residues nearest the center of mass of Vt (residues shown in wire mesh). (B) After >300 ps of simulation, the VBS binding region of Vh moved away from Vt. This conformational change involved bending of the helical regions in domain 1. As the simulation progressed, the VBS binding region moved farther away from Vt. Shown here is the conformation of vinculin with the VBS binding region ∼120 Å away. In this conformation, the steric hindrance preventing Vt interaction with actin is removed and vinculin is likely activated.
The conformational change that results from stretching vinculin by constant force matches the criterion for activation, that is, removal of steric hindrance from the actin-binding domain (Fig. 3 B). In the MD simulations of vinculin stretching with a constant force of 100 pN, a significant conformational change occurred in eight out of nine trials, such that bending of domain 1 caused the VBS binding domain to move away from the Vt domain. This movement occurred while no other regions of vinculin underwent noticeable conformational changes. Movement of the VBS binding domain away from Vt has the effect of removing the steric hindrance and therefore likely results in an activated conformation.
The activation trajectory entails specific structural changes. In its autoinhibited conformation, there are three sets of salt-bridges between Vt and the VBS binding region. When the stretching force is applied in MD, these sets of salt-bridges break sequentially (Video S1 and Fig. S1 in the Supporting Material). During each breakage event, the strength of the connection between Vt and the VBS binding region is weakened and the distance between the VBS binding domain and Vt further increases. The first of the salt-bridges to break is E14 with E986 (salt-bridge 3), the second is E14 with K996 (salt-bridge 2), and the final one is E29 and E31 with R945 and R1008 (salt-bridge 1).
The results of our MD simulation tentatively suggest that a stretching force, assumed to be from a simultaneous interaction of vinculin with talin and actin, could lead to activation by bending the VBS binding domain away from Vt. This activation trajectory is similar to the activation trajectory described by Chen and Dokholyan (59). Based on results from a discrete MD simulation in which three backbone beads and a single side-group bead represented each residue, they suggested that vinculin activation might involve a clincher-like movement of domain 1 and 3. Both their simulations and ours suggest that vinculin activation, at least from simultaneous interaction with actin and talin, involves movement in domain 1 exposing Vt.
Activation by helical bundle conversion
The other suggested mechanism of vinculin activation is that vinculin is activated sequentially (Fig. 2 B). First, the talin VBS inserts itself into the VBS binding domain on Vh. Second, the helices near the VBS insertion rearrange to stabilize the new hydrophobic core (this rearrangement is termed helical bundle conversion (35)). Third, vinculin is activated by the helical bundle conversion. Finally, once activated, Vt interacts with actin. To investigate this hypothesis using MD, we introduced VBS along with the suggested conformational changes from helical bundle conversion (36) into our full-length vinculin structure.
Several significant changes are seen in the full-length vinculin structure after VBS insertion. The two helical regions from R7-E31 (H1) and from L40-T64 (H2) near the site of VBS insertion have moved further apart and H1 has moved closer to Vt (Fig. 4 A). The shift of H1 closer to Vt results directly in shifts in the interaction distance between three groups of salt-bridges: 1), E29 and E31 with R945 and R1008; 2), E14 with K996; and 3), E7 with E986. Specifically, the distance between charged residues is increased by 2.73 Å in salt-bridge 3 and decreased in salt-bridge 2 by 0.23 Å, and in salt-bridge 1 the multiple charged residues are each rearranged and shifted. E29 and R945 are now closer by 2.63 Å, E31 and R945 are now closer by 7.09 Å, E29 and R1008 are now closer by 7.64 Å, and E31 and R1008 are now farther apart by 8.29 Å (Fig. 4, B–D). These shifts and rearrangements are maintained even after minimization and equilibration. After equilibration it becomes clear that the structural changes that occur after VBS insertion weaken salt-bridge 3, whereas they strengthen salt-bridge 1 by bringing three of the four charged residues into close electrostatic contact with each other.
Figure 4.
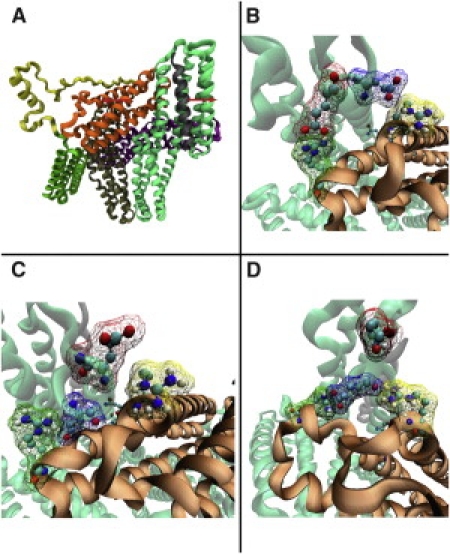
Helical bundle conversion in full-length vinculin. (A) The vinculin-VBS complex that was formed using structural information from PDB 1TR2 and PDB 1T01. Binding to VBS causes local conformational changes in D1. Two helical regions in D1 are pushed apart while VBS is inserted in between. Three sets of electrostatic interactions exist between D1 and Vt: 1), E29-R945 and E31-R1008; 2), E14-K996; and 3), R7-E986. Insertion of VBS causes changes in the electrostatic interactions mainly in set 1. (B) Electrostatic interactions in set 1 before VBS binding: E29 interacts with R945, and E31 interacts with R1008. (C) Set 1 after VBS complex formation and minimization. After rearrangement from VBS binding, E31 interacts with R945, and E29 interacts with R1008. (D) The interaction in set 1 rearranges once again after an equilibration for 100 ps. The E29 now interacts with both R945 and R1008, and E31 is no longer paired. 1), E29 and E31 with R945 and R1008; 2), E14 with K996; and 3), E7 with E986.
To compare activation in the vinculin-VBS compound with all its structural changes to activation in full-length vinculin alone, we ran MD simulations with a range of constant forces (50–200 pN) and multiple trials with a setup similar to that described above, i.e., forces were applied to Vt in a direction away from the VBS binding region in domain 1. After 800 ps of simulation, it appears that the VBS insertion may increase the force necessary to cause movement of the VBS binding region away from Vt (Fig. 5).
Figure 5.
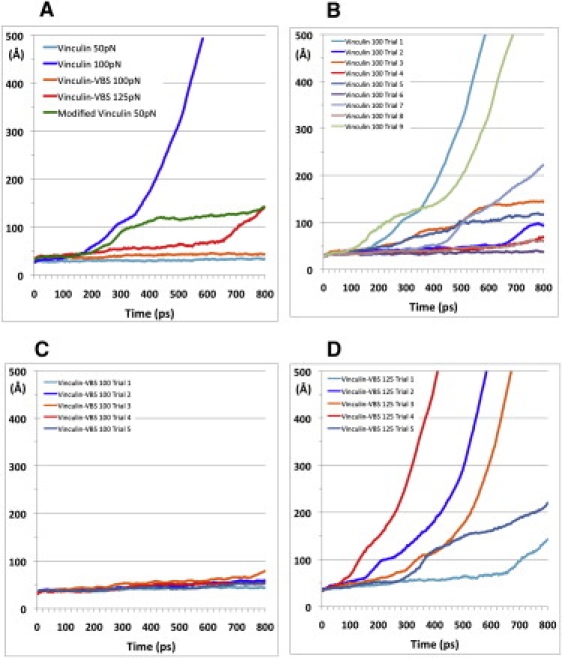
Potential activation of vinculin after exposure to external force. Forces ranging from 50 pN to 200 pN were used in simulations of vinculin with various MD parameters. (A) Results from representative trials show that 100 pN of force was needed to alter vinculin, and 125 pN over 800 ps was needed to alter vinculin with VBS bound. (B) Simulation of vinculin activation with 100 pN of force showed that in eight of the nine trials, 100 pN of force over 800 ps was sufficient to move domain 1 away from Vt. (C) A force of 100 pN is insufficient to move domain 1 away from Vt once it is bound to VBS in any of five trials. (D) A force force of 125 pN is necessary to cause domain 1 bound to VBS to move away from Vt in all five trial simulations. Together, these data suggest that VBS binding increases the force needed to activate vinculin.
If the trajectory of vinculin activation conformational changes is assumed to be the trajectory suggested by the simulation of vinculin alone, then the hypothesis of simultaneous interaction with talin and actin is more likely. The conformational changes induced in Vh by VBS insertion make activation by movement of the VBS binding region away from Vt more costly and therefore less likely to occur.
Alternative trajectories for forced induced vinculin activation
To discover other potential activation mechanisms using MD, we simulated both full-length vinculin and the vinculin-VBS compound with alternative force directions. Regardless of the mechanism or trajectory used, one characteristic of vinculin activation is that the steric hindrance of Vt must be removed. Aside from the movements described thus far, another structural change that could remove the steric hindrance is the complete separation of Vt from all regions of Vh. To simulate this mechanism of vinculin activation in the MD simulations, we applied force to the center of mass of Vt in the direction away from the center of mass of Vh (Fig. S2 A).
Vt was separated from Vh using MD in both the full-length vinculin and the vinculin-VBS compound. In both structures, forces of 50 pN and 100 pN simulated for 1 ns were unable to induce significant conformational changes. The resilience of vinculin to complete separation of Vt from Vh in simulation indicates that there are structural features that prevent complete separation. There are 14 salt-bridges between Vt and Vh that likely lend this structural stability (Fig. 1 C). Of these, three are between Vt and the VBS binding region and are broken in the activation mechanism discussed above. It is the combined strength of all 14 salt-bridges that likely accounts for the resistance to complete separation of Vt from Vh in the MD simulations. The closed conformation of vinculin is stable, with a total energy of −23,380 Kcal/Mol, and is therefore not likely to become completely separated. Furthermore, any conformational change that involves breakage of the 14 salt-bridges could break the three bridges between Vt and the VBS binding region first, causing activation before any further interaction between Vt and Vh is broken.
A third potential conformational change that could lead to activation of vinculin is movement of Vt away from the VBS binding region, as opposed to movement of VBS away from Vt. To induce this movement, a pulling force was applied to Vt in a third direction: away from the loop region of domain 3 (Fig. S2 B). This is the only other direction in which Vt can be pulled without introducing other steric hindrances. The results from pulling both vinculin and vinculin-VBS with 50 pN and 100 pN in this third direction show no significant conformational changes. The same 14 salt-bridges that stabilized Vt while it was being pulled away from the center of mass of Vh likely also stabilized Vt in these simulations.
Considering the structural features linking Vt to Vh, such as the 14 salt-bridges and the MD results showing no Vt movement with forces up to 100 pN, it is not likely that a vinculin activation mechanism involves complete separation of Vt. Of course, other movements are possible, but considering that any vinculin conformational change will likely first disrupt the connection between Vt and D1 (which is sufficient for activation, as shown above), it appears that the critical movement underlying activation is the movement of the VBS binding region away from Vt. This movement is likely to occur after a simultaneous interaction between vinculin and its two binding partners, F-actin and talin.
Confirmation of vinculin-activation structural mechanisms
To confirm that the proposed activation conformational change is consistent with all of the structural features of vinculin, we used two computational methods: NMA and residue modification/mutation. NMA involves the calculation of the lowest-frequency vibrational modes using the minimized structure. The conformational changes that occur during the lowest-frequency modes represent the likely movement within the local well of the energy landscape. Although NMA is useful for considering the general flexibility of a molecule as a whole, it cannot capture movements that require a significant energy input, such as activation (60). To consider the general flexibility of full-length vinculin, an all-atom normal mode calculation would be both computationally costly and unnecessary. Instead, we calculated normal modes using the elastic network model (54,56,58). The vibrational movements calculated using the elastic network model mainly involved movement of the linker region between domain 4 and Vt (Fig. S3 A). Other regions that showed significant vibrational movements consistently in both computational techniques were peripheral loop regions that were not near Vt (Fig. S3 B). These vibrational movements suggest that the most flexible region in vinculin is the linker region between Vt and Vh. Other flexible regions include loop regions not near Vt. In none of the lowest vibrational modes was there movement of Vt or any of the regions near Vt, including the VBS binding domain. The results from NMA of vinculin-VBS showed similar structural features. The MD results took into account atomic-scale features, such as salt-bridges, whereas the NMA considered the more-intuitive flexibility resulting from the general structure of vinculin. However, the structural features suggested by NMA are consistent with results from MD: Vt is rigidly connected to Vh, and vinculin activation involving the complete removal of Vt is unlikely.
To confirm the vitality of the three salt-bridges between Vt and the VBS binding region, and to investigate the capacity for vinculin activation in the absence of these salt-bridges, we ran MD simulation after modifying the charged residues E29, E14, and R7 at each of the three salt-bridges to glycine. After modification, the same MD simulations described above were run with the modified vinculin structure. In the new simulation of modified vinculin, conformational changes indicating activation, i.e., movement of the VBS binding region away from Vt, occurred with less force (within 400 ps with 50 pN of force). Furthermore, once the conformational change was achieved, a stable intermediary structure was formed and sustained for an additional 300 ps of simulation. This stable intermediary structure was present briefly in previous simulations, but due to the larger force necessary to induce conformational changes in simulation of unmodified vinculin, the intermediary unfolded quickly as simulation progressed. The MD results after modification are consistent with previous experimental results regarding vinculin activation after genetic mutation (61). Cohen et al. (61) showed that modification of key polar residues between domain 1 and Vt (the same residues that were modified in this MD) reduced vinculin autoinhibition. The simulations presented here confirm that polar residues have a key role in stabilizing the autoinhibited conformation, and further suggest a trajectory for vinculin activation involving the breakage of salt-bridges and movement of the VBS binding region away from Vt.
Conclusions
Two hypotheses have been formulated regarding the mechanisms of vinculin activation: 1), a simultaneous interaction between vinculin and its two binding partners (talin and actin) is necessary for activation; or 2), at first an interaction of vinculin with talin causes helical bundle conversion, and then after activation vinculin interacts with actin. We investigated both hypotheses using MD, and the results suggest that it is the simultaneous interaction between vinculin and its two binding partners causing an internal stretching force and movement of the VBS binding region away from Vt that activates vinculin. The results further suggest that insertion of talin VBS is insufficient to activate vinculin. A VBS insertion before a stretching event would reduce the activation potential by strengthening electrostatic interactions between the VBS binding region in Vh and Vt. The results are consistent with the structural features of vinculin and findings from simulated residue modification and previous experimental mutation. The results from these simulations are currently the sole suggested trajectory for vinculin activation. Previous experiments have demonstrated a clear role for force-induced protein conformational change in the other cytoskeletal proteins (62); however, our results should be considered tentative and inviting of further study.
The interaction of vinculin with its binding partners was indirectly simulated using a stretching force. This strategy can have limitations. In addition to potentially serving as an indirect measure of binding, the stretching force applied in these vinculin simulations can also be used evaluate the hypothesis that vinculin is activated by an external force. Physiologically, can an external force regulate vinculin activation? In a previous study, Mierke et al. (63) suggested that mechanical force may play a role in vinculin activation. In their experimental investigation, they used magnetic beads on vinculin null cells and normal cells. They found that in the absence of vinculin, cells were less responsive in reinforcement against the external force. Although far from conclusive, their results, along with our MD simulations, indicate a possible role of mechanical force in vinculin activation.
The activation of vinculin is central to the process of focal adhesion formation and the many processes that depend on focal adhesions; therefore, some disease states that are associated with failure of focal adhesion formation may be linked to failure of vinculin activation. Such a link between disease states and failed molecular structure has been demonstrated in other systems (64). Several studies have also described a link between focal adhesion formation and disease (65–68).
MD is a valuable tool for investigating atomic-scale phenomena in critical molecular processes in the cell, such as vinculin activation (69–72). The results from these simulations should be used as a complement to existing experiments or to suggest future experiments. One possible way to experimentally investigate the suggested trajectory of vinculin activation would be to track conformational changes in vinculin during activation using contrasting vinculin constructs for fluorescence resonance energy transfer analysis. The vinculin conformational changes that occur during activation could then be compared with those suggested by our MD results. Another possibility would be to force-induce vinculin conformational change in vitro with an optical trap and report on its activation. In this study we used MD to shed light on an important cellular process: vinculin activation. For the first time, to our knowledge, a trajectory for vinculin activation has been suggested that can be evaluated by future investigations.
Acknowledgments
The authors are thankful to members of Molecular Cell Biomechanics Laboratory for their invaluable input.
Financial support by National Science Foundation (CAREER-0955291) is gratefully acknowledged.
Supporting Material
References
- 1.Vogel V., Sheetz M. Local force and geometry sensing regulate cell functions. Nat. Rev. Mol. Cell Biol. 2006;7:265–275. doi: 10.1038/nrm1890. [DOI] [PubMed] [Google Scholar]
- 2.Jiang G., Giannone G., Sheetz M.P. Two-piconewton slip bond between fibronectin and the cytoskeleton depends on talin. Nature. 2003;424:334–337. doi: 10.1038/nature01805. [DOI] [PubMed] [Google Scholar]
- 3.Giannone G., Jiang G., Sheetz M.P. Talin1 is critical for force-dependent reinforcement of initial integrin-cytoskeleton bonds but not tyrosine kinase activation. J. Cell Biol. 2003;163:409–419. doi: 10.1083/jcb.200302001. [DOI] [PMC free article] [PubMed] [Google Scholar]
- 4.Galbraith C.G., Yamada K.M., Sheetz M.P. The relationship between force and focal complex development. J. Cell Biol. 2002;159:695–705. doi: 10.1083/jcb.200204153. [DOI] [PMC free article] [PubMed] [Google Scholar]
- 5.Mofrad M.R., Kamm R.D. Cambridge University Press; New York: 2009. Cellular Mechanotransduction: Diverse Perspectives From Molecules to Tissues. [Google Scholar]
- 6.Mofrad M.R., Kamm R.D. Cambridge University Press; New York: 2006. Cytoskeletal Mechanics: Models and Measurements. [Google Scholar]
- 7.Bao G., Kamm R.D., Mofrad M.R. Molecular biomechanics: the molecular basis of how forces regulate cellular function. Cell. Mol. Bioeng. 2010;3:91–105. doi: 10.1007/s12195-010-0109-z. [DOI] [PMC free article] [PubMed] [Google Scholar]
- 8.Kolahi K.S., Mofrad M.R. Mechanotransduction: a major regulator of homeostasis and development. Wiley Interdiscip. Rev. Syst. Biol. Med. 2010 doi: 10.1002/wsbm.79. In press. [DOI] [PubMed] [Google Scholar]
- 9.Kamm R.D., Kaazempur-Mofrad M.R. On the molecular basis for mechanotransduction. Mech. Chem. Biosyst. 2004;1:201–209. [PubMed] [Google Scholar]
- 10.Gallant N.D., Michael K.E., García A.J. Cell adhesion strengthening: contributions of adhesive area, integrin binding, and focal adhesion assembly. Mol. Biol. Cell. 2005;16:4329–4340. doi: 10.1091/mbc.E05-02-0170. [DOI] [PMC free article] [PubMed] [Google Scholar]
- 11.Rodríguez Fernández J.L., Geiger B., Ben-Ze'ev A. Overexpression of vinculin suppresses cell motility in BALB/c 3T3 cells. Cell Motil. Cytoskeleton. 1992;22:127–134. doi: 10.1002/cm.970220206. [DOI] [PubMed] [Google Scholar]
- 12.Volberg T., Geiger B., Ben-Ze'ev A. Focal adhesion formation by F9 embryonal carcinoma cells after vinculin gene disruption. J. Cell Sci. 1995;108:2253–2260. doi: 10.1242/jcs.108.6.2253. [DOI] [PubMed] [Google Scholar]
- 13.Liu S., Calderwood D.A., Ginsberg M.H. Integrin cytoplasmic domain-binding proteins. J. Cell Sci. 2000;113:3563–3571. doi: 10.1242/jcs.113.20.3563. [DOI] [PubMed] [Google Scholar]
- 14.García-Alvarez B., de Pereda J.M., Liddington R.C. Structural determinants of integrin recognition by talin. Mol. Cell. 2003;11:49–58. doi: 10.1016/s1097-2765(02)00823-7. [DOI] [PubMed] [Google Scholar]
- 15.Saunders R.M., Holt M.R., Critchley D.R. Role of vinculin in regulating focal adhesion turnover. Eur. J. Cell Biol. 2006;85:487–500. doi: 10.1016/j.ejcb.2006.01.014. [DOI] [PubMed] [Google Scholar]
- 16.Alenghat F.J., Fabry B., Ingber D.E. Analysis of cell mechanics in single vinculin-deficient cells using a magnetic tweezer. Biochem. Biophys. Res. Commun. 2000;277:93–99. doi: 10.1006/bbrc.2000.3636. [DOI] [PubMed] [Google Scholar]
- 17.Coll J.L., Ben-Ze'ev A., Adamson E.D. Targeted disruption of vinculin genes in F9 and embryonic stem cells changes cell morphology, adhesion, and locomotion. Proc. Natl. Acad. Sci. USA. 1995;92:9161–9165. doi: 10.1073/pnas.92.20.9161. [DOI] [PMC free article] [PubMed] [Google Scholar]
- 18.DeMali K.A., Barlow C.A., Burridge K. Recruitment of the Arp2/3 complex to vinculin: coupling membrane protrusion to matrix adhesion. J. Cell Biol. 2002;159:881–891. doi: 10.1083/jcb.200206043. [DOI] [PMC free article] [PubMed] [Google Scholar]
- 19.Subauste M.C., Pertz O., Hahn K.M. Vinculin modulation of paxillin-FAK interactions regulates ERK to control survival and motility. J. Cell Biol. 2004;165:371–381. doi: 10.1083/jcb.200308011. [DOI] [PMC free article] [PubMed] [Google Scholar]
- 20.Ziegler W.H., Liddington R.C., Critchley D.R. The structure and regulation of vinculin. Trends Cell Biol. 2006;16:453–460. doi: 10.1016/j.tcb.2006.07.004. [DOI] [PubMed] [Google Scholar]
- 21.Bakolitsa C., Cohen D.M., Liddington R.C. Structural basis for vinculin activation at sites of cell adhesion. Nature. 2004;430:583–586. doi: 10.1038/nature02610. [DOI] [PubMed] [Google Scholar]
- 22.Zamir E., Geiger B. Components of cell-matrix adhesions. J. Cell Sci. 2001;114:3577–3579. doi: 10.1242/jcs.114.20.3577. [DOI] [PubMed] [Google Scholar]
- 23.Chen H., Choudhury D.M., Craig S.W. Coincidence of actin filaments and talin is required to activate vinculin. J. Biol. Chem. 2006;281:40389–40398. doi: 10.1074/jbc.M607324200. [DOI] [PubMed] [Google Scholar]
- 24.Janssen M.E., Kim E., Hanein D. Three-dimensional structure of vinculin bound to actin filaments. Mol. Cell. 2006;21:271–281. doi: 10.1016/j.molcel.2005.11.020. [DOI] [PubMed] [Google Scholar]
- 25.Bakolitsa C., de Pereda J.M., Liddington R.C. Crystal structure of the vinculin tail suggests a pathway for activation. Cell. 1999;99:603–613. doi: 10.1016/s0092-8674(00)81549-4. [DOI] [PubMed] [Google Scholar]
- 26.Bass M.D., Smith B.J., Critchley D.R. Talin contains three similar vinculin-binding sites predicted to form an amphipathic helix. Biochem. J. 1999;341:257–263. [PMC free article] [PubMed] [Google Scholar]
- 27.Gingras A.R., Ziegler W.H., Emsley J. Mapping and consensus sequence identification for multiple vinculin binding sites within the talin rod. J. Biol. Chem. 2005;280:37217–37224. doi: 10.1074/jbc.M508060200. [DOI] [PubMed] [Google Scholar]
- 28.Lee S.E., Kamm R.D., Mofrad M.R. Force-induced activation of talin and its possible role in focal adhesion mechanotransduction. J. Biomech. 2007;40:2096–2106. doi: 10.1016/j.jbiomech.2007.04.006. [DOI] [PubMed] [Google Scholar]
- 29.Hytönen V.P., Vogel V. How force might activate talin's vinculin binding sites: SMD reveals a structural mechanism. PLoS Comput. Biol. 2008;4:e24. doi: 10.1371/journal.pcbi.0040024. [DOI] [PMC free article] [PubMed] [Google Scholar]
- 30.Fillingham I., Gingras A.R., Barsukov I.L. A vinculin binding domain from the talin rod unfolds to form a complex with the vinculin head. Structure. 2005;13:65–74. doi: 10.1016/j.str.2004.11.006. [DOI] [PubMed] [Google Scholar]
- 31.del Rio A., Perez-Jimenez R., Sheetz M.P. Stretching single talin rod molecules activates vinculin binding. Science. 2009;323:638–641. doi: 10.1126/science.1162912. [DOI] [PMC free article] [PubMed] [Google Scholar]
- 32.Izard T., Vonrhein C. Structural basis for amplifying vinculin activation by talin. J. Biol. Chem. 2004;279:27667–27678. doi: 10.1074/jbc.M403076200. [DOI] [PubMed] [Google Scholar]
- 33.Bass M.D., Patel B., Critchley D.R. Further characterization of the interaction between the cytoskeletal proteins talin and vinculin. Biochem. J. 2002;362:761–768. doi: 10.1042/0264-6021:3620761. [DOI] [PMC free article] [PubMed] [Google Scholar]
- 34.Papagrigoriou E., Gingras A.R., Emsley J. Activation of a vinculin-binding site in the talin rod involves rearrangement of a five-helix bundle. EMBO J. 2004;23:2942–2951. doi: 10.1038/sj.emboj.7600285. [DOI] [PMC free article] [PubMed] [Google Scholar]
- 35.Izard T., Evans G., Bois P.R. Vinculin activation by talin through helical bundle conversion. Nature. 2004;427:171–175. doi: 10.1038/nature02281. [DOI] [PubMed] [Google Scholar]
- 36.Lee S.E., Chunsrivirot S., Mofrad M.R. Molecular dynamics study of talin-vinculin binding. Biophys. J. 2008;95:2027–2036. doi: 10.1529/biophysj.107.124487. [DOI] [PMC free article] [PubMed] [Google Scholar]
- 37.Bois P.R., O'Hara B.P., Izard T. The vinculin binding sites of talin and α-actinin are sufficient to activate vinculin. J. Biol. Chem. 2006;281:7228–7236. doi: 10.1074/jbc.M510397200. [DOI] [PubMed] [Google Scholar]
- 38.Chen H., Cohen D.M., Craig S.W. Spatial distribution and functional significance of activated vinculin in living cells. J. Cell Biol. 2005;169:459–470. doi: 10.1083/jcb.200410100. [DOI] [PMC free article] [PubMed] [Google Scholar]
- 39.Arnold K., Bordoli L., Schwede T. The SWISS-MODEL workspace: a web-based environment for protein structure homology modelling. Bioinformatics. 2006;22:195–201. doi: 10.1093/bioinformatics/bti770. [DOI] [PubMed] [Google Scholar]
- 40.Guex N., Peitsch M.C. SWISS-MODEL and the Swiss-PdbViewer: an environment for comparative protein modeling. Electrophoresis. 1997;18:2714–2723. doi: 10.1002/elps.1150181505. [DOI] [PubMed] [Google Scholar]
- 41.Kelly J.A., Kuzin A.P. The refined crystallographic structure of a DD-peptidase penicillin-target enzyme at 1.6 A resolution. J. Mol. Biol. 1995;254:223–236. doi: 10.1006/jmbi.1995.0613. [DOI] [PubMed] [Google Scholar]
- 42.Brooks B.R., Bruccoleri R.E., Karplus M. CHARMM—a program for macromolecular energy, minimization, and dynamics calculations. J. Comput. Chem. 1983;4:187–217. [Google Scholar]
- 43.Lazaridis T. Effective energy function for proteins in lipid membranes. Proteins. 2003;52:176–192. doi: 10.1002/prot.10410. [DOI] [PubMed] [Google Scholar]
- 44.Feig M., Brooks C.L., 3rd Recent advances in the development and application of implicit solvent models in biomolecule simulations. Curr. Opin. Struct. Biol. 2004;14:217–224. doi: 10.1016/j.sbi.2004.03.009. [DOI] [PubMed] [Google Scholar]
- 45.Best R.B., Clarke J., Karplus M. What contributions to protein side-chain dynamics are probed by NMR experiments? A molecular dynamics simulation analysis. J. Mol. Biol. 2005;349:185–203. doi: 10.1016/j.jmb.2005.03.001. [DOI] [PubMed] [Google Scholar]
- 46.Kraeutler V., Gunsteren W.F., Huenenberger P.H. A fast SHAKE algorithm to solve distance constraint equations for small molecules in molecular dynamics simulations. J. Comput. Chem. 2001;22:501–508. [Google Scholar]
- 47.Neria E., Fischer S., Karplus M. Simulation of activation free energies in molecular systems. J. Chem. Phys. 1996;105:1902–1921. [Google Scholar]
- 48.Humphrey W., Dalke A., Schulten K. VMD: visual molecular dynamics. J. Mol. Graph. 1996;14:33–38. doi: 10.1016/0263-7855(96)00018-5. 27–28. [DOI] [PubMed] [Google Scholar]
- 49.Isralewitz B., Baudry J., Schulten K. Steered molecular dynamics investigations of protein function. J. Mol. Graph. Model. 2001;19:13–25. doi: 10.1016/s1093-3263(00)00133-9. [DOI] [PubMed] [Google Scholar]
- 50.Karplus M., McCammon J.A. Molecular dynamics simulations of biomolecules. Nat. Struct. Biol. 2002;9:646–652. doi: 10.1038/nsb0902-646. [DOI] [PubMed] [Google Scholar]
- 51.Sotomayor M., Schulten K. Single-molecule experiments in vitro and in silico. Science. 2007;316:1144–1148. doi: 10.1126/science.1137591. [DOI] [PubMed] [Google Scholar]
- 52.Hytönen V.P., Vogel V. How force might activate talin's vinculin binding sites: SMD reveals a structural mechanism. PLOS Comput. Biol. 2008;4:e24. doi: 10.1371/journal.pcbi.0040024. [DOI] [PMC free article] [PubMed] [Google Scholar]
- 53.Hollup S.M., Salensminde G., Reuter N. WEBnm@: a web application for normal mode analyses of proteins. BMC Bioinformatics. 2005;6:52. doi: 10.1186/1471-2105-6-52. [DOI] [PMC free article] [PubMed] [Google Scholar]
- 54.Suhre K., Sanejouand Y.H. ElNemo: a normal mode web server for protein movement analysis and the generation of templates for molecular replacement. Nucleic Acids Res. 2004;32(Web Server issue):W610–W614. doi: 10.1093/nar/gkh368. [DOI] [PMC free article] [PubMed] [Google Scholar]
- 55.Hinsen K. The molecular modeling toolkit: a new approach to molecular simulations. J. Comput. Chem. 2000;21:79–85. [Google Scholar]
- 56.Hinsen K. Analysis of domain motions by approximate normal mode calculations. Proteins. 1998;33:417–429. doi: 10.1002/(sici)1097-0134(19981115)33:3<417::aid-prot10>3.0.co;2-8. [DOI] [PubMed] [Google Scholar]
- 57.Ma J. New advances in normal mode analysis of supermolecular complexes and applications to structural refinement. Curr. Protein Pept. Sci. 2004;5:119–123. doi: 10.2174/1389203043486892. [DOI] [PMC free article] [PubMed] [Google Scholar]
- 58.Tirion M.M. Large amplitude elastic motions in proteins from a single-parameter, atomic analysis. Phys. Rev. Lett. 1996;77:1905–1908. doi: 10.1103/PhysRevLett.77.1905. [DOI] [PubMed] [Google Scholar]
- 59.Chen Y., Dokholyan N.V. Insights into allosteric control of vinculin function from its large scale conformational dynamics. J. Biol. Chem. 2006;281:29148–29154. doi: 10.1074/jbc.M605512200. [DOI] [PubMed] [Google Scholar]
- 60.Lu M., Ma J. The role of shape in determining molecular motions. Biophys. J. 2005;89:2395–2401. doi: 10.1529/biophysj.105.065904. [DOI] [PMC free article] [PubMed] [Google Scholar]
- 61.Cohen D.M., Chen H., Craig S.W. Two distinct head-tail interfaces cooperate to suppress activation of vinculin by talin. J. Biol. Chem. 2005;280:17109–17117. doi: 10.1074/jbc.M414704200. [DOI] [PubMed] [Google Scholar]
- 62.Johnson C.P., Tang H.Y., Discher D.E. Forced unfolding of proteins within cells. Science. 2007;317:663–666. doi: 10.1126/science.1139857. [DOI] [PMC free article] [PubMed] [Google Scholar]
- 63.Mierke C.T., Kollmannsberger P., Goldmann W.H. Mechano-coupling and regulation of contractility by the vinculin tail domain. Biophys. J. 2008;94:661–670. doi: 10.1529/biophysj.107.108472. [DOI] [PMC free article] [PubMed] [Google Scholar]
- 64.Buehler M.J., Yung Y.C. Deformation and failure of protein materials in physiologically extreme conditions and disease. Nat. Mater. 2009;8:175–188. doi: 10.1038/nmat2387. [DOI] [PubMed] [Google Scholar]
- 65.Liu M., Oberg K., Zhou Y. Expression and function of vinculin in neuroendocrine tumors. Tumour Biol. 2007;28:196–204. doi: 10.1159/000107415. [DOI] [PubMed] [Google Scholar]
- 66.Wohl Y., Goldberg I., Brenner S. Expression of vinculin in autoimmune cutaneous diseases. Skinmed. 2008;7:63–66. doi: 10.1111/j.1751-7125.2008.07279.x. [DOI] [PubMed] [Google Scholar]
- 67.Jaalouk D.E., Lammerding J. Mechanotransduction gone awry. Nat. Rev. Mol. Cell Biol. 2009;10:63–73. doi: 10.1038/nrm2597. [DOI] [PMC free article] [PubMed] [Google Scholar]
- 68.Huveneers S., Danen E.H. Adhesion signaling—crosstalk between integrins, Src and Rho. J. Cell Sci. 2009;122:1059–1069. doi: 10.1242/jcs.039446. [DOI] [PubMed] [Google Scholar]
- 69.Golji J., Collins R., Mofrad M.R. Molecular mechanics of the α-actinin rod domain: bending, torsional, and extensional behavior. PLOS Comput. Biol. 2009;5:e1000389. doi: 10.1371/journal.pcbi.1000389. [DOI] [PMC free article] [PubMed] [Google Scholar]
- 70.Chen H.S., Kolahi K.S., Mofrad M.R. Phosphorylation facilitates the integrin binding of filamin under force. Biophys. J. 2009;97:3095–3104. doi: 10.1016/j.bpj.2009.08.059. [DOI] [PMC free article] [PubMed] [Google Scholar]
- 71.Kolahi K.S., Mofrad M.R. Molecular mechanics of filamin's rod domain. Biophys. J. 2008;94:1075–1083. doi: 10.1529/biophysj.107.118802. [DOI] [PMC free article] [PubMed] [Google Scholar]
- 72.Mofrad M.R., Golji J., Kamm R.D. Force-induced unfolding of the focal adhesion targeting domain and the influence of paxillin binding. Mech. Chem. Biosyst. 2004;1:253–265. [PubMed] [Google Scholar]
Associated Data
This section collects any data citations, data availability statements, or supplementary materials included in this article.