

Abstract
Biological processes are governed by extensive networks of dynamic molecular interactions. Yet, establishing a spatial and temporal map of these interactions and their direct relationship to specific cell functions has remained a challenge. Here, we implement sensitized emission Förster resonance energy transfer (FRET) stoichiometry under total internal reflection fluorescence (TIRF) microscopy. We demonstrate through quantitative analysis and modeling that evanescent fields must be precisely matched between FRET excitation wavelengths to isolate dynamic interactions between bimolecular FRET pairs that are not entirely membrane-delimited. We then use TIRF-FRET to monitor the behavior of individual insulin-containing secretory granules at the plasma membrane of living cells, while simultaneously tracking the dynamic interaction between the GTPase Rab27A and its effector Slp4A, on those same granules. Notably, insulin granules that underwent exocytosis demonstrated a specific increase in Rab27A-GTP/Slp4A FRET in the 5 s before membrane fusion, which coincided temporally with an increase in granule displacement and mobility. These results demonstrate an initial spatiotemporal mapping of a dynamic protein-protein interaction on individual secretory granules that is linked to a specific granule behavior in living cells.
Introduction
Regulated exocytosis is a physiological event that underlies release of neurotransmitters for information transfer within the nervous system, of hormones for maintenance of metabolic homeostasis, and of paracrine and autocrine messengers for coordinated function among cells. Exocytosis requires passage of secretory vesicles through distinct biochemical maturation states (e.g., targeted, docked, or primed) before their fusion with the plasma membrane (1,2). Many of the key molecules and interactions that regulate vesicle maturation have now been biochemically or genetically determined (3,4); moreover, the fine movements and functional states of vesicles before fusion have been studied optically and by electrophysiology (1,5,6). What remains lacking is an integral understanding of how molecules come together in space and time to orchestrate specific changes in vesicle behavior and function.
A key technique to quantify bimolecular interactions in living cells is Förster resonance energy transfer (FRET) imaging (7,8). FRET occurs when an excited-state donor fluorophore (D) transfers resonant energy to an acceptor fluorophore (A). The efficiency with which this occurs is equal to
where r is the D-A distance and Ro is the Förster distance (D-A distance at which FRET efficiency = 50%). The Förster distance is typically ∼2–6 nm, and thus, the dynamic range of FRET measurements occurs on a scale suitable for the study of protein-protein interactions. FRET can be measured by different microscopic methods. The method most highly amenable to rapid time-lapse imaging with quantitative analysis is termed sensitized emission FRET, which visualizes FRET as the enhancement of acceptor fluorescence. Sensitized emission FRET requires precise calibrations of the optical system and fluorophores used, in order to isolate the FRET signal from spectral bleedthrough and cross excitation. Despite the high temporal resolution afforded by sensitized emission FRET, the approach, as implemented under standard epifluorescence illumination, is limited by poor axial resolution due to out-of-focal-plane fluorescence.
More recently, the superior axial resolution achieved with total internal reflection fluorescence (TIRF) illumination has been applied to study processes occurring at or near the cell membrane (6,9–12). TIRF results when light, traveling through a medium of high refractive index, n1 (glass), reaches a medium of lower refractive index, n2 (water), at an angle of incidence exceeding a critical angle,
When this occurs, an evanescent field is generated at the glass-water interface, whose intensity (I) decays exponentially with distance from the interface (z),
where Dp is the characteristic TIRF depth (the z-distance at which the evanescent field decays to 37% of its initial intensity). TIRF microscopy utilizes this exponentially decaying evanescent field to selectively illuminate a thin (100–300 nm) footprint of the cell adjacent to the glass coverslip to which the cell is attached.
Here we develop a combined TIRF-FRET approach to study the interaction between the GTPase Rab27A and its effector Slp4A, on individual insulin-containing granules in living MIN6 cells. Previous implementations of TIRF-FRET in live cells with gene-encoded FRET probes have relied on donor-dequenching FRET (13–16) or sensitized emission intramolecular FRET (17). While donor dequenching TIRF-FRET can report on bimolecular interactions, its use in time-lapse imaging is limited, given the method's destructive requirement of irreversibly bleaching the acceptor fluorophore. Sensitized emission intramolecular FRET, on the other hand, is highly amenable to time-lapse imaging, but only reports on changes in unimolecular conformation. Our TIRF-FRET approach allows FRET probes to be placed on different molecules expressed at different concentrations and can be used to study molecules localized to the plasma membrane, subcellular compartments, or cytosol in living cells. The high axial resolution provided by TIRF allows temporal correlation of changes in intermolecular interactions with visually identifiable functional outcomes at the cell's plasma membrane. Our results demonstrate that upon stimulation of secretion, a dynamic change in the Rab27A/Slp4A interaction occurs in a subset of stimulus-responsive secretory granules, likely before exocytosis. The ability to directly visualize the fine movements of individual granules simultaneous with the intermolecular dynamics maps the change in Rab27A/Slp4A interaction to an increase in granule mobility that is kinetically consistent with induction of granule priming.
Materials and Methods
Optical equipment setup
Our TIRF system (TILL Photonics, Gräfelfing, Germany) was built around an IX71 microscope (Olympus, Melville, NY) and uses a 60× 1.49 NA oil immersion objective (Olympus) mounted on a PIFOC z-drive controller (Physik Instrumente, Karlsruhe, Germany). For illumination, two lasers, namely, a 45-mW, 442-nm diode-pumped solid-state laser (Toptica Photonics, Gräfelfing, Germany) and a 225-mW Argon-ion laser (National Laser Company, Salt Lake City, UT), were combined into an accousto-optic tunable filter, whose output was coupled via unimodal fiber optic into a TILL Polytrope unit on the microscope's back port. Within the Polytrope, light is reflected into the microscope by a mirror, whose angle is adjustable via galvanometer and sets the position of the laser in the objective's back focal plane. This allows rapid control of the incident TIRF angle and the ability to switch between epifluorescence and TIRF modes. The microscope's filter cube contains a dual band laser clean-up filter (z442/514dbx) and laser polychroic mirror (z442/514rdc). Fluorescence emission from CFP and cYFP are separated with a Dual-View beam splitter (MAG Biosystems, Pleasanton, CA) containing a 505dcxr dichroic filter and emission filters for CFP (et480/40) and cYFP (et555/55). All filters were from Chroma Technology (Rockingham, VT). Images are acquired with a Photometrics QuantEM 512SC electromagnetic charge-coupled device camera (Roper Scientific, Tucson, AZ) with 16-μm pixel size. Magnification from the IX71′s 1.6× slide magnifier and a 2.5× beam expander yield a final pixel size of 67 nm (object coordinates). Laser lines and powers, incident angle, z-focus drive, and camera were controlled using MetaMorph software (Molecular Devices, Sunnyvale, CA).
TIRF-FRET imaging
TIRF-FRET imaging used the 442-nm diode-pumped solid-state laser and the 514-nm line of the Argon-ion laser. FRET stoichiometry calculations require the acquisition of three raw images, using different excitation/emission filters:
DD: Donor excitation (442 nm)/Donor emission (480 nm).
DA: Donor excitation (442 nm)/Acceptor emission (555 nm).
AA: Acceptor excitation (514 nm)/Acceptor emission (555 nm).
Laser powers for each line were kept constant for all experiments. Except when stated otherwise, incident angles were adjusted independently to ensure that characteristic TIRF depths of laser lines were matched. The electron multiplication gain and digital gain of the camera were held constant for all three images (DD, DA, and AA), although exposure times of the images differed. Fluorescence intensity was determined to be linear over the exposure times used, allowing for correction. For shade correction (correction of uneven illumination across the optical field), shade images were taken of a blank field (using the same incident TIRF angles as for each experiment), by imaging glass coverslips conjugated with both CFP and cYFP proteins and covered with a physiologic saline solution.
Imaging of MIN6 cells was performed at 32°C in a physiological saline containing 140 mM NaCl, 5 mM KCl, 2.2 mM CaCl2, 1 mM MgCl2, 10 mM NaHEPES, and 2.5 mM glucose, pH 7.4. After acquisition of a series of baseline images under resting conditions (30 s), the cells were induced to undergo exocytosis by application of physiological saline containing 50 mM K+ (≤100 s), with elevated K+ obtained by equimolar substitution for Na+. Image sets (DD, DA, and AA) were acquired at 0.5 Hz.
FRET stoichiometry image analysis
Raw TIRF-FRET image sets (comprised of DD, DA, and AA images) were analyzed offline using MATLAB (The MathWorks, Natick, MA) scripts. Images were aligned with an affine transformation and background-subtracted by using the averaged value within a user-defined background region. Images were shade-corrected by dividing each image by the appropriate normalized shade image. Lastly, images were linearly scaled to account for differences in exposure times between images. The resulting corrected images (CI), termed CIDD, CIDA, and CIAA, were used for analysis.
Sensitized emission FRET analysis used the FRET stoichiometry method (18,19). This method requires determination of four calibration parameters (i.e., α, β, γ, and ξ) that are specific to the optical system and fluorophores used. Images acquired for determination of these calibration parameters used the same incident TIRF angles and laser powers as were used for the experimental data. The values α and β are proportionality constants that allow correction of the contaminated FRET signal (CIDA) from crosstalk (direct excitation of the acceptor by the donor excitation wavelength) and spectral bleed through (spillover of donor emission into the acceptor emission channel), respectively. The value α was determined by using images of cells expressing cYFP, or beads conjugated with cYFP, and calculating the ratio of the CIDA/CIAA image intensities. The value β was determined by using images of cells expressing cerulean, or beads conjugated with CFP, and calculating the ratio of the CIDA/CIDD image intensities. After determination of α and β, the uncontaminated sensitized emission FRET signal can be calculated as
The value γ represents the ratio of extinction coefficients of acceptor/donor, at donor excitation wavelengths, and is required for determining the fraction of acceptor in complex (fA) and molar ratio. The value ξ relates the fluorescence intensity of the acceptor's sensitized emission signal to the fluorescence intensity that would have arisen from the quenched donor. The donor fluorescence quenched by FRET can be calculated as
Determination of ξ is necessary for calculating the fraction of donor in complex (fD), total donor fluorescence, and molar ratio. Both γ and ξ are determined by imaging either cells expressing a linked cYFP-cerulean protein, or beads conjugated with linked CFP-cYFP protein, and solving the FRET equations (below) for γ or ξ, with fA = fD = 1 for a linked construct. Note that determination of γ and ξ requires knowing the characteristic FRET efficiency (Ec) of the linked constructs used for calibration. The value Ec for the CFP-cYFP construct in solution (pH 7.2) was reported to be 0.40, using fluorescence lifetime measurements (19). The value Ec for the cYFP-cerulean construct was determined to be 0.39 in cells, by calculating the apparent FRET efficiency of this construct with calibration constants determined from a cerulean-cYFP construct where Ec had been measured with fluorescence lifetime to be 0.31.
Determination of α, β, γ, and ξ, and acquisition of the three required images (CIDD, CIDA, and CIAA) allows for pixel-by-pixel calculations that generate three new images: apparent FRET efficiency of the acceptor (EA), apparent FRET efficiency of the donor (ED), and molar ratio of total acceptor/donor (Ratio). Apparent FRET efficiencies are used here rather than characteristic FRET efficiencies, because for bimolecular interactions, the FRET signal intensity depends on the extent of interaction between donor and acceptor molecules (i.e., fraction of donor or acceptor molecules in complex) as well as on the efficiency of energy transfer when donor and acceptor molecules are in complex (i.e., characteristic FRET efficiency). As such, apparent FRET efficiencies (EA and ED) represent the product of the characteristic FRET efficiency with either the fraction of acceptor or donor in complex, respectively. EA, ED, and Ratio images were calculated using the equations below:
Evanescent field profile measurement and FRET imaging on fluorescently-labeled silica beads
Measurement of the evanescent profile using fluorescently-labeled silica beads was carried out similarly as described in Mattheyses and Axelrod (20). In brief, 10-μm silica beads, coated with fluoroprotein (CFP, cYFP, or linked CFP-cYFP), were imaged in PBS-EDTA (50 mM Na2HPO4, 150 mM NaCl, 10 mM EDTA, and 0.02% NaN3, pH 7.2) containing 31% glycerol (w/w), to achieve an index of refraction ∼1.372, similar to that of silica beads (n = 1.37). The refractive index of the imaging media was chosen to match the refractive index within a living cell, which has been measured to be ∼1.36–1.39, and was measured in TIRF to be ∼1.38 (21,22).
After beads had settled on the coverslip, TIRF images were taken using a range of incident angles. Only spherical beads ∼10 μm in diameter (approximated with reticule micrometer) were imaged. All beads were imaged at the same location in the TIRF field, and each bead was used for only two TIRF measurements. Focusing of each bead was performed under dim epifluorescence illumination, with the focus initially set to the bead's equatorial plane. The z-focus drive then moved the focal position to the surface of the glass (set to one bead radius, 5 μm, below the bead's equatorial plane) for acquisition of TIRF images. Bead images that were noncircular or that exhibited bright debris were discarded from analysis. Determination of the evanescent profile from bead images used the equations described in Mattheyses and Axelrod (20) and was automated using in-house generated MATLAB scripts.
Relationships of FRET calibration constants and FRET measurements versus z-distance were calculated from the bead images, using FRET stoichiometry equations (18) and the corrected-intensity versus z-distance relationships for the CIDD, CIDA, and CIAA images of each bead. For experiments where soluble cYFP was added to the imaging media, the coverslip was preblocked with bovine serum albumin.
Additional Materials and Methods are available online in the Supporting Material.
Results
Integrating FRET stoichiometry with TIRF microscopy
Our TIRF-FRET method is developed from an epifluorescent sensitized emission FRET approach termed FRET stoichiometry (18,19). FRET stoichiometry uses four calibration constants (α, β, γ, and ξ) to calculate three instrument-independent FRET indices, termed EA and ED (apparent FRET efficiency of acceptor or donor in complex, respectively) and Ratio (molar ratio of acceptor/donor). For bimolecular interactions, the sensitized emission FRET signal depends on the fraction of donor or acceptor molecules in complex as well as the efficiency of energy transfer between donor and acceptor molecules in complex. As such, apparent FRET efficiencies are used here rather than characteristic FRET efficiencies, with EA and ED representing the product of the characteristic FRET efficiency (Ec) with the fraction of acceptor or donor in complex, respectively.
With epifluorescent illumination, FRET stoichiometry calibration constants are determined with the assumption that the illumination intensity remains constant over the z axis. However, with TIRF microscopy, the illumination intensity decays exponentially in the z axis. Moreover, for TIRF-FRET imaging, two lasers are employed for excitation (442 nm and 514 nm), whose evanescent fields may decay with different characteristic depths, depending on each laser's wavelength and angle of incidence:
Therefore, central to our TIRF-FRET approach is defining the evanescent field for both excitation sources used for FRET imaging.
The evanescent field profiles for the excitation lines were determined by imaging 10-μm spherical silica beads coated uniformly with fluoroprotein and resting on a glass coverslip (20) (Fig. 1 a). Each pixel on the TIRF image of the bead represents fluorescence originating from the bead surface at a specific z-distance from the coverslip, determinable given the geometry of a sphere (Fig. 1 b). The fluorescence intensity of each pixel on the TIRF image is directly proportional to the intensity of the evanescent field at the z-distance of that pixel's corresponding bead surface. The fluorescence-intensity versus corresponding-bead surface z-distance relationship was fitted to a double-exponential function (I = Ae−z / Dp1 + Be−z / Dp2) allowing determination of the characteristic TIRF depth. As previously reported, a double-exponential function was used rather than a single exponent, as it was found to better fit the data (20). Here, the characteristic TIRF depth is equal to the decay constant of the fast exponential component; the slow exponential component is thought to result from light scatter within the objective. Fig. 1, c and d, shows the characteristic TIRF depths measured over a range of incident angles for the 442-nm and 514-nm lines. The solid lines plot the theoretical relationships assuming two different indices of refraction for the imaging media (n2 = 1.37 or 1.38). Because the beads were imaged in a solution whose index of refraction was 1.372, the experimentally determined values for characteristic depth fell within the theoretically expected range.
Figure 1.

Evanescent field effects on FRET calibrations and TIRF-FRET. (a) Representative raw and pseudocolored images of cYFP-coated beads imaged under epifluorescence or TIRF (514-nm laser line). Characteristic TIRF depth is indicated below each image. (b) Schematic depicting determination of z-distance using beads. A fluorophore-coated bead with radius, R, rests on a glass coverslip. Each pixel of the TIRF bead footprint is at a specific radial distance, d, corresponding to fluorescence from a z-distance, z1, from the coverslip. (c) Average characteristic TIRF depths were calculated from beads imaged with the 442-nm line (purple markers) using five incident angles, and plotted against the incident TIRF angle, which was measured using a prism. (Solid curves) Theoretical relationships between D442 and angle of incidence (n1 = 1.515, n2 = 1.37 or 1.38). Beads were imaged in a solution where n ∼ 1.372. (d) Similar to panel c, except that beads were imaged using the 514-nm laser line; theoretical relationships were determined for a 514-nm laser. (Markers) Mean ± SE. For panels c and d, n = number of beads. (e–j) Effects of three TIRF illumination conditions on FRET constants and FRET efficiency. (Black) D442, D514 ∼ 270 nm. (Purple) D442 ∼ 280 nm, D514 ∼ 140 nm. (Green) D442 ∼ 160 nm, D514 ∼ 270 nm. Plots were normalized to the value at z = 0. For panels e–g, α, γ, and ξ versus z-distance, respectively. The value β does not vary with z-distance (data not shown). (h–j) EA, ED, and Ratio versus z-distance, respectively. Error-free measurements would be evident as horizontal lines with EA, ED = 0.4, and Ratio = 1. (Markers) Mean ± SE (n = purple, green, black): α (7,7,12); β (6,8,6); and ξ, γ, EA, ED, Ratio (7,4,10).
As characteristic TIRF depths vary with laser wavelength and angle of incidence, we next examined the effects of mismatched TIRF depths on FRET calibration constants and on calculated FRET parameters. Fluorophore-coated beads were imaged under three different illumination conditions, in which characteristic depths of the 442 nm (D442) and 514 nm (D514) lines were:
Normalized α, γ, and ξ versus z-distance relationships were calculated using the requisite fluorescence-intensity versus bead-surface z-distance relationships (Fig. 1, e–g). The value β was excluded, because its determination depends on emission filters and does not vary with z-distance. Importantly, FRET calibration constants remained constant over z-distance only when D442 and D514 were matched.
Whereas z-distances are easily determined on spherical beads, live cell imaging lacks this z-information. Measurement of FRET calibration constants in a cell yields a single value for each constant, rather than a relationship of each constant versus z-distance as shown in Fig. 1, e–g. This is because in a cell, the measured fluorescence intensity represents the sum of fluorescence intensities arising from all z-distances of the cell. To estimate the FRET calibration constants that would be measured from a cell under our different illumination conditions, we summed the averaged fluorescence intensities over the entire bead radius for CIDD, CIDA, and CIAA images, and used these summed intensities to determine α, β, γ, and ξ.
These calibration constants were then applied toward calculation of FRET indices versus z-distance relationships to estimate the magnitude of error that might result from mismatched TIRF depths (Fig. 1, h–j). Error-free measurements of EA and ED should be apparent as a horizontal line at 0.40 (Ec of the linked CFP-cYFP probe); similarly, error-free measurements of Ratio should be apparent as a horizontal line at 1.0. Notably, FRET indices were accurately reported over z-distance only when D442 and D514 were matched. When D442 and D514 were mismatched, the largest errors in FRET indices occurred at z-distances < 500 nm, where most of the relevant TIRF-FRET measurements are taken. These experiments underscore the importance of matching the characteristic depths of excitation sources used for sensitized emission TIRF-FRET imaging.
Sensitized emission TIRF-FRET on moving compartments: effects of z-distance motions on FRET calculations
Because the evanescent field decays exponentially in the z-dimension, fluorescence intensity under TIRF can be used as a highly sensitive gauge of motion in the z axis (23,24). Indeed, one of the major uses of time-lapse TIRF imaging in live cells involves studying the motions of specific subcellular compartments (e.g., secretory granules) in cells over time (5,6,25–27,29,30). For TIRF-FRET imaging, however, the presence of cytosolic fluorophore can potentially confound time-lapse TIRF-FRET measurements on subcellular compartments, especially if the compartment moves in the z axis.
To understand how changes in the z-motion of a compartment might result in changes in the measured FRET values, we imaged 10-μm silica beads coated with linked CFP-cYFP protein, with three different concentrations of soluble cYFP added to the imaging solution. The soluble cYFP represents different extents of cytosolic localization of the acceptor; the donor remains fully localized to the compartment (Fig. 2 a). Fig. 2 b shows the EA versus z-distance relationships measured from the beads. The measured EA values show an apparent decrease with increasing z-distances of the compartment from the glass interface, in a graded manner that depends on the soluble acceptor concentration. This effect results from an exponential decrease in FRET signal (localized to the compartment) as the compartment moves away from the glass interface. As the space between the coverglass and bead grows, it is filled with soluble acceptor. Depending on the relative concentrations of soluble acceptor and compartment-localized acceptor, the intensity of the total acceptor signal either decreases (in a less-than-exponential fashion) or increases, with a resulting decrease in EA. In Fig. 2 c, the measured ED versus z-distance relationships are shown. ED exhibits minimal changes over z-distance, because both the FRET signal and total donor signal localize completely to the compartment and are thus subject to the same relative changes in intensity as the compartment moves in the z-direction. Fig. 2 d demonstrates that the measured Ratio increases as the compartment moves away from the glass interface, with larger increases in Ratio occurring with higher concentrations of soluble cYFP in the imaging media. These results demonstrate that when the acceptor FRET probe exhibits partially cytosolic localization, then the apparent FRET efficiency of the donor (ED) can be used as a measure of FRET that is independent of z-axis motions of the compartment. However, under some circumstances, the apparent FRET efficiency of the probe exhibiting multiple subcellular localizations (EA in this case) may be reliable, depending on the fraction of the probe localized to the subcellular compartment and the extent to which the compartment moves in the z axis.
Figure 2.
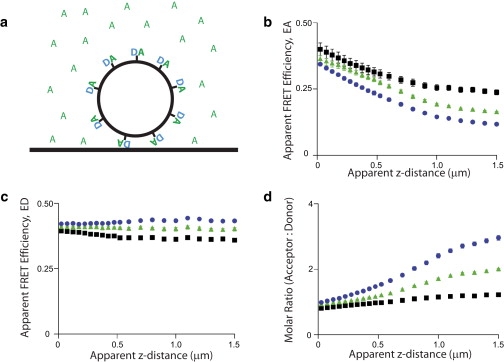
Effects of soluble fluorophore on FRET measured on compartments under TIRF microscopy. (a) Schematic representing silica bead coated with linked FRET probe resting on glass coverslip and imaged with given concentrations of soluble acceptor. Relationships of (b) EA versus z-distance, (c) ED versus z-distance, and (d) Ratio versus z-distance, were determined using beads conjugated with linked CFP-cYFP, with soluble cYFP added to the media. The three curves in each plot represent different concentrations of soluble cYFP, where the off-bead cYFP fluorescence intensity was determined to be 4% (black squares), 12% (green triangles), or 18% (blue circles) of the peak on-bead fluorescence. TIRF-FRET imaging used D442 = D514 ∼270 nm. (Markers) Mean ± SE. The number of beads used for each condition was, for soluble acceptor of 4%, n = 8; 12%, n = 10; and 18%, n = 11.
The above results were further corroborated using a mathematical model that simulates TIRF-FRET measurements under various conditions. Our model was based on that described in Hoppe et al. (19), except that illumination intensity decays exponentially in the z dimension (see the additional Materials and Methods in the Supporting Material). Notably, when the model was used to simulate the experimental conditions used for Fig. 2, b–d, it accurately matched the shapes and trends of the experimentally measured EA, ED, and Ratio relationships (Fig. S1 in the Supporting Material). Importantly, this model can be modified to simulate secretory granules as well, for instance, to model apparent changes in FRET measurements that might occur on secretory granules as they move in the z axis within a cell, with different subcellular localizations of donor and acceptor fluorophores (Fig. S1).
TIRF-FRET measurements of control compartmentalized FRET probes
To test our sensitized emission TIRF-FRET measurements under controlled conditions in living cells, we constructed a linked cYFP-cerulean FRET probe fused to the N-terminus of the secretory granule membrane protein VAMP2 (linked-VAMP2). Mouse insulinoma (MIN6) cells were transfected with the linked-VAMP2 construct alone, or in addition to soluble cerulean or citrine, and TIRF-FRET images of these cells were taken with D442 and D514 matched ∼270 nm. Representative images of cell footprints and resulting FRET indices are shown in Fig. 3 a. The averaged values of fraction of acceptor in complex (fA), fraction of donor in complex (fD), and molar ratio, were determined on individual granules from the three expression conditions (Fig. 3, b–d). Cells expressing linked-VAMP2 alone correctly demonstrated fA = fD = 1, and ratio = 1. Addition of soluble cerulean resulted in a decrease in fD and molar ratio, whereas addition of soluble cYFP resulted in a decrease in fA and increase in molar ratio. Comparable results were obtained in experiments using a linked cYFP-cerulean FRET probe fused to a plasma membrane-targeted pleckstrin homology domain (Fig. S2). These data demonstrate that sensitized emission TIRF-FRET accurately reports FRET indices in living cells, when fluorescence signals localize to the plasma membrane, subcellular organelles, or cytosol.
Figure 3.
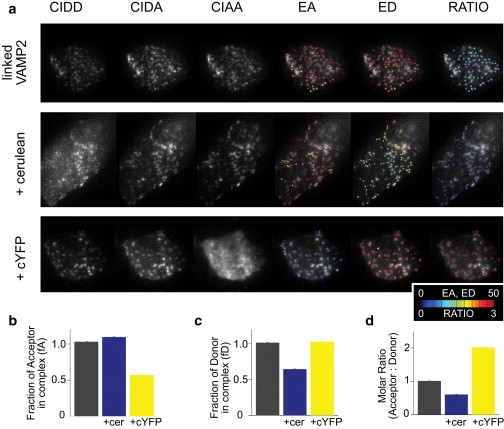
Intramolecular FRET measured on secretory granules under TIRF illumination. Experiments utilized a linked cYFP-cerulean FRET probe, fused to VAMP2, to target the probe to secretory granules. (a) MIN6 cells transfected with plasmids expressing cYFP-cerulean-VAMP2 (linked-VAMP2) alone (top row), or in addition to soluble cerulean (middle row) or soluble cYFP (bottom row). For images of EA, ED, and Ratio, the values on each individual granule were pseudocolored and overlaid on the CIDA image. (b) Averaged fraction of acceptor in complex. (c) Averaged fraction of donor in complex. (d) Averaged molar ratio. (Bars) Mean ± SE. Linked-VAMP2 (417 granules/12 cells); Linked-VAMP2 + cerulean (358:13); and Linked-VAMP2 + cYFP (551:10). FRET stoichiometry calibration constants were obtained using cerulean-VAMP2 (for β), cYFP-VAMP2 (for α), or linked-VAMP2 (for γ and ξ).
TIRF-FRET monitoring of Rab27A-GTP/Slp4A interaction on individual insulin granules
A central goal underlying development of sensitized emission TIRF-FRET in living cells was to establish a means to identify, quantify, and sequence dynamic changes in specific protein-protein interactions, and relate these changes to functional outcomes. In regulated exocytosis, members of the Rab GTPase family and their effectors are required for secretory vesicle targeting (31–33). In insulin secretion, Rab27A plays an important role in targeting and tethering granules to the plasma membrane (34,35) in addition to regulating granule priming (36). Rab27A's function requires its ability to cycle between GTP- and GDP-bound states, with Rab27A-GDP inhibiting and Rab27A-GTP facilitating insulin secretion (37). Rab27A-GTP's action on insulin secretion occurs, in part, via interaction with its primary effector, Slp4A (38). The spatiotemporal dynamics of the Rab27A-GTP/Slp4A interaction and their relationship to secretory granule behavior remains unknown.
To quantify spatiotemporal changes in interaction between Rab27A-GTP/Slp4A in living cells, we developed a FRET assay that reports specifically on this bimolecular interaction. Slp4A(wt) interacts with both GTP- and GDP-bound forms of Rab27A in vitro (37). Thus, we used a mutant within the SHD2 motif of Slp4A, termed Slp4A(AG), which specifically binds Rab27A-GTP (37). Rab27A and Slp4A(AG) were fluorophore-tagged at their N-terminus to generate FRET probes. These probes localize to secretory granules, demonstrate normal biological function, and report specifically on the Rab27A-GTP/Slp4A interaction (Fig. S3). We termed the FRET pair, CFP-Rab27A and cYFP-Slp4A(AG), as the Reporter of Activated Rab27A-Slp4A (i.e., ROAR-S) interaction.
While Rab-GTPase/effector interactions target vesicles to appropriate membrane domains, the extent to which these vesicles demonstrate heterogeneity in the Rab-effector interaction as a result of differences in vesicle maturity remains unknown. Fig. 4 a shows a CIDD image of a representative cell at rest, juxtaposed with a spatial map of initial apparent FRET efficiency (ED) calculated on individual granules. Frequency histograms of initial ED values on granules demonstrated a roughly normal distribution, indicating that in the basal state, major granule subpopulations based on ROAR-S FRET are unlikely to exist (Fig. 4 b).
Figure 4.
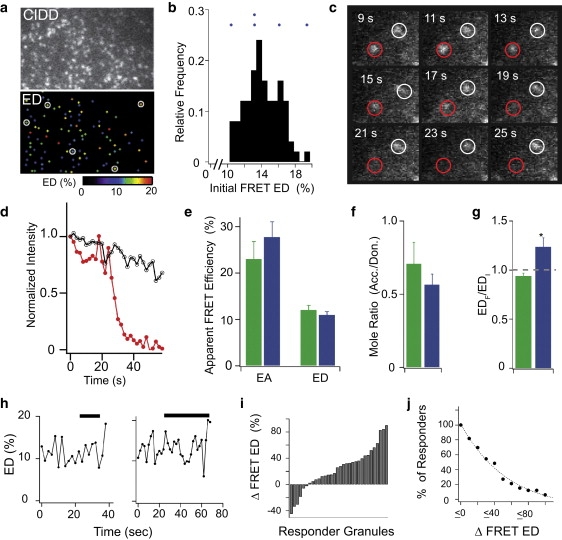
TIRF-FRET imaging of MIN6 cells transfected with ROAR-S FRET probes. (a) Raw TIRF image (upper, 442-nm excitation), and spatial map of baseline granule ED values (lower) in region of a representative cell. (b) Frequency histogram of baseline granule ED values for cell in panel a. Dots above histogram denote initial ED values (EDI) of responder granules from this cell. (c) TIRF donor excitation/emission (CIDD) images of responder (red circle) and nonresponder (white circle) granules, during the elevated K+ stimulus. (d) Normalized intensity versus time for granules in panel c. (e) Averaged initial EA, ED, and (f) molar ratio values of responder (blue) and nonresponder (green) granules from a population of cells. (g) Fractional change in ED (EDF/EDI) for responders and nonresponders. ED was tracked as it yields z-motion independent changes in apparent FRET efficiency on an organelle, when the donor is largely restricted to the organelle, as is the case for CFP-Rab27A on granules (see Fig S3 legend). (Bars) Mean ± SE (n = 10 cells). (h) ED time course for two individual responder granules. (Solid bars) Application of elevated K+. (i) Normalized change in ED (EDF/EDI), and (j) cumulative frequency plot of change in ED for all responding granules.
To determine whether changes in Rab27A-GTP/Slp4A interaction occur during insulin granule secretion, cells were stimulated to undergo exocytosis by application of saline containing elevated [K+]. Time-lapse TIRF-FRET movies were captured to correlate changes in ROAR-S FRET with individual secretory granule behavior (Movie S1, Movie S2, and Movie S3 in the Supporting Material). Granules that disappeared in response to the stimulus were termed responders, while those that remained stable were termed nonresponders. Fig. 4 c shows CIDD images taken of two neighboring granules, one of which responds by a rapid loss of fluorescence intensity (Fig. 4 d) during the secretory stimulus. Responders covered a wide range of initial ED values, depicted as dots above the basal ED frequency histogram (Fig. 4 b), and were not observed to be spatially clustered (Fig. 4 a, open circles). No significant difference was observed in the average initial ED, EA, or molar ratio values between responders and nonresponders (Fig. 4, e and f), suggesting that initial ROAR-S FRET indices do not correlate with subsequent granule behavior.
Notably, responder granules exhibited a significant increase in ED before disappearance (expressed as ratio of ED at final and initial time points, EDF/EDI), while nonresponders showed no significant change at comparable time points (Fig. 4 g). Time courses of ED for individual responder granules demonstrated that the increase in ED generally occurred just before disappearance (Fig. 4 h). Indeed, 24 (72%) of the 32 responder granules demonstrated an increase in ED immediately before disappearance (Fig. 4 i). Moreover, 50% of responders demonstrated increases in ED >30% (Fig. 4 j), suggesting that this increase is robust.
A considerable strength of TIRF-FRET is that the dynamics of molecular complexes on individual granules, as reported by FRET, can be directly time-synchronized to secretory granule behavior (e.g., mobility, docking, fusion), as visualized by TIRF. To pinpoint when the increase in ED occurred relative to granule disappearance, we synchronized ED time courses of all responder granules to their time of disappearance. When averaged, an increase in ED was observed in the 5 s before granule disappearance (Fig. 5 a). A similar result was observed using an alternative method of FRET quantification where the isolated FRET signal (spillover of the donor and crosstalk from the acceptor into the FRET channel were removed) is plotted as a ratio of the donor (CIDD) signal (Fig. 5 b). Simultaneous tracking of granule mobility demonstrated that during these 5 s, responders specifically underwent a threefold increase in X-Y velocity and large increases in X-Y travel compared to nonresponders at similar time points (Fig. 5, c–f). Recent TIRF studies in bovine adrenal chromaffin cells have demonstrated that, immediately preceding exocytosis, secretory granules exhibit an increase in X-Y mobility and travel, with mobility increasing by 100% within 200 ms of fusion (26,39). Given the similarities in mobility profile to fusing adrenal chromaffin granules, we believe that the disappearance of our responder granules represents fusion.
Figure 5.
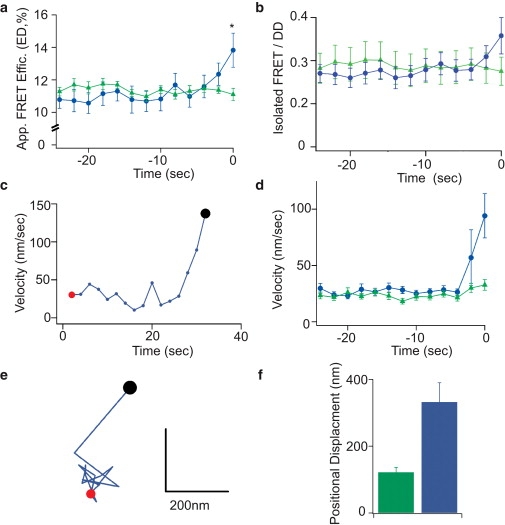
Dynamic interaction of Rab27A-GTP with Slp4A on insulin granules. For plots of FRET indices, individual granule time courses were aligned to time of disappearance (time = 0) before averaging. Nonresponders (green triangles) were aligned to similar time points as responders (blue circles) from each cell and averaged. (a) Time course of apparent FRET efficiency ED before granule disappearance. (b) Time course of isolated FRET/DD before granule disappearance. (c) X-Y velocity versus time relationship for a representative responder granule, and (d) averaged over the granule populations. (e) X-Y positional trajectory of a representative responder granule, from the initial time point (red circle) to the time point before disappearance (black circle), and (f) positional displacement expressed as ratio of final/initial position averaged over the granule populations.
Rab-GTPases cycle on and off membrane compartments as a function of their nucleotide state. Our TIRF-FRET approach can also be used to monitor the cycling of donor and acceptor proteins on and off subcellular compartments. Interestingly, the total fluorescence intensities of both donor and acceptor fluoroproteins decreased selectively on responder granules 5 s preceding granule disappearance, while the molar ratio remained largely stable (Fig. S4). These results indicate that, coincident with the stimulus-induced increase in FRET ED, there occur equivalent losses in total acceptor and donor from the responding granules. The alternative explanation that responder granules are simply moving away from the plasma membrane could not account for the increase in ED that was observed on these granules based on our mathematical model (see Fig. S4 legend for further discussion).
Discussion
Although biochemical and genetic approaches have identified many of the key molecules involved in specific cellular functions, direct visualization of the spatiotemporal dynamics and sequencing of the protein interactions that govern specific cell functions in living cells has been lacking. Here, we develop sensitized-emission TIRF-FRET microscopy as an approach for quantifying the dynamics of protein-protein interactions coincident with events occurring at or adjacent to the plasma membrane. The accuracy of the approach depends on closely matching the evanescent profiles of the lasers used for TIRF illumination. The FRET stoichiometry method used here, while requiring calibrations for the optical system and probes, is advantageous in its suitability for time-lapse imaging, as well as in its flexibility for probe localization and concentration. Our experiments demonstrate that sensitized emission TIRF-FRET accurately reports on bimolecular interactions of probes localized to the plasma membrane, secretory granules, or cytosol. The combination of TIRF and FRET optical technologies represents a significant advance over prior reports, where its use has been limited to in vitro studies of single molecules (40,41), and to studies of changes in molecular conformation of single plasma membrane-localized proteins (42). Our method results in a complete and quantitative FRET analysis under TIRF, extension to imaging of bimolecular interactions in living cells, and simultaneous correlation of molecular dynamics to cell functions occurring at or adjacent to the plasma membrane.
Using TIRF-FRET to study insulin granule exocytosis, we were able to pinpoint a dynamic in the Rab27A/Slp4A interaction that is temporally linked to an increase in granule mobility that occurs specifically on a set of secretory stimulus-responsive granules. Interestingly, this dynamic occurs concurrently with an equimolar loss of Rab27A and Slp4A from these granules. The Rab27A-GTP/Slp4A interaction on insulin granules is thought to facilitate targeting of granules to the plasma membrane via formation of a docking structure with the plasma membrane-localized Syntaxin1A/Munc18 complex (34,43,44). Yet, Rab27A has also been reported to regulate granule priming (36), during which rearrangement of the Syntaxin1A/Munc18 complex is believed to occur to allow formation of ternary SNARE complexes. Interestingly, analysis of exocytotic events in the endocrine BON cell line demonstrated that a significant fraction of vesicles underwent a well-defined 20-nm step approach toward the plasma membrane within 3 s of fusion, with the step postulated to represent transition from a tethered to docked state (45). In addition, an increase in X-Y mobility of chromaffin granules before fusion was previously reported and was suggested to reflect priming or initiation of membrane fusion (26,39). Electrophysiology studies in chromaffin cells have established that secretory granules transition in and out of primed states on a timescale of several seconds (1,46,47), which is kinetically consistent with the observed dynamics in our experiments. We hypothesize that the increase in ROAR-S FRET and granule mobility, and the loss of Rab27A and Slp4A from granules all occur during granule priming.
Importantly, this hypothesis and others can be tested with sensitized emission TIRF-FRET microscopy, which can be applied to elucidate the spatiotemporal sequencing of many relevant molecular interactions with respect to synaptic vesicle and secretory granule behavior. Development and monitoring of additional spectrally distinct fluorophores will allow expansion of this approach to simultaneous monitoring of granule lumen-targeted probes for direct quantification of axial mobility and granule fusion. In this manner, a spatial and temporal map of molecular interactions can be created to better establish how molecules come together in space and time to dictate granule behavior and other membrane-trafficking events.
Acknowledgments
The authors thank Ron Holz, Daniel Axelrod, Bishr Omary, and Adam Hoppe for helpful discussion.
This work was supported by the National Institutes of Health (grant Nos. DK077050 and NS053978 to E.L.S., and No. F31 NS053263 to A.D.L.), the American Diabetes Association (grant No. 7-08-RA-160), and the combined Morphology Core of the Michigan Diabetes Research and Training Center (National Institutes of Health DK020572), and Michigan Gastrointestinal Peptide Center (B30 DK-34933).
Supporting Material
References
- 1.Sørensen J.B. Formation, stabilization and fusion of the readily releasable pool of secretory vesicles. Pflugers Arch. 2004;448:347–362. doi: 10.1007/s00424-004-1247-8. [DOI] [PubMed] [Google Scholar]
- 2.Jahn R., Lang T., Südhof T.C. Membrane fusion. Cell. 2003;112:519–533. doi: 10.1016/s0092-8674(03)00112-0. [DOI] [PubMed] [Google Scholar]
- 3.Jahn R., Scheller R.H. SNAREs—engines for membrane fusion. Nat. Rev. Mol. Cell Biol. 2006;7:631–643. doi: 10.1038/nrm2002. [DOI] [PubMed] [Google Scholar]
- 4.Rizo J., Rosenmund C. Synaptic vesicle fusion. Nat. Struct. Mol. Biol. 2008;15:665–674. doi: 10.1038/nsmb.1450. [DOI] [PMC free article] [PubMed] [Google Scholar]
- 5.Oheim M., Loerke D., Chow R.H. The last few milliseconds in the life of a secretory granule. Docking, dynamics and fusion visualized by total internal reflection fluorescence microscopy (TIRFM) Eur. Biophys. J. 1998;27:83–98. doi: 10.1007/s002490050114. [DOI] [PubMed] [Google Scholar]
- 6.Steyer J.A., Almers W. Tracking single secretory granules in live chromaffin cells by evanescent-field fluorescence microscopy. Biophys. J. 1999;76:2262–2271. doi: 10.1016/S0006-3495(99)77382-0. [DOI] [PMC free article] [PubMed] [Google Scholar]
- 7.Lakowicz J.R. Kluwer Academic/Plenum; New York: 1999. Principles of Fluorescence Spectroscopy. [Google Scholar]
- 8.Periasamy A., Day R.N. Oxford University Press; New York: 2005. Molecular Imaging: FRET Microscopy and Spectroscopy. [Google Scholar]
- 9.Oheim M. Imaging transmitter release. II. A practical guide to evanescent-wave imaging. Lasers Med. Sci. 2001;16:159–170. doi: 10.1007/pl00011350. [DOI] [PubMed] [Google Scholar]
- 10.Jaiswal J.K., Simon S.M. Imaging single events at the cell membrane. Nat. Chem. Biol. 2007;3:92–98. doi: 10.1038/nchembio855. [DOI] [PubMed] [Google Scholar]
- 11.Greaves J., Duncan R.R., Chow R.H. Use of ANF-EGFP for the visualization of secretory vesicles in bovine adrenal chromaffin cells. Ann. N. Y. Acad. Sci. 2002;971:275–276. doi: 10.1111/j.1749-6632.2002.tb04477.x. [DOI] [PubMed] [Google Scholar]
- 12.Axelrod D., Burghardt T.P., Thompson N.L. Total internal reflection fluorescence. Annu. Rev. Biophys. Bioeng. 1984;13:247–268. doi: 10.1146/annurev.bb.13.060184.001335. [DOI] [PubMed] [Google Scholar]
- 13.Bal M., Zaika O., Shapiro M.S. Calmodulin binding to M-type K+ channels assayed by TIRF/FRET in living cells. J. Physiol. 2008;586:2307–2320. doi: 10.1113/jphysiol.2008.152777. [DOI] [PMC free article] [PubMed] [Google Scholar]
- 14.Fowler C.E., Aryal P., Slesinger P.A. Evidence for association of GABAB receptors with Kir3 channels and regulators of G protein signaling (RGS4) proteins. J. Physiol. 2007;580:51–65. doi: 10.1113/jphysiol.2006.123216. [DOI] [PMC free article] [PubMed] [Google Scholar]
- 15.Khakh B.S., Fisher J.A., Lester H.A. An Ångstrom scale interaction between plasma membrane ATP-gated P2X2 and α4β2 nicotinic channels measured with fluorescence resonance energy transfer and total internal reflection fluorescence microscopy. J. Neurosci. 2005;25:6911–6920. doi: 10.1523/JNEUROSCI.0561-05.2005. [DOI] [PMC free article] [PubMed] [Google Scholar]
- 16.Riven I., Iwanir S., Reuveny E. GIRK channel activation involves a local rearrangement of a preformed G protein channel complex. Neuron. 2006;51:561–573. doi: 10.1016/j.neuron.2006.08.017. [DOI] [PubMed] [Google Scholar]
- 17.Dovas A., Gevrey J.C., Cox D. Regulation of podosome dynamics by WASp phosphorylation: implication in matrix degradation and chemotaxis in macrophages. J. Cell Sci. 2009;122:3873–3882. doi: 10.1242/jcs.051755. [DOI] [PMC free article] [PubMed] [Google Scholar]
- 18.Beemiller P., Hoppe A.D., Swanson J.A. A phosphatidylinositol-3-kinase-dependent signal transition regulates ARF1 and ARF6 during Fcγ receptor-mediated phagocytosis. PLoS Biol. 2006;4:e162. doi: 10.1371/journal.pbio.0040162. [DOI] [PMC free article] [PubMed] [Google Scholar]
- 19.Hoppe A., Christensen K., Swanson J.A. Fluorescence resonance energy transfer-based stoichiometry in living cells. Biophys. J. 2002;83:3652–3664. doi: 10.1016/S0006-3495(02)75365-4. [DOI] [PMC free article] [PubMed] [Google Scholar]
- 20.Mattheyses A.L., Axelrod D. Direct measurement of the evanescent field profile produced by objective-based total internal reflection fluorescence. J. Biomed. Opt. 2006;11:014006. doi: 10.1117/1.2161018. [DOI] [PubMed] [Google Scholar]
- 21.Oheim M., Loerke D., Stühmer W. Evanescent-wave microscopy: a new tool to gain insight into the control of transmitter release. Philos. Trans. R. Soc. Lond. B Biol. Sci. 1999;354:307–318. doi: 10.1098/rstb.1999.0382. [DOI] [PMC free article] [PubMed] [Google Scholar]
- 22.van Manen H.J., Verkuijlen P., Otto C. Refractive index sensing of green fluorescent proteins in living cells using fluorescence lifetime imaging microscopy. Biophys. J. 2008;94:L67–L69. doi: 10.1529/biophysj.107.127837. [DOI] [PMC free article] [PubMed] [Google Scholar]
- 23.Axelrod D. Total internal reflection fluorescence microscopy. Methods Cell Biol. 1989;30:245–270. doi: 10.1016/s0091-679x(08)60982-6. [DOI] [PubMed] [Google Scholar]
- 24.Axelrod D.D. Total internal reflection fluorescence microscopy in cell biology. Traffic. 2001;2:764–774. doi: 10.1034/j.1600-0854.2001.21104.x. [DOI] [PubMed] [Google Scholar]
- 25.Allersma M.W., Wang L., Holz R.W. Visualization of regulated exocytosis with a granule-membrane probe using total internal reflection microscopy. Mol. Biol. Cell. 2004;15:4658–4668. doi: 10.1091/mbc.E04-02-0149. [DOI] [PMC free article] [PubMed] [Google Scholar]
- 26.Degtyar V.E., Allersma M.W., Holz R.W. Increased motion and travel, rather than stable docking, characterize the last moments before secretory granule fusion. Proc. Natl. Acad. Sci. USA. 2007;104:15929–15934. doi: 10.1073/pnas.0705406104. [DOI] [PMC free article] [PubMed] [Google Scholar]
- 27.Becherer U., Pasche M., Rettig J. Quantifying exocytosis by combination of membrane capacitance measurements and total internal reflection fluorescence microscopy in chromaffin cells. PLoS ONE. 2007;2:e505. doi: 10.1371/journal.pone.0000505. [DOI] [PMC free article] [PubMed] [Google Scholar]
- 28.Reference deleted in proof.
- 29.Wiegand U.K., Don-Wauchope A., Chow R.H. Exocytosis studies in a chromaffin cell-free system: imaging of single-vesicle exocytosis in a chromaffin cell-free system using total internal reflection fluorescence microscopy. Ann. N. Y. Acad. Sci. 2002;971:257–261. doi: 10.1111/j.1749-6632.2002.tb04472.x. [DOI] [PubMed] [Google Scholar]
- 30.Zenisek D., Steyer J.A., Almers W. Transport, capture and exocytosis of single synaptic vesicles at active zones. Nature. 2000;406:849–854. doi: 10.1038/35022500. [DOI] [PubMed] [Google Scholar]
- 31.Zerial M., McBride H. Rab proteins as membrane organizers. Nat. Rev. Mol. Cell Biol. 2001;2:107–117. doi: 10.1038/35052055. [DOI] [PubMed] [Google Scholar]
- 32.Novick P., Medkova M., Grosshans B. Interactions between Rabs, tethers, SNAREs and their regulators in exocytosis. Biochem. Soc. Trans. 2006;34:683–686. doi: 10.1042/BST0340683. [DOI] [PubMed] [Google Scholar]
- 33.Grosshans B.L., Ortiz D., Novick P. Rabs and their effectors: achieving specificity in membrane traffic. Proc. Natl. Acad. Sci. USA. 2006;103:11821–11827. doi: 10.1073/pnas.0601617103. [DOI] [PMC free article] [PubMed] [Google Scholar]
- 34.Kasai K., Ohara-Imaizumi M., Izumi T. Rab27A mediates the tight docking of insulin granules onto the plasma membrane during glucose stimulation. J. Clin. Invest. 2005;115:388–396. doi: 10.1172/JCI22955. [DOI] [PMC free article] [PubMed] [Google Scholar]
- 35.Fukuda M. Versatile role of Rab27 in membrane trafficking: focus on the Rab27 effector families. J. Biochem. 2005;137:9–16. doi: 10.1093/jb/mvi002. [DOI] [PubMed] [Google Scholar]
- 36.Merrins M.J., Stuenkel E.L. Kinetics of Rab27A-dependent actions on vesicle docking and priming in pancreatic β-cells. J. Physiol. 2008;586:5367–5381. doi: 10.1113/jphysiol.2008.158477. [DOI] [PMC free article] [PubMed] [Google Scholar]
- 37.Fukuda M. Slp4-A/granuphilin-A inhibits dense-core vesicle exocytosis through interaction with the GDP-bound form of Rab27A in PC12 cells. J. Biol. Chem. 2003;278:15390–15396. doi: 10.1074/jbc.M213090200. [DOI] [PubMed] [Google Scholar]
- 38.Yi Z., Yokota H., Izumi T. The Rab27A/granuphilin complex regulates the exocytosis of insulin-containing dense-core granules. Mol. Cell. Biol. 2002;22:1858–1867. doi: 10.1128/MCB.22.6.1858-1867.2002. [DOI] [PMC free article] [PubMed] [Google Scholar]
- 39.Allersma M.W., Bittner M.A., Holz R.W. Motion matters: secretory granule motion adjacent to the plasma membrane and exocytosis. Mol. Biol. Cell. 2006;17:2424–2438. doi: 10.1091/mbc.E05-10-0938. [DOI] [PMC free article] [PubMed] [Google Scholar]
- 40.Kozuka J., Yokota H., Yanagida T. Dynamic polymorphism of single actin molecules in the actin filament. Nat. Chem. Biol. 2006;2:83–86. doi: 10.1038/nchembio763. [DOI] [PubMed] [Google Scholar]
- 41.Margeat E., Kapanidis A.N., Weiss S. Direct observation of abortive initiation and promoter escape within single immobilized transcription complexes. Biophys. J. 2006;90:1419–1431. doi: 10.1529/biophysj.105.069252. [DOI] [PMC free article] [PubMed] [Google Scholar]
- 42.Tateyama M., Abe H., Kubo Y. Ligand-induced rearrangement of the dimeric metabotropic glutamate receptor 1α. Nat. Struct. Mol. Biol. 2004;11:637–642. doi: 10.1038/nsmb770. [DOI] [PubMed] [Google Scholar]
- 43.Gomi H., Mizutani S., Izumi T. Granuphilin molecularly docks insulin granules to the fusion machinery. J. Cell Biol. 2005;171:99–109. doi: 10.1083/jcb.200505179. [DOI] [PMC free article] [PubMed] [Google Scholar]
- 44.Torii S., Takeuchi T., Izumi T. Rab27 effector granuphilin promotes the plasma membrane targeting of insulin granules via interaction with syntaxin 1A. J. Biol. Chem. 2004;279:22532–22538. doi: 10.1074/jbc.M400600200. [DOI] [PubMed] [Google Scholar]
- 45.Karatekin E., Tran V.S., Henry J.P. A 20-nm step toward the cell membrane preceding exocytosis may correspond to docking of tethered granules. Biophys. J. 2008;94:2891–2905. doi: 10.1529/biophysj.107.116756. [DOI] [PMC free article] [PubMed] [Google Scholar]
- 46.Neher E. A comparison between exocytic control mechanisms in adrenal chromaffin cells and a glutamatergic synapse. Pflugers Arch. 2006;453:261–268. doi: 10.1007/s00424-006-0143-9. [DOI] [PubMed] [Google Scholar]
- 47.Ashery U., Varoqueaux F., Rettig J. Munc13-1 acts as a priming factor for large dense-core vesicles in bovine chromaffin cells. EMBO J. 2000;19:3586–3596. doi: 10.1093/emboj/19.14.3586. [DOI] [PMC free article] [PubMed] [Google Scholar]
Associated Data
This section collects any data citations, data availability statements, or supplementary materials included in this article.