

Abstract
When microtubules are depolymerized in spreading cells, they experience morphological oscillations characterized by a period of about a minute, indicating that normal interactions between the microfilament and microtubule systems have been significantly altered. This experimental system provides a test bed for the development of both fine- and coarse-grained models of complex motile processes, but such models need to be adequately informed by experiment. Using criteria based on Fourier transform analysis, we detect spontaneous oscillations in spreading cells. However, their amplitude and tendency to operate at a single frequency are greatly enhanced by microtubule depolymerization. Knockdown of RhoA and addition of various inhibitors of the downstream effector of RhoA, Rho kinase, block oscillatory behavior. Inhibiting calcium fluxes from endoplasmic reticulum stores and from the extracellular medium does not significantly affect the ability of cells to oscillate, indicating that calcium plays a subordinate regulatory role compared to Rho. We characterized the dynamic structure of the oscillating cell by light, fluorescence, and electron microscopy, showing how oscillating cells are dynamically polarized in terms of their overall morphology, f-actin and phosphorylated myosin light chain distribution, and nuclear position and shape. Not only will these studies guide future experiments, they will also provide a framework for the development of refined mathematical models of the oscillatory process.
Introduction
Periodic morphological oscillations in spreading cells were first observed after depolymerization of microtubules (MTs) with colcemid (1). It was shown that actin, myosin, and Rho kinase were needed for oscillations to propagate, and that the oscillation phenotype could be induced in a number of cell types, including fibroblasts, epithelial cells, and lymphoblasts (1–3). Other groups have found that suspended cells undergo morphological oscillations with or without depolymerized MTs, and that when MTs are depolymerized, periodic local ruptures of the actomyosin cortex occur that initiate the oscillations (2). In general, this periodic cell volume displacement provides a window into interactions between the actomyosin and MT systems that occur in rounded cells.
One of the consequences of MT depolymerization is an increase in the concentration of RhoGEF-H1, which raises the level of active RhoA (4). In a previous work, we put forward a working hypothesis that an increment in Rho activity puts the cell in a more contractile state; this state is modulated by periodic influxes of calcium that produce a periodic increase in calmodulin-mediated activation of myosin light chain kinase (1). To complete the mechanism, it was postulated, a negative feedback occurs between increasing contractility and the calcium influx (5). The elements of our hypothesis were investigated by employing both a new coarse-grained systems cell biology approach termed causal mapping (CMAP) (5) and a traditional ordinary differential equation formulation (6) to show that this scheme could, in fact, produce oscillations. A cortical actin gel mechanochemical model of oscillations using similar calcium-based regulatory mechanisms has also been put forward (3).
The oscillatory phenomenon presents an example of the analysis of a complex mechanochemical system at the cellular level that serves as a challenge for both systems cell biology approaches and more conventional modeling efforts. We used an advanced CMAP technology termed hypothesis generation to investigate which of many different pathway architectures are capable of producing cortical oscillations (7). The CMAP modeling effort revealed two competing pathways that create the oscillatory phenotype; one in which calcium plays a leading role, the other in which RhoA is predominantly involved.
We sought to further investigate the structural and biochemical factors underlying the oscillation phenomenon, thereby informing the modeling process. We demonstrate that spontaneous oscillations exist in spreading cells and that the oscillation amplitude and the percentage of cells that oscillate are greatly enhanced by MT depolymerization. Our investigations using fluorescence and electron microscopy revealed that oscillating cells are dynamically polarized in terms of their overall morphology and the distributions of f-actin and active myosin. In addition, we observed dramatic changes in both the position and shape of the nucleus during the oscillation cycle. We were surprised to find that these periodic contractions of the cortex are not regulated by calcium flux: fully suppressing calcium fluxes from endoplasmic reticulum stores and from the extracellular medium did not inhibit oscillations. Knockdown of RhoA and inhibition of the downstream effector of Rho, Rho kinase, did inhibit oscillations, indicating that RhoA plays a dominant role in the regulation of periodic contractions in this context. Also, direct activation of RhoA through alternate pathways was not sufficient to induce oscillations. Our experimental results necessitate a revision of previous mathematical models of this phenomenon in which the regulation of intracellular calcium underlies the oscillatory behavior; to this end, we propose a mechanism for oscillations in which the dominant factor is the spatiotemporal regulation of RhoA activity.
Methods
Results
MT depolymerization enhances oscillations that occur spontaneously in spreading cells
Fig. 1 A shows a representative kymograph taken from Movie S4 in the Supporting Material of a Swiss 3T3 cell after the addition of 10 μM colchicine. The period of this cell oscillation is ∼60 s and is visible in the excursions of the cell periphery of ∼1.5 μm. The inset in Fig. 1 A shows the region of the cell from which the kymograph is taken. The increase in amplitude of the oscillatory signal after a single Chinese hamster ovary (CHO) cell is treated with 10 μM colchicine is shown in Fig. 1 B, which gives the waveforms before (solid line) and after (dotted line) MTs are depolymerized. The power spectra of the waveforms in Fig. 1 C show the concentration of power in a narrow frequency range after treatment with colchicine. About 50% of CHO and Swiss 3T3 spreading cells spontaneously oscillated and met our criteria (see Materials and Methods) for single-frequency oscillations during the observation window of 1–2 h after plating (Fig. 2 A). The amplitude of the oscillation signal (see Materials and Methods) was consistent over multiple cell passages and responded consistently to reagent treatment. We found that the average amplitude of untreated oscillating CHO cells was 0.15 ± 0.04 μm (N = 360) and that of untreated oscillating Swiss 3T3 was 0.18 ± 0.02 μm (N = 277) (Fig. 2 B). Cells with depolymerized MTs oscillated with an average amplitude that was slightly more than twice the amplitude of untreated cells, 0.33 ± 0.03μm for CHO cells (N = 221) and 0.38±0.03 μm for Swiss 3T3 (N = 135). MT depolymerization also significantly increased the percentage of oscillating CHO cells to an average of 80% (N = 221) and that of oscillating Swiss 3T3 cells to 85% (N = 135) (Fig. 2, A and B). The average period value varied within the range 83 ± 12 s (N = 2588) and did not exhibit consistent response patterns to reagent treatment.
Figure 1.
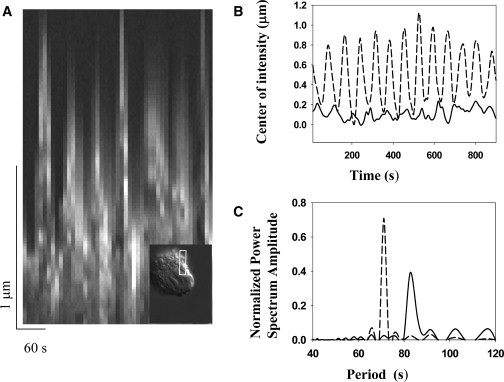
Dynamics of the oscillatory phenotype. (A) Kymograph of a peripheral section (see inset) of a Swiss 3T3 cell undergoing oscillations induced by colchicine and imaged at 60× in DIC. The section used for the kymograph is 2 × 20 pixels wide and is obtained from 46 images taken every 10 s. A supplemental video of this cell is available (Movie S4). (B) The center of phase contrast intensity (see Materials and Methods in the Supporting Material) as a function of time for a single CHO cell before (solid line) and after (dashed line) 15 min of treatment with colchicine. Note the increase in amplitude that occurs after depolymerization of MTs. (C) Corresponding power spectra from the Fourier transform of the waveforms in B shows concentration of power in a narrow range of frequencies after colchicine treatment.
Figure 2.

MT depolymerization enhances oscillations that occur spontaneously in spreading cells. (A) The average percentage of oscillating cells per experiment was measured as described in Materials and Methods (see Supporting Material). Treatment with colchicine (10 μM) or colcemid (1 μM) increases the percentage of oscillating cells. (B) The average amplitude of oscillating cells per experiment was analyzed as described in Materials and Methods and doubles with MT depolymerization.
Cell morphology during oscillations
We imaged cells that had been fixed during oscillations using scanning electron microscopy. A representative image (Fig. 3 A) shows a convoluted surface that indicates a reservoir of folded membrane, an expected property for rounded cells. The image also suggests considerable height in the oscillating cells. To visualize the shape of the cell cortex, oscillating cells were fixed and stained with rhodamine phalloidin for f-actin. Laser scanning confocal microscope images were acquired at multiple image planes along the z axis to permit three-dimensional (3D) actin isosurface reconstructions using Image Surfer software. Fig. 3, B–D, shows several typical examples of cell morphology detected by 3D reconstruction. Fig. 3 gives top (C) and side (D) views of the same cell, which exhibit morphological similarities to the scanning electron microscope image. Many cells have bulges or extensions on one side. The height of the cell during oscillations, sometimes reaching over 20 μm, is remarkable.
Figure 3.

Views of the morphology of oscillating cells. (A) Scanning electron microscope image of an oscillating cell. (B–D) 3D reconstruction and visualization of f-actin isosurface for low threshold values of fluorescence intensity (i = 250 a.u.) using ImageSurfer software. Cells were induced to oscillate, fixed, and stained with rhodamine phalloidin for f-actin. Twelve sections with 1-μm steps along the z axis were imaged using a laser scanning confocal microscope.
Calcium plays a subordinate role in oscillations
We tested our previous hypothesis (1,5) that [Ca2+]i flux drives cell oscillations either via stretch-activated calcium channel entry from the extracellular medium or through endoplasmic-reticulum (ER)-mediated calcium uptake. We found, through the use of various inhibitors and by intracellular free calcium imaging, that calcium flux is not required for the propagation of cortical oscillations. Depriving cells of extracellular calcium (N = 74) (Fig. 4, A and B), or adding the ER ATPase inhibitor thapsigargin (N = 306; data not shown) did not halt oscillations, indicating that neither extracellular nor intracellular sources of calcium flux were involved in regulating oscillations. The percentage of Swiss 3T3 cells that continue to oscillate in the presence of the ER SERCA pump blocker thapsigargin did not change appreciably either with (N = 100) or without (N = 206) MT depolymerization. To examine how media containing no extracellular calcium affect cell oscillations, cells were plated in serum-free medium containing calcium and observed in phase contrast. The medium was then removed and cells were washed and incubated with serum-free medium containing no calcium. We observed that Swiss 3T3 cells with and without colchicine continue oscillating in the absence of extracellular calcium. However, cells treated with colchicine (which causes MT depolymerization) in serum-free medium did not remain sufficiently attached during the change of medium to quantify oscillations with our technique; therefore, we added 5 mM of the calcium chelator EGTA to colchicine-treated cells plated in serum-containing medium (Fig. 4, C and D). We found that all of these cells (N = 37) continue oscillating after extracellular calcium chelation (medium contains 2 mM calcium).
Figure 4.

Removal of extracellular calcium or addition of the calcium chelator EGTA does not affect the ability of a cell to oscillate. (A and C) Phase-contrast-derived center of intensity signals of a spontaneously oscillating Swiss 3T3 cell before and after removal of calcium (A), as described in text, and of a cell induced to oscillate by colchicine before and after addition of EGTA (C). (B and D) Power spectra of the cells in A and C, respectively, before (solid line) and after (dashed line) removal of calcium (B) and addition of EGTA (D).
We also performed intracellular calcium ratiometric imaging using Fura-2. We detected no discernible and reproducible spatiotemporal gradients that correlated with the pronounced morphological oscillations (data not shown), consistent with the thesis that changes in [Ca2+]i due to fluxes from the extracellular medium and from ER stores do not play a dominant role in regulating cortical oscillations in spreading cells.
RhoA activation
MT depolymerization, known to activate RhoA by releasing RhoGEF-H1 (4), increases the amplitude of oscillations and the percentage of oscillating cells (Figs. 1 and 2). Thus, we asked whether MT depolymerization induces oscillations primarily through activation of RhoA. Inhibiting RhoA with the siRNA to human RhoA significantly decreases the percentage of cells induced to oscillate by colchicine (Table 1 B) versus the siRNA control. The percentage of cells oscillating with the scrambled human siRNA control (Table 1 B) was similar to the percentage of cells oscillating with electroporation alone (65% (N = 51)), demonstrating that the effect of RhoA siRNA on oscillations is RhoA-specific. Further, inhibition of the downstream effector of Rho, Rho kinase (ROCK), by three different inhibitors in cells treated with colchicine immediately halts oscillations. It was previously shown (1,2) that both HA-1077 and Y-27632 caused immediate cessation of colcemid-induced oscillating cells. Using the analysis described in Materials and Methods, we quantified the previously published Y-27632 results and also employed the more specific ROCK inhibitor H-1152 (8). Both of these inhibitors caused immediate cessation of oscillations (Table 1 B).
Table 1.
RhoA activation is necessary but not sufficient to induce oscillations
| (A) Effects of RhoA activation on untreated cells | |||
|---|---|---|---|
| Treatment | % Oscillating∗ | % Increase compared to control† | N |
| None | 46 ± 9 | — | 637 |
| Colcemid/colchicine (MT depolymerization) | 82 ± 9 | 78 | 356 |
| LPA | 53 ± 20 | 15 | 280 |
| Thrombin | 46 ± 10 | 0 | 62 |
| (B) Effects of RhoA inhibition on cells with depolymerized MTs | |||
| Treatment | % Oscillating∗ | % Decrease compared to control† | N |
| Colcemid/colchicine | 82 ± 9 | — | 356 |
| Scrambled siRNA | 64 ± 1 | 22 | 47 |
| RhoA siRNA | 17 ± 4 | 73‡ | 43 |
| Y-27632 (ROCK inhibitor) | 3 ± 1 | 96 | 67 |
| H-1152 (ROCK inhibitor) | 1 ± 0 | 99 | 62 |
Meets established criteria for oscillations as described in Methods.
.
Compared to effects in cells treated with scrambled siRNA and colchicine.
Global activation of RhoA though pathways other than MT depolymerization (LPA at commonly used concentrations (1 μg/mL (N = 47), 4 μg/mL (N = 41), and 8 μg/mL (N = 192)), or treatment with 1 U/mL thrombin (N = 90), Table 1 A) does not cause signficant increases in the amplitude or the percentage of Swiss 3T3 and CHO cells that oscillate. These data demonstrate that the RhoA pathway is needed for the regulation of cortical oscillations, but that in contrast to MT depolymerization, global activation of alternate RhoA activating pathways does not enhance the ability of a cell to oscillate.
Downstream of RhoA, myosin light chain (MLC) phosphatase is inhibited by ROCK but can also be inhibited by the addition of the calyculin reagent, thereby increasing global MLC phosphorylation. A moderate concentration of calyculin (25 nM) decreases the percentage of oscillating Swiss 3T3 cells by an average of 51% (N = 69) (the amplitude remained unchanged; data not shown), indicating that a global increase in contractility reduces the fraction of cells competent to oscillate. These results suggest that it is the spatiotemporal regulation of RhoA activity and its downstream effectors, as opposed to simply globally elevating these levels, that produces cell oscillations.
Dynamic cell structure during oscillations
Active RhoA increases both MLC phosphorylation and actin polymerization (9–12). To better understand the regulation of oscillations, which are ultimately powered by actomyosin dynamics, we investigated the spatiotemporal dynamics of actin and myosin during oscillations. Consistent with previous observations (1,2), we found that latrunculin, which blocks actin polymerization, and blebbistatin, which inhibits myosin contractility, both abrogate the oscillatory phenotype in colcemid-treated cells (data not shown). Below, we describe our studies of cortical polarization during oscillations.
F-actin is highly polarized during cell oscillations
Having established some features of the oscillating cell's cytoplasmic volume redistribution, it becomes important to ask how this redistribution is related to the contractile actomyosin cortex that presumably drives oscillations. We examined the actin cortex in a population of cells that underwent morphological oscillations induced by colchicine. Fig. 5 A shows the phase contrast image of 155 cells, out of which 145 (93.5%) were oscillating. The oscillating cells were fixed on the stage with 4% formaldehyde and stained with AlexaFluor-594-phalloidin to visualize actin filaments. Fig. 5, B and C, shows that many of the cells have a highly asymmetrical distribution of actin filaments. Because cells were fixed in different phases of the oscillatory cycle, the correlation between the orientation of oscillatory movement and the polarization of actin within a cell could not be investigated. The same cells were later transferred to the Olympus FV1000 laser scanning confocal microscope, where a series of images were taken at 1-μm steps along the z axis for several different cells. This series allowed us to reconstruct the f-actin distribution in three dimensions using ImageSurfer software (Fig. 5, D–F).
Figure 5.

F-actin polarization in oscillating cells. (A) Phase contrast image (20×) of cells undergoing morphological oscillations induced by colchicine. (B) Cells were fixed on the stage and stained with AlexaFluor-594-phalloidin to visualize actin filaments. The image shows that many of the oscillating cells have a highly asymmetrical distribution of actin filaments. (C) A magnified image of the outlined area in B (dotted line). (D–F) 3D reconstruction of the f-actin distribution for one representative cell. Fluorescence images were taken on an Olympus FluoView1000 laser scanning confocal microscope using a 60× objective. Images along the z axis were taken at 1-μm steps (20 images total) and a 3D reconstruction was accomplished using ImageSurfer software. (D) Side view, isosurface reconstruction, of a low fluorescence intensity theshold (i = 250 a.u.). (E and F) 3D isosurface visualization of a high fluorescence intensity threshold (i = 1000 a.u.), with side (E) and top (F) views of the same cell, in which the actin filament concentration is highly uneven around the cell cortex. (G) Line profiles of the fluorescence intensity along the indicated line drawn on unthresholded images of different z planes of a cell at one time point in the oscillatory cycle.
We assume that the value of AlexaFluor-594-phalloidin fluorescence intensity is a reliable indicator of the concentration of f-actin. The reconstruction with a lower threshold value of fluorescence intensity (Fig. 5 D) visualizes the entire actin cortex and shows an asymmetrical shape with an extension on one side of the cell. The overall height of the cell is ∼18 μm. Three-dimensional visualization employing a higher fluorescence intensity threshold (Fig. 5, E and F) demonstrates that the actin filament concentration is unevenly distributed around the cell cortex: areas of low filament concentration appear as missing parts of the cortex. To quantify this cortical asymmetry, we used line profiles of unthresholded images at different z planes of a fixed cell (Fig. 5 H).
Nuclear movement during cell oscillations appears to be driven by a contractile actomyosin cortex
The marked redistribution of the actin-rich cortex during cell oscillations is accompanied by dramatic nuclear translocation, as seen in Fig. 6. Fig. 6 A shows at low magnification the opposed nature of the preponderance of cortical actin (red) and the nucleus (green). This is more clearly appreciated in Fig. 6 B, in which 3D reconstructions from confocal stacks show that cortical actin (red) is generally concentrated on the side of the cell opposite the nucleus. Fig. 6 C shows nuclei stained with 4′,6-diaminidino-2-phenylindole (DAPI), and Fig. 6 D, along with Movie S5, show this stain superimposed on differential interference contrast (DIC) images of the same cells. DAPI-stained nuclei move during oscillations (Fig. 6 E). This movement can be tracked along the x and y axes (Fig. 6, F and G), and the Fourier power spectrum shows that this oscillatory motion has a period similar to that found through whole-cell analysis (Fig. 6 H).
Figure 6.
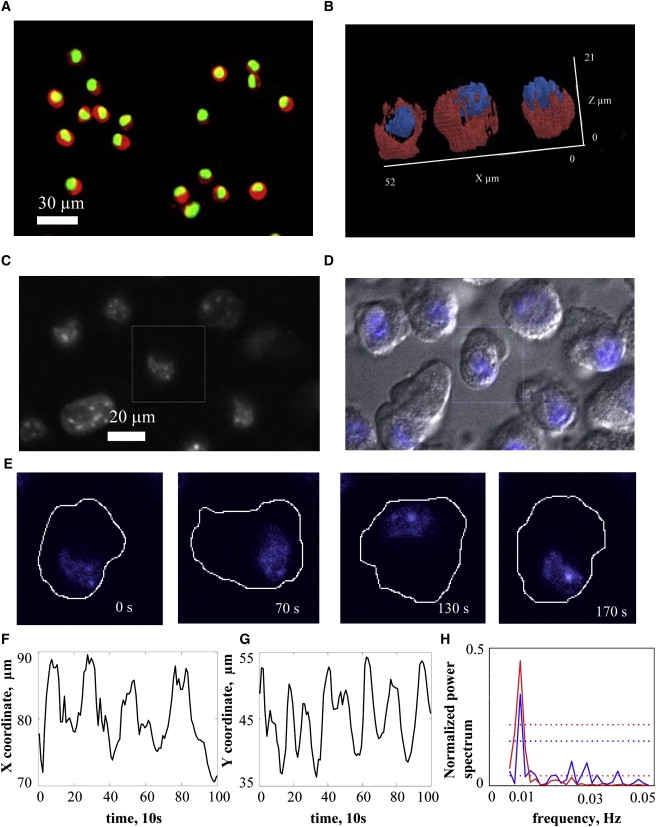
Nuclear dynamics in oscillating cells. (A) Oscillating cells were fixed and stained with AlexaFluor594-phalloidin (red) labeling actin and DAPI (green) labeling the nucleus. Cells were imaged using fluorescence microscopy. (B) 3D reconstruction of both cortical structure (red) and nucleus (blue) in fixed cells. A high fluorescence intensity threshold was used (isovalue i = 2500 a.u.) to visualize regions of high actin-filament concentration. The position of the nucleus in most fixed cells was shifted toward a region of the cell with low filament concentration and located in the upper region of the cell. (C) Fluorescence image of live cells with the nucleus stained with Hoechst 33342. (D) Image of oscillating cells in DIC with nuclear fluorescence image superimposed (Movie S5). (E) Time sequence of the nuclear position during oscillations for the single cell outlined by a square in C. (F and G) Position of the center of intensity of nuclear stain distribution in the x (F) and y (G) directions. (H) Fourier power spectrum for nuclear motion along the x and y axes.
In our observation of fixed cells, the nucleus is often polarized at one end of the cell (Fig. 7). A confocal section of this cell shows an asymmetric distribution of actin (Fig. 7 A) and of active myosin II (Fig. 7 B). The colocalization of f-actin and active myosin II in the outer ring is quantified in Fig. 7, D and E. The extremely deformed nucleus in the same cell, stained with DAPI (Fig. 7 C), is found at one side of the cell, suggesting that it was driven there by intense cortical contractile activity at the opposite side of the cell. A 3D reconstruction employing a high fluorescence intensity threshold for actin, phosphorylated MLC, and the nucleus, shows that the nucleus is seemingly pushed toward one side of the cell, whereas the heaviest f-actin and active myosin concentration is concentrated at the other side of the cell (Fig. 7, F and G).
Figure 7.

Concentrations of actin filaments and active myosin are highly correlated. (A–C) Fluorescence images of actin (A) (bar = 10 μm), phosphorylated MLC (B), and the nucleus (C). In this reconstruction, a high fluorescence intensity (isovalue i = 2500 a.u.) was used. Shown are top-view images of the middle of an oscillating cell, which demonstrate the asymmetrical distribution of actin and phosphorylated MLC along with the severely deformed and displaced nucleus. (E) Plot of normalized fluorescence intensity of actin filaments (red) and phosphorylated MLC (green) along the cell perimeter (D) as a function of point number. (F–G) 3D reconstructions of actin (red), phosphorylated MLC (green), and the nucleus (blue) (see Movie S6).
In summary, these studies illustrate the dynamics of the actin-myosin cortex during cell oscillations. The actomyosin cortex at the site of the cytoplasmic bulge is reformed in some manner and thickens as it matures during oscillations. The localized concentration of f-actin and active MLC appears to drive the major cytoplasmic volume redistribution containing the nucleus to a distal site in the cell from which the process begins anew.
Discussion
In a previous study, we described the morphological oscillations of spreading cells whose MTs had been depolymerized (1) and built computational models able to produce oscillations (5,6). Our further coarse-grained modeling revealed two competing pathways in which either calcium or RhoA could play a dominant role in producing oscillations (7). In this study, we performed a biochemical investigation to distinguish between these pathways and to begin to characterize the regulatory system that underlies the oscillatory behavior. We demonstrate that calcium fluxes from endoplasmic reticulum stores and from the extracellular medium do not significantly affect the ability of cells to oscillate. We find that RhoA activation is necessary but that, other than through MT depolymerization, global activation of either RhoA or MLC does not induce oscillations. We also characterize the dynamic structure of the oscillating cells, showing that these cells are dynamically polarized in terms of their morphology, f-actin, and phosphorylated MLC. Concomitantly, the nucleus is moved throughout the cell and, in the process, undergoes major deformations. We propose that the dynamic cortex observed during oscillations is due to spatiotemporal regulation of RhoA.
Previous work
It is important and interesting to compare and contrast our expanded study of cell oscillations with previous work mainly on suspended cells. Paluch et al. (2) investigated suspended fibroblasts and lymphoblasts whose MTs had been depolymerized. In contrast to this study, in those cells, oscillations appeared to be driven by breaks in the actomyosin cortex that allowed the remainder of the contractile cortex to push cytoplasm toward the ruptured region, thus forming a large bleblike structure. Similar to our findings (in this and a previous article (1)), oscillations were dependent on the actomyosin cytoskeleton and ROCK activity. Salbreux et al. (3) studied shape oscillations in suspended mouse fibroblasts without MT depolymerization. Inhibitor/activator studies showed that these oscillations are also dependent on a contractile actomyosin cytoskeleton with ROCK involvement. However, their work showed that suspended cell oscillations are dependent on calcium, in contrast to the studies reported here on attached cells. These similarities suggest that in addition to elucidating the structure and mechanochemistry of the cortex, coupling the cell mechanics to the regulatory biochemistry will be important in achieving a detailed understanding of the oscillations in various contexts.
The idea that calcium flux could regulate cortical oscillations came from known examples in which changes in intracellular calcium drive periodic contractility: skeletal muscle, cardiomyocytes, and frustrated phagocytosis in macrophages (13–15). In smooth muscle cells, calcium is known to be the predominant regulator, with Rho GTPases playing a secondary role in the regulation of contractility (16). Further, in migrating neutrophils, tail retraction, which must occur regularly, has been shown to be calcium-dependent (17). In keratocytes this calcium-mediated contraction was found to be due to an influx through stretch-activated calcium channels (SACs) (18). We therefore proposed (1,5,6) that calcium influx from SACs could be responsible for propagating cortical oscillations in spreading cells. In this view, the negative feedback needed for oscillations comes from increased myosin activity due to local calcium influx that induces a contraction of the actomyosin cortex, thereby closing the SAC channels in that region of the membrane.
We tested this hypothesis by deliberately manipulating calcium. The results from these experiments indicate that our previous hypothesis is not correct: the oscillatory phenotype persists in the absence of extracellular calcium and when SERCA pumps are blocked, demonstrating that fluxes of calcium are not a central player in the oscillatory process. In fact, it was recently discovered that lateral oscillations in keratocytes are also independent of calcium flux (19). Our previous [Ca2+]i imaging results (1) were based on a single-channel probe, fluo-4, in confocal sections. In light of the substantial periodic excursions of the nucleus and the fact that the nucleus preferentially takes up fluo-4 (20), the movements of the nucleus in and out of the confocal section were most likely mistakenly interpreted as a periodic variation in [Ca2+]i.
Rho
Since [Ca2+]i does not appear to govern oscillatory behavior, the other known regulator of MLC-phosphorylation, RhoA, is likely to play a significant role in cell oscillations. Rho has a multifaceted role in regulating motile phenomena. Recent biosensor studies show that RhoA activity displays a complex spatiotemporal pattern of regulation in migrating cells (11,21,22). Schwartz et al. investigated the time course of Rho activity during cell spreading and found that in fibroblasts spreading on fibronectin, RhoA activity decreased until ∼20 min after spreading, and then increased to above the levels found in suspended cells (23).
RhoA activates Rho kinase (ROCK), which directly phosphorylates MLC and myosin phosphatase (24,25). ROCK phosphorylation of myosin phosphatase inhibits this enzyme. Therefore, both effects promote a higher level of phosphorylated MLC to increase contractility. Indeed, the dual phosphorylation capacity of ROCK on MLC is thought to provide a stronger stimulus to contractility than the calcium-pathway-mediated MLC kinase (26,27). In addition, Rho stimulates reformation of the cortex by activating mDia1 (28), which promotes actin polymerization. We found that RhoA and ROCK were both essential to the propagation of oscillations, but that global activation of RhoA alone did not induce oscillations. Further, we found that directly inhibiting MLC phosphatase, which increases global MLC phosphorylation, decreased the percentage of oscillating cells. These results support a model in which spatiotemporal regulation of RhoA in turn provides spatiotemporal regulation of cortical contractility and reconstruction that drives cytoplasmic flows in oscillating cells.
How might Rho regulate oscillatory behavior?
Fig. 8 depicts a possible mechanism for how the spatiotemporal regulation of RhoA could drive morphological oscillations. On one side of the cell, internal pressure transmitted via the shift in cell volume (consisting of the cytoplasm and nucleus shown together in light blue) results in thinning of the cell cortex; this is depicted in Step 1 as a thinner dark blue line (the cortex) on side A in the top part of Fig. 8. We postulate that thinning leads to an increase in active Rho, which in turn leads to rebuilding of the thinned cortex (via Rho-activated formins, such as mDia1) and an increase in cortical contractility through MLC phosphorylation. After some time delay (which will depend on the chemical kinetics of the reactions involved and/or the fluid dynamics of the moving cytosol/cortex and nucleus (29)), this contractile cortex pushes the cytoplasm and nucleus to another region of the cell (Fig. 8 Step 2, side B), thinning the cortex in that region and initiating another oscillation cycle. This working hypothesis is supported by our imaging data, which show differential localization of the contractile cortex during the oscillatory cycle (Fig. 7). Moreover, given that RhoA is known to modulate both cortical network formation and contractility, an examination of RhoA with a biosensor capable of capturing spatiotemporal changes in its activity is imperative, and we have begun this investigation in oscillating cells.
Figure 8.
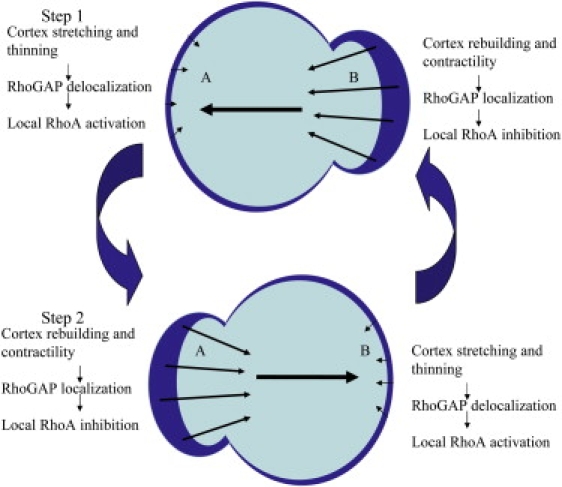
Proposed scheme for the spatial regulation of RhoA and subsequent cortex regulation. See text for discussion.
How might RhoA be differentially regulated by cortical structure?
One possible scenario follows. In suspended cells and in cells lacking an intact actin cytoskeleton, p190RhoGAP, which converts RhoA back to its inactive form, appears to be neither active nor membrane-localized (30). Rather, this GAP is bound by cytoplasmic filamin. By contrast, in spread cells with an intact cortex, filamin is cleaved by cortex-localized calpain and p190RhoGAP becomes localized to the membrane, where it is phosphorylated and becomes active. It is plausible that the main regulator of oscillations is a RhoGAP, which is shuttled between the membrane, where it locally inhibits RhoA activation, and the cytoplasm, where it is bound by filamin, thereby resulting in enhanced RhoA activation at the membrane.
This work raises a number of interesting questions. For example, why does MT depolymerization cause the percentage of oscillating cells and the oscillation amplitude to increase? A number of factors may be at play. It is known that removing intact MTs results in a more deformable cell body, a necessary component of these oscillations (31,32). MT depolymerization could also produce nonuniform activation of RhoA, in the process breaking a symmetry and setting up conditions for oscillations. Another possibility is that an overshoot in RhoA activation in one part of the cell induces excess contractility that assists in breaking the actin network in preparation for the next expansion in that area. In the case of oscillations in cells in which MTs have not been depolymerized, it is possible that cells respond to contractile force by some degree of MT buckling, as has been predicted (33). In addition to activating myosin-based contractility, RhoA activation also regulates actin polymerization via formins. The question arises whether de novo synthesis of the actin network occurs on a timescale compatible with the oscillation period. Also, because Rho family proteins often influence one another, it is likely that other family members are involved, but their role remains to be elucidated. More generally, it will be important to ask how the actin rearrangements observed in morphological oscillations are related to those found in cell division and/or cell migration. Finally, do the extreme nuclear displacements and deformations confer features of the oscillatory phenotype in addition to those observed in enucleated suspension cells (2)?
It is clear that both coarse-grained and fine-grained models of complex cellular phenomena must be informed by experiment. Indeed, this study provides a case in point. Whereas incomplete experimentation previously led to both ODE and CMAP models that could account for the oscillatory phenotype, they were based on a key role for intracellular calcium regulating MLC kinase and thus contractility. By contrast, our current, more detailed experiments have led us to conclude that calcium-mediated contractility plays a role subordinate to that of Rho-induced contractility. Therefore, this work provides a concrete experimental basis to appropriately modify our previous coarse- and fine-grained models.
Acknowledgments
The authors thank Jim Bear and Keith Burridge for valuable discussion and the use of reagents.
This work was carried out with financial support from the National Institutes of Health (GM078994), the Johns Hopkins Engineering in Oncology Center NCI U54CA 143068, National Institutes of Health Cell Migration Consortium (U54 GM064346), and the American Heart Association (09PRE2220021) to N.C.
Supporting Material
References
- 1.Pletjushkina O.J., Rajfur Z., Jacobson K.A. Induction of cortical oscillations in spreading cells by depolymerization of microtubules. Cell Motil. Cytoskeleton. 2001;48:235–244. doi: 10.1002/cm.1012. [DOI] [PubMed] [Google Scholar]
- 2.Paluch E., Piel M., Sykes C. Cortical actomyosin breakage triggers shape oscillations in cells and cell fragments. Biophys. J. 2005;89:724–733. doi: 10.1529/biophysj.105.060590. [DOI] [PMC free article] [PubMed] [Google Scholar]
- 3.Salbreux G., Joanny J.F., Pullarkat P. Shape oscillations of non-adhering fibroblast cells. Phys. Biol. 2007;4:268–284. doi: 10.1088/1478-3975/4/4/004. [DOI] [PubMed] [Google Scholar]
- 4.Liu B.P., Chrzanowska-Wodnicka M., Burridge K. Microtubule depolymerization induces stress fibers, focal adhesions, and DNA synthesis via the GTP-binding protein Rho. Cell Adhes. Commun. 1998;5:249–255. doi: 10.3109/15419069809040295. [DOI] [PubMed] [Google Scholar]
- 5.Weinreb G.E., Elston T.C., Jacobson K. Causal mapping as a tool to mechanistically interpret phenomena in cell motility: application to cortical oscillations in spreading cells. Cell Motil. Cytoskeleton. 2006;63:523–532. doi: 10.1002/cm.20143. [DOI] [PubMed] [Google Scholar]
- 6.Kapustina M., Weinreb G.E., Elston T.C. Mechanical and biochemical modeling of cortical oscillations in spreading cells. Biophys. J. 2008;94:4605–4620. doi: 10.1529/biophysj.107.121335. [DOI] [PMC free article] [PubMed] [Google Scholar]
- 7.Weinreb G.E., Kapustina M.T., Elston T.C. In silico generation of alternative hypotheses using causal mapping (CMAP) PLoS ONE. 2009;4:e5378. doi: 10.1371/journal.pone.0005378. [DOI] [PMC free article] [PubMed] [Google Scholar]
- 8.Ikenoya M., Hidaka H., Sasaki Y. Inhibition of rho-kinase-induced myristoylated alanine-rich C kinase substrate (MARCKS) phosphorylation in human neuronal cells by H-1152, a novel and specific Rho-kinase inhibitor. J. Neurochem. 2002;81:9–16. doi: 10.1046/j.1471-4159.2002.00801.x. [DOI] [PubMed] [Google Scholar]
- 9.Arthur W.T., Burridge K. RhoA inactivation by p190RhoGAP regulates cell spreading and migration by promoting membrane protrusion and polarity. Mol. Biol. Cell. 2001;12:2711–2720. doi: 10.1091/mbc.12.9.2711. [DOI] [PMC free article] [PubMed] [Google Scholar]
- 10.Burridge K., Wennerberg K. Rho and Rac take center stage. Cell. 2004;116:167–179. doi: 10.1016/s0092-8674(04)00003-0. [DOI] [PubMed] [Google Scholar]
- 11.Machacek M., Hodgson L., Danuser G. Coordination of Rho GTPase activities during cell protrusion. Nature. 2009;461:99–103. doi: 10.1038/nature08242. [DOI] [PMC free article] [PubMed] [Google Scholar]
- 12.Tsuji T., Ishizaki T., Narumiya S. ROCK and mDia1 antagonize in Rho-dependent Rac activation in Swiss 3T3 fibroblasts. J. Cell Biol. 2002;157:819–830. doi: 10.1083/jcb.200112107. [DOI] [PMC free article] [PubMed] [Google Scholar]
- 13.Berchtold M.W., Brinkmeier H., Müntener M. Calcium ion in skeletal muscle: its crucial role for muscle function, plasticity, and disease. Physiol. Rev. 2000;80:1215–1265. doi: 10.1152/physrev.2000.80.3.1215. [DOI] [PubMed] [Google Scholar]
- 14.Katz A.M., Repke D.I. Control of myocardial contraction: the sensitivity of cardiac actomyosin to calcium ion. Science. 1966;152:1242–1243. doi: 10.1126/science.152.3726.1242. [DOI] [PubMed] [Google Scholar]
- 15.Kruskal B.A., Maxfield F.R. Cytosolic free calcium increases before and oscillates during frustrated phagocytosis in macrophages. J. Cell Biol. 1987;105:2685–2693. doi: 10.1083/jcb.105.6.2685. [DOI] [PMC free article] [PubMed] [Google Scholar]
- 16.Somlyo A.P., Somlyo A.V. Ca2+ sensitivity of smooth muscle and nonmuscle myosin II: modulated by G proteins, kinases, and myosin phosphatase. Physiol. Rev. 2003;83:1325–1358. doi: 10.1152/physrev.00023.2003. [DOI] [PubMed] [Google Scholar]
- 17.Marks P.W., Maxfield F.R. Transient increases in cytosolic free calcium appear to be required for the migration of adherent human neutrophils. J. Cell Biol. 1990;110:43–52. doi: 10.1083/jcb.110.1.43. [DOI] [PMC free article] [PubMed] [Google Scholar]
- 18.Lee J., Ishihara A., Jacobson K. Regulation of cell movement is mediated by stretch-activated calcium channels. Nature. 1999;400:382–386. doi: 10.1038/22578. [DOI] [PubMed] [Google Scholar]
- 19.Barnhart E.L., Allen G.M., Theriot J.A. Bipedal locomotion in crawling cells. Biophys. J. 2010;98:933–942. doi: 10.1016/j.bpj.2009.10.058. [DOI] [PMC free article] [PubMed] [Google Scholar]
- 20.Chen Z., Li Z., Ji G. Extracellular ATP-induced nuclear Ca2+ transient is mediated by inositol 1,4,5-trisphosphate receptors in mouse pancreatic β-cells. Biochem. Biophys. Res. Commun. 2009;382:381–384. doi: 10.1016/j.bbrc.2009.03.030. [DOI] [PubMed] [Google Scholar]
- 21.Pertz O., Hahn K.M. Designing biosensors for Rho family proteins—deciphering the dynamics of Rho family GTPase activation in living cells. J. Cell Sci. 2004;117:1313–1318. doi: 10.1242/jcs.01117. [DOI] [PubMed] [Google Scholar]
- 22.Pertz O., Hodgson L., Hahn K.M. Spatiotemporal dynamics of RhoA activity in migrating cells. Nature. 2006;440:1069–1072. doi: 10.1038/nature04665. [DOI] [PubMed] [Google Scholar]
- 23.Ren X.D., Kiosses W.B., Schwartz M.A. Regulation of the small GTP-binding protein Rho by cell adhesion and the cytoskeleton. EMBO J. 1999;18:578–585. doi: 10.1093/emboj/18.3.578. [DOI] [PMC free article] [PubMed] [Google Scholar]
- 24.Amano M., Ito M., Kaibuchi K. Phosphorylation and activation of myosin by Rho-associated kinase (Rho-kinase) J. Biol. Chem. 1996;271:20246–20249. doi: 10.1074/jbc.271.34.20246. [DOI] [PubMed] [Google Scholar]
- 25.Kimura K., Ito M., Kaibuchi K. Regulation of myosin phosphatase by Rho and Rho-associated kinase (Rho-kinase) Science. 1996;273:245–248. doi: 10.1126/science.273.5272.245. [DOI] [PubMed] [Google Scholar]
- 26.Ikebe M. Phosphorylation of a second site for myosin light chain kinase on platelet myosin. Biochemistry. 1989;28:8750–8755. doi: 10.1021/bi00448a011. [DOI] [PubMed] [Google Scholar]
- 27.Ueda K., Murata-Hori M., Hosoya H. Rho-kinase contributes to diphosphorylation of myosin II regulatory light chain in nonmuscle cells. Oncogene. 2002;21:5852–5860. doi: 10.1038/sj.onc.1205747. [DOI] [PubMed] [Google Scholar]
- 28.Watanabe N., Kato T., Narumiya S. Cooperation between mDia1 and ROCK in Rho-induced actin reorganization. Nat. Cell Biol. 1999;1:136–143. doi: 10.1038/11056. [DOI] [PubMed] [Google Scholar]
- 29.Mitchison T.J., Charras G.T., Mahadevan L. Implications of a poroelastic cytoplasm for the dynamics of animal cell shape. Semin. Cell Dev. Biol. 2008;19:215–223. doi: 10.1016/j.semcdb.2008.01.008. [DOI] [PMC free article] [PubMed] [Google Scholar]
- 30.Mammoto A., Huang S., Ingber D.E. Filamin links cell shape and cytoskeletal structure to Rho regulation by controlling accumulation of p190RhoGAP in lipid rafts. J. Cell Sci. 2007;120:456–467. doi: 10.1242/jcs.03353. [DOI] [PubMed] [Google Scholar]
- 31.Wang N., Butler J., Ingber D. Mechanotransduction across the cell surface and through the cytoskeleton. Science. 1993;260:1124–1127. doi: 10.1126/science.7684161. [DOI] [PubMed] [Google Scholar]
- 32.Wang N., Naruse K., Ingber D.E. Mechanical behavior in living cells consistent with the tensegrity model. Proc. Natl. Acad. Sci. USA. 2001;98:7765–7770. doi: 10.1073/pnas.141199598. [DOI] [PMC free article] [PubMed] [Google Scholar]
- 33.Volokh K.Y., Vilnay O., Belsky M. Tensegrity architecture explains linear stiffening and predicts softening of living cells. J. Biomechanics. 2000;33:1543–1549. doi: 10.1016/s0021-9290(00)00157-3. [DOI] [PubMed] [Google Scholar]
Associated Data
This section collects any data citations, data availability statements, or supplementary materials included in this article.