

Abstract
Identification of protein methylation sites typically starts with database searching of MS/MS spectra of proteolytic digest of the target protein by allowing addition of 14 and 28 Da in the selected amino acid residues that can be methylated. Despite the progress in our understanding of lysine and arginine methylation, substrates and functions of protein methylation at other amino acid residues remain unknown. Here we report the analysis of protein methylation for p53, SMC3, iNOS, and MeCP2. We found that a large number of peptides can be modified on the lysine, arginine, histidine, and glutamic acid residues with a mass increase of 14 or 28 Da, consistent with methylation. Surprisingly, a majority of which did not demonstrate a corresponding mass shift when cells were cultured with isotope-labeled methionine, a precursor for the synthesis of S-adenosyl-L-methionine (SAM), which is the most commonly used methyl donor for protein methylation. These results suggest the possibility of either exogenous protein methylation during sample handling and processing for mass spectrometry or the existence of SAM-independent pathways for protein methylation. Our study found a high occurrence of protein methylation from SDS-PAGE isolated endogenous proteins and identified complications for assigning such modifications as in vivo methylation. This study provides a cautionary note for solely relying on mass shift for mass spectrometric identification of protein methylation and highlights the importance of in vivo isotope labeling as a necessary validation method.
There exists the potential for widespread protein methylation, as a large number of methyltransferases and demethylases are coded in the genome of eukaryotic cells.1,2 Eight amino acid residues, including arginine (R), lysine (K), aspartate (D), glutamate (E), histidine (H), asparginine (N), glutamine (Q), and cysteine (C) can be methylated.3 While methylation of K/R has been found in histones and transcriptional factors and is an important mechanism for epigenetic regulation, methylated substrates and their enzymes of other methylated residues remain largely unknown. For example, D-methylation is reported in both eukaryotic and prokaryotic cells, but the number of known substrates is limited;4 a definitive evidence for E-methylation in eukaryotes is missing. Functional characterization of protein methylation at diverse amino acid residues awaits information of substrate proteins and their modification sites.
Mass spectrometry (MS) is the method of choice for the identification of protein post-translational modifications (PTM) including methylation.5–9 A methylated peptide derived from protein enzymatic digests is typically identified by the characteristic multiple 14 Da mass shift (e.g., 14 Da for monomethylation, 28 Da for dimethylation, and 42 Da for trimethylation). The methylation site is then pinpointed from the MS/MS spectrum, typically through database searching, allowing methylation of the target amino acid residues (e.g., K, R, H, D, and E).
Recent advancement in MS, for example, the increased sensitivity of the LTQ mass spectrometer, allows the facile identification of PTM sites. PTMs that are of low stoichiometry have become easier to detect. Here we report the mass spectrometric analysis of protein methylation of four proteins, including the tumor suppressor p53, structure maintenance of chromosome 3 (SMC3), inducible nitric oxide synthase (iNOS), and methyl CpG binding protein 2 (MeCP2). This study identified diverse methylated residues including K, R, H, and E in these proteins. To confirm in vivo protein methylation, we used stable isotope-labeled methionine (Met), a precursor for the synthesis of S-adenosyl-L-methionine (SAM), which is the most commonly used methylation donor, to label the methylated substrate proteins. Surprisingly, most of the K/R/H/E-methylated sites could not be labeled, evidenced by no corresponding mass increase of the modified peptides. The results suggest that either methylation reactions of p53, SMC3, iNOS, and MeCP2 use a novel endogenous pathway that is SAM-independent or occur exogenously. Taken together, our study suggests the high occurrence of protein methylation, provides a cautionary note for solely relying on mass shift for mass spectrometric identification of protein methylation, and highlights the importance of in vivo isotope labeling as a necessary validation method for protein methylation.
EXPERIMENTAL SECTION
Cell Culture, Metabolic Labeling, and Protein Isolation
HeLa cells, HEK293T cells, Flag-HA-p53 expressing stable H1299, and RAW cells were maintained in Dulbecco’s modified Eagle’s medium (DMEM) in 10% FBS. These cells were grown in either CD3-methionine, or 13CH3-methionine (Cambridge Isotope Lab), or 13CD3-methionine (Sigma) (30 mg/L) substituted DMEM for more than six generations.
Cells were generally lysed in lysis buffer (25 mM Tris, pH 7.8, 1 mM EDTA, 150 mM NaCl, and 0.5% NP-40) with sonication. The lysate was centrifuged at 4 °C for 30 min at 100000g. The supernatant was collected and immunoprecipitated using anti-SMC3-antibody (BL5589, Bethyl laboratory), anti-iNOS-antibody (06-573, Upstate), or M2 antibody (Sigma) for Flag-HA-epitope tagged p53. RAW cells were treated with lipopolysaccharide (100 ng/mL, Sigma) and mouse INF-γ (10 unit/mL, Sigma) to activate iNOS. MeCP2 was purified from MeCP2 overexpressed HEK293T cells according to procedures described previously.10
Peptide Analysis with Mass Spectrometry
In-gel digestion was carried out as described before.11 For nano-HPLC/MS/MS analysis, extracted peptides were dissolved in 20 μL of 5% methanol/95% water/0.1% formic acid solution and injected into the Surveyor HPLC system (ThermoFinnigan) using an autosampler. A 100 mm × 75 μm, C18 column (5 μm, 300-Å pore diameter, PicoFrit, New Objective) with mobile phases of A (0.1% formic acid in water) and B (0.1% formic acid in methanol) was used with a gradient of 5–95% of mobile phase B over 15 min followed by 95% B for 5 min at a flow rate of 200 nL/min. Peptides were directly eletrosprayed into the mass spectrometer (Finnigan LTQ, ThermoFinnigan) using a nanospray source. LTQ were operated in the data-dependent mode acquiring fragmentation spectra of the top 20 strongest ions. For vMALDI-LTQ (Finnigan LTQ, ThermoFinnigan) analysis, extracted histone tryptic peptides were dissolved in 50% AcCN solution and DHB was used as a matrix.
MS/MS spectra were searched against a modified NCBI protein reference database using BioWorks database search engine (BioWorksBrowser ver 3.2, Thermo Electron). Mass change is incorporated for methionine according to the isotope and oxidation, and arginine, lysine, histidine, glutamic acid and aspartic acid are allowed for methylation. The missed cleavage site for trypsin digestion was set as three. Candidate methylated peptides were identified with stringent BioWorksBrowser filtering criteria: peptide probability >5 × 10⁻⁵ and Xcorr score >4.0 for 3+ ions and 2.2 for 2+ ions. These candidate identifications were examined manually and compared with nonmethylated peptides that all peaks must be assigned, and all fragment ions containing the methylation sites have the corresponding mass shift from the nonmethylated fragments.
In Vitro E-Methylation of Bovine Serum Albumin (BSA)
BSA was resolved in SDS-PAGE and stained with ProtoBlue Safe staining kit (National Diagnostics) according to the manufacturer’s instruction. Methanol was excluded in the buffer. The gel band containing 0.2 pmol of BSA was sliced into small pieces and destained with 25 mM ammonia bicarbonate solution (methanol/water, 50:50 v/v), followed by washing in an acidic buffer (acetic acid/methanol/water, 10:50:40, v/v/v) three times, with 1 h each time, and in water two times, with 20 min each time. The gel pieces were then dehydrated in 100% acetonitrile and dried in a SpeedVac (ThermoFisher). The dried gels was added, ~150 ng of porcine modified trypsin (Promega) in 50 mM ammonia bicarbonate, and incubated overnight at 37 °C. Tryptic peptides were sequentially extracted from the gel pieces by 50% acetonitrile buffer (acetonitrile/water/trifluoroacetic acid (TFA), 50:45:5, v/v/v) and 75% acetonitrile buffer (acetonitrile/water/TFA, 75:24:1, v/v/v). The extracted peptides were pooled, dried in a SpeedVac, and desalted using a μ-C18 Ziptip (Millipore) prior to HPLC/MS/MS analysis.
Non-Methanol Protocol for Processes of BSA
The same amount of BSA was in-gel digested with the same procedure described above except that methanol used in each buffers was replaced with ethanol as a control sample for non-methanol in-gel digestion.
Methanol-Free Nano-HPLC Mass Spectrometry Analysis
HPLC/MS/MS of the tryptic peptides from BSA were carried out according to a procedure previously described.12 Methanol was excluded as a cosolvent in the HPLC buffers. Briefly, The peptide solution in buffer A (2% acetonitrile/97.9% water/0.1% acetic acid, v/v/v) was manually injected and separated in a capillary HPLC column (50 mm length × 75 μm i.d., 5 μm particle size, 300 Å pore diameter) packed in-house with Luna C18 resins. Peptides were eluted from the column with a 60-min gradient of 5–80% buffer B (90% acetonitrile/9.9% water/0.1% acetic acid, v/v/v) in buffer A. The eluted peptides were electrosprayed directly into the LCQ DECA XP ion trap mass spectrometer. Normalized energy for collision-induced dissociation is 35%. Each MS/MS spectrum was obtained by averaging three microscans with maximum injection time of 110 ms for each microscan. The MS/MS spectra were acquired in a data-dependent mode, such that the masses and fragmentation patterns of the three strongest ions in each MS scan were determined.
RESULTS AND DISCUSSION
Mass Spectrometric Detection of Protein Methylation of Endogenous Proteins
To map protein modification sites, endogenous proteins were immunopurified and resolved in SDS-PAGE. The target proteins were in-gel digested with trypsin, and the peptides were analyzed using nano-HPLC/LTQ mass spectrometry for protein identification and mapping of PTM sites. During routine analysis of PTMs of proteins, we found that many tryptic peptides have mass increase of 14 or 28 Da, which is consistent with mono- or dimethylation. We show here four proteins, in which K, R, E, and H residues were detected by mass spectrometry to be consistent with methylation.
Lysine/Arginine Methylation of SMC3
SMC3 is a component of the human cohesin complex that plays an important role in connecting sister chromatids before mitosis and segregation of the sister chromatid into two daughter cells.13–15 Human cohesin complex was purified from HeLa cells using SMC3 antibody (Figure 1A). HPLC/MS/MS analysis identified six arginine methylation sites and seven lysine methylation sites in the SMC3 protein (Table 1). For example, we detected both the unmodified form of the peptide 986ALDQFVNFSEQK997 (m/z 714.00 with the HPLC retention time of 33.38 min (Figure 1E)) and its modified form (m/z 721.37 with HPLC retention time of 34.06 min (Figure 1F). The major difference of the two spectra is +14 mass shifts that are present in almost all the y ions of the modified peptide (Figure 1F). A comparison of the two MS/MS spectra conclusively localized the modification site to K997 of SMC3.
Figure 1.

SDS-PAGE of purified SMC3 (A), MeCP2 (B), iNOS (C), and p53 (D) proteins from normal medium cultured cells (a) and stable isotope-labeled methionine containing medium cultured cells (b). Protein bands for modification analysis are indicated by arrows. (E) MS/MS spectra of an unmodified peptide, 966ALDQFVNFSEQK997 and (F) its methylated counterpart.
Table 1.
Mono- and Dimethylated Amino Acid Residues Identified in p53, SMC3, MeCP2, and iNOs
| protein | peptide sequence | methylated AA residue |
|---|---|---|
| p53(gi:506435) | 7 DPSVEPPLSQETFS20 | E11/E17 (+14 Da)a |
| 49DIEQWFTEDPGP60 | E51 (+14 Da) | |
| 102TYQGSYGFR110 | R110 (+14 Da) | |
| 111LGFLHSGTAK120 | H115 (+14 Da) | |
| 203VEYLDDR209 | E204/R209 (+14 Da)a | |
| 208DRNTFRHSVVVPYEPPEVGS227 | R209/R213/E221/E224 (+14 Da)a | |
| 293GEPHHELPPGSTK305 | E295 (+14 Da) | |
| 322PLDGEYFTLQIR333 | E326 (+14 Da) | |
| SMC3 (gi:4885399) | 62LALLHEGTGPR72 | R72 (+14 Da) |
| 144INQMATAPDSQR155 | R155 (+14 Da) | |
| 222ALEYTIYNQELNETR236 | R236 (+14 Da) | |
| 239LDELSAK245 | K245 (+14 Da) | |
| 265DKMEDIER272 | R272 (+14 Da) | |
| 311DLQDELAGNSEQR323 | R323 (+14 Da) | |
| 401SLDQAINDK409 | K409 (+14 Da) | |
| 419DLEDTEANKEK429 | K427/K429 (+14 Da)a | |
| 437LDQDLNEVK445 | K445 (+14 Da) | |
| 475EENAEQQALAAK486 | K486 (+14 Da) | |
| 635SMEVSTQLAR644 | K644 (+14 Da) | |
| 986ALDQFVNFSEQK997 | K997(+14 Da) | |
| MeCP2(gi:4826830) | 257AEADPQAIPK266 | E258 (+14 Da) |
| 295SVQETVLPIK304 | E298 (+14 Da) | |
| 436TQPAVATAATAAEK449 | E448 (+14 Da) | |
| 201AATSEGVQVKR211 | K210 (+28 Da) | |
| 116SAGKYDVYLINPQGK130 | K119 (+28 Da) | |
| iNOS (gi:6754872) | 408AVTEINVAVLHSFQK422 | K422 (+14 Da) |
| 1031VLFQVHTGYSR1041 | R1041 (+14 Da) | |
| 1105LIQSPPEPLDLNR1118 | E1110/R 1118 (+14 Da)a |
Either residue was methylated individually, but no dimethylation was ever observed on the same peptide.
Arginine/Lysine/Glutamic Acid Methylation of iNOS
iNOS is an effector protein in the immune system that produces nitric oxide in microphage in response to bacteria infection.16,17 To analyze PTMs of iNOS, we immunoprecipitated iNOS from the cytoplasmic fraction of RAW cells after stimulation with lipopolysaccharide and INF-γ (Figure 1B) and subjected iNOS for trypsin digestion. Analysis of the tryptic peptides identified peptides with a modification on the R, K, and E residues that results in 14 Da mass increases, suggesting methylation (Table 1).
Monomethylation of R1118 in the peptide 1105LIQSPEPLDL-NR*1118 was identified by a comparison of the unmodified form (Figure 2A) with the modified form (Figure 2B). The observation of the 303.3 m/z peak (assigned as y2 + 14 Da) and the 1220.5 m/z peak (assigned as b11) (Figure 2B) conclusively located the modification at R1118. Interestingly, the same peptide was also observed to be methylated at E1110 from the same HPLC/MS/MS run (Figure 2C). E-Methylation has been reported in bacteria and is known to be important for chemotaxis,18–20 but its occurrence in eukaryotes has not been conclusively established. The O-methylation of the D-isoaspartic residue is established to be a protein repair mechanism.21 Mass increase of 14 Da of D/E residues in the PCNA protein has been reported, suggesting O-methylation,22 but D/E-methylation in eukaryotes has not been carefully examined in the past.
Figure 2.

Identification of arginine methylation and glutamate methylation in iNOS. (A) MS/MS spectra of (A) the unmodified peptides 1105-LIQSPEPLDLNR1118, (B) its arginine-methylated counterpart, and (C) its glutamate-methylated counterpart.
To evaluate the extent of D/E-methylation, we reanalyzed our MS/MS data sets from nano-HPLC/MS/MS of more than 50 SDS-PAGE isolated endogenous proteins, which are mainly nuclear proteins involved in DNA damage response, DNA repair, and transcription regulation. Database search and subsequent manual verification found that many peptides were modified at E, K, and R, resulting in 14 or 28 Da mass increases in their corresponding peptides and fragment ions. Fifty-three unique methylated peptides were observed from our MS/MS data set (Supporting Information (SI) Table S-1). Our observation suggests that protein methylation may be more widespread than previously appreciated.
Protein Methylation in Overexpressed Proteins
Purification of ectopically overexpressed proteins has now become a common method for identification of protein complex as well as protein PTMs. In the following experiments, we isolated two overexpressed transcriptional factors, human p53 and MeCP2, and analyzed their methylation patterns.
Protein Methylation of p53
The tumor suppressor protein p53 modulates cell cycle arrest, senescence, and apoptosis. Diverse PTMs of p53 were identified previously, including phosphorylation, methylation, acetylation, ubiquitination, and sumoylation.23 R/K-methylation of p53 led to transcription repression by recruiting methylation-dependent corepressor protein complexes containing Sin3A, Brahma, and histone deacetylases to p53 target genes.24,25 Two lysine methylation sites (K370 and K372) of p53 were identified,26,27 in which the Set9-mediated methylation of K372 inhibits Smyd2-mediated methylation of K370, providing regulatory cross talk between protein methylation.28
Our analysis of tryptic peptides from the purified p53 (Figure 1C) identified H115 as monomethylated, based on 14 Da increase on the b5 ion (m/z 582.3) and y6 ion (m/z 614.3) (Figure 3B). Interestingly, methylation of H73 of actin is the only example reported up to date for histidine methylation.29,30 We also found 12 other methyation sites, including 4 methylated R and 8 methylated E (Table 1). However, we did not detect two previously reported methylated lysines (K370 and K372),31,32 most likely because the tryptic peptide containing these two lysines is too short to be detected by the mass spectrometer (R/AHSSHLK370/SK372). Among the 12 R and E methylation sites identified, 3 R (R110, R209, R214) and 4 E (E11, E224, E295, E326) are reported to be mutated in various cases of cancer.33,34 If methylation of these residues turns out to be a regulatory mechanism for p53 function, our finding suggests that protein methylation will have a profound impact on p53 related cancer.
Figure 3.
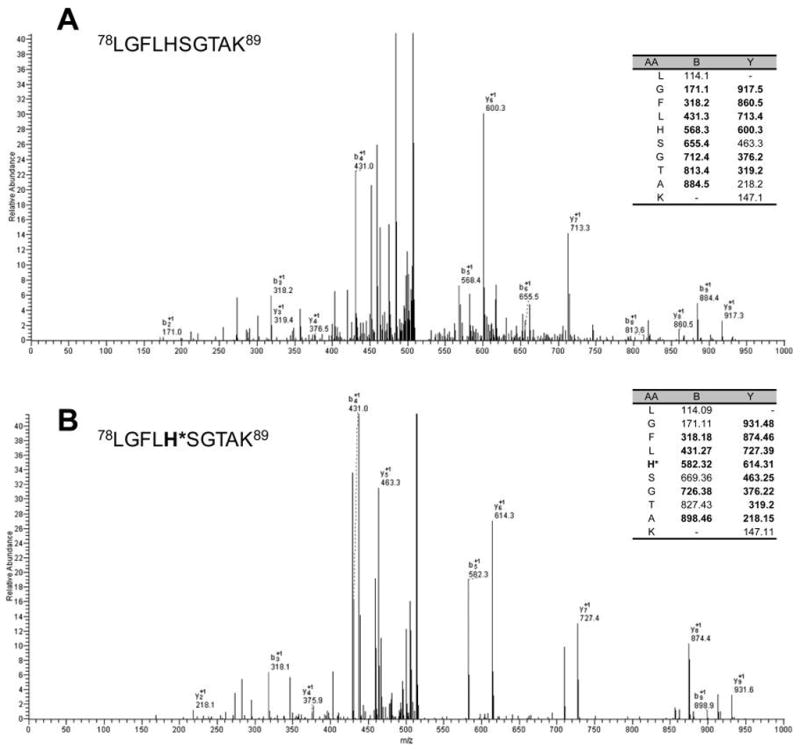
Identification of histidine methylation in p53. MS/MS spectra of (A) the unmodified peptide 111LGFLHSGTAK120 and (B) its histidine-methylated counterpart.
Protein methylation of MeCP2
MeCP2 is a member of the methyl-DNA-binding protein family, which binds DNA containing methylated CpG dinucleotides35 and acts as a methylation dependent transcription repressor by recruiting transcriptional corepressor protein complexes. Mutations in the MeCP2 gene are found in the majority of patients with Rett Syndrome, a severely disabling X-linked progressive neurological disorder and a leading cause of mental retardation in females.36 It has been reported that MeCP2 is post-translationally modified and such modifications are important for MeCP2 function. For example, MeCP2 is phosphorylated in a neuronal activity-dependent manner and such phosphorylation is required for depression of BDNF transcription.37 HPLC/MS/MS analysis of the overexpressed MeCp2 (Figure 1D) revealed three methylated E residues (E 258, 298, 448) as well as two methylated K residues (K210, K119) (Table 1). K210 is identified as a mutation site in several cases of Rett syndrome, indicating that the inability to methylate K210 may be a cause for the Rett syndrome.
In Vivo Labeling of Proteins with Stable Isotope-Labeled Methionine
To confirm in vivo protein methylation, we carried out stable isotope labeling experiment using heavy isotope-labeled Met in tissue cultured cells.38–40 Methyltransferases use SAM as a methyl donor for protein methylation, and in eukaryotic cells, SAM is produced from Met. When cells are cultivated with isotope-labeled Met, in which the side chain of Met is labeled with the S-13CH3 group, the 13CH3 group is incorporated into SAM and subsequently transferred to the methylated substrate proteins. Thus, incorporation of isotopic 13CH3 into methylated residues provides the definitive evidence for in vivo protein methylation.
We cultured HeLa and HEK 293T cells with regular Met (mainly 12CH3), 13CH3-Met, or CD3-Met supplemented media. Complete metabolic labeling was confirmed by mass spectrometry analysis (SI, Figure S-1). To test the biological availability of isotope-labeled Met, we examined methylation of histone H3 at K79, a well-established monomethylated substrate protein.41 The core histones were isolated by acid extraction accordingly to a procedure described previously42 and resolved in SDS-PAGE. K79 methylation of H3 from the labeled cells was confirmed by nano-HPLC/MS/MS of the H3 tryptic peptide with a mass shift of 15 and 17 Da from cells cultured with 13CH3- and CD3-Met, respectively. Such 15 and 17 Da increase in mass corresponds to the addition of 13CH3 and CD3 on K79 of histone H3 (SI, Figure S-2). In addition, we found methylation of H73 in actin that results in 17 Da mass increases in cells that were dosed with CD3-Met (SI, Figure S-3) These results confirmed that in vivo methylated proteins are isotopically labeled under our experimental conditions.
Next, we tried to confirm in vivo methylation of SMC3, iNOS, and MeCP2. Cells were labeled with either 13CH3-Met or CD3-Met. Surprisingly, we did not detect labeled peptides with mass increase of 15 and 17 Da, or 30 and 34 Da (corresponding to dimethylated peptides); instead, we detected modified peptides with 14 Da or 28 Da mass increase from endogenous SMC3, iNOS, and MeCP2 (Figure 4, and Figures S-4–S6, SI), indicating that these modified peptides were not derived from SAM that is synthesized from the labeled Met. For example, in the 13CH3-Met-labeled MeCP2 proteins, a 14 Da, but not a 15 Da shift in K450 was observed for the m/z 673.2 peptide 435TQPAVATAATAAEK*450. The 14 Da increase on K450 was evidenced from the 290.3 m/z peak (y2 + 14 Da) and then1183.3 m/z peak (unmodified b13) (Figure 4A, B). Similarly, we found 14 Da increase rather than 15 Da increase on Arg 236 in the SMC3 peptide of 222ALEYTIYN-QELNETR*236 derived from CD3-Met-labeled HeLa cells (SI, Figure S-4). Likewise, we observed 14 Da increase in two peptides of overexpressed human iNOS protein from the 13CD3-Met-labeled RAW cell. E1108 was found to have a mass shift of 14 Da in the peptide of 1105LNEE*QVEDYFFQLK1118; H708 was found to have a mass shift of 14 Da in the peptide of 696LYTSNVTWDPH*HYR711 (SI, Figures S-5 and S-6). The finding that H708 does not exhibit the corresponding isotope mass shift is surprising as histidine in actin was observed to do so.
Figure 4.

Unsuccessful labeling of a MeCP2 peptide with 13CH3-Met. Overexpressed human MeCP2 protein was purified from 13CH3-Met-labeled 293T cells. (A) The MS/MS spectrum of the nonmodified MeCP2 peptide 435TQPAVATAATAAEK450. (B) The MS/MS spectrum of the methylated peptides, showing 14 Da increase in y2–y6 and y8–y11 ions. The results indicate that K450 is methylated but not labeled by 13CH3-Met, which would give a mass increase of 15 Da.
Isotope-labeled SAM was used as a donor for methylation reaction, as we did observe a tryptic peptide, 156VGDTSLDPND-FDFTVTGR175, from the overexpressed MeCP2 that shows a 15 Da mass increases in R175, demonstrating monomethylation of R175 (Figure 5). Therefore, SAM is used as a methyl donor and MECP2 is methylated under our experimental conditions. The sequence flanking 174GRG176 conforms to the methylation consensus of the two major protein arginine methyltransferase, PRMT1 (type I) and PRMT5 (type II), which preferentially methylates arginines in the RG-rich clusters.43
Figure 5.
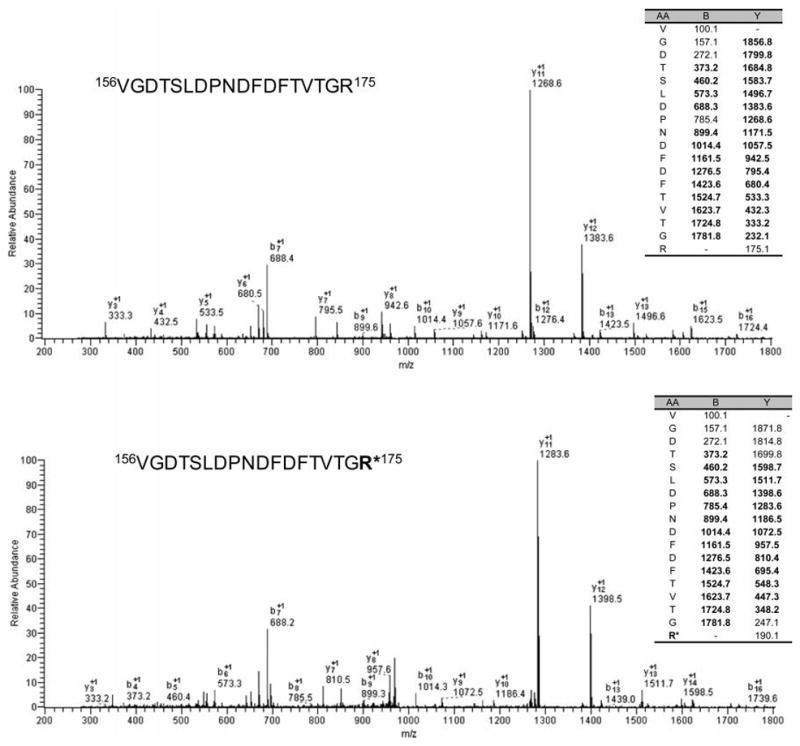
MS/MS confirmation of in vivo labeling of a MeCP2 peptide containing Arginine with 13CH3-Met. The same sample as in Figure 4 was analyzed and a methyl peptide was found to be labeled at R with an expected 15 Da mass increase, demonstrating in vivo methylation at the R residue. MS/MS spectra of (A) the unmodified MeCP2 peptide 156VGDTSLDPNDFDFTVTGR175 and (B) its methylated counterpart. The 13CH3-methylated R* is evidenced by y3–y14 ions with 15 Da mass shifts.
Glutamic Acid Can Be Methylated by Methanol-Containing Buffer during Gel Destaining in Vitro
The SILAC experiment strongly suggests the possibility that methylation can happen in vitro. Because methanol is extensively used in SDS-PAGE and subsequent sample preparation for mass spectrometry analysis, we suspect that some of the methylation may happen during these processes. To answer whether methanol can act as an in vitro methyl donor for D/E methylation, we carried out in-gel digestion of BSA with or without methanol. We used a gel-staining kit (ProtoBlue Safe, National Diagnostics) that does not contain methanol in its solutions, to prevent in vitro methylation before protein digestion, and analyzed BSA tryptic digests in HPLC buffers that do not contain methanol. To improve the sensitivity, we employed selective ion monitering in the MS/MS mode, which is to isolate ions based on their theoretical m/z values and acquire MS/MS spectra. We selected 10 peptides, each of which contains at least one D/E, and their hypothetical methylated form.
Analysis of HPLC/MS/MS of BSA peptides digested with modified non-methanol protocol identified 31 peptides and zero D/E-methylated peptide. On the other hand, 29 peptides and 4 E-methylated peptides (SI, Table S-2, Figure S-7) were identified from BSA tryptic peptides generated using standard methanol-containing protocol. The intensities of the 29 unmodified peptides shared by the two analyses were comparable, suggesting that the absence of E-methylated peptides is not caused by the difference of in-gel digestion efficiency. These data demonstrate that glutamate could be methylated in vitro during mass spectrometric sample processing in destaining of the SDS-PAGE gel in methanol-containing buffer.
Taking both the SILAC SAM labeling and in vitro BSA methylation results, the failure to confirm methylation by in vivo SAM labeling could be explained by two possibilities. First, methyl donors other than SAM might be used for the methylation reactions in cells. For example, folate (methyl-tetrahydrofolate) was known to be another methyl donor for methionine synthesis.44 Alternatively, methylation happens exogenously during sample handling and processing. During SDS-PAGE and subsequent staining/destaining, large amounts of methanol and acidic acid are used. The side chains of D/E can be methylated by the nucleophilic addition of the OH group of methanol to the protonated COOH group. On the other hand, under the same condition, the side chains of H, K, and R are protonated and can neither attack the methyl group of methanol nor be attacked by the OH group of methanol. Thus, exogenous methylation is likely for the D/E residue, but is harder to explain for H, K, and R residues when acidic acid and methanol are used. Thus, protein methylation as detected by mass spectrometry might happen both in vitro and in vivo, and careful verification is required to pinpoint the origin of methylation.
CONCLUSIONS
Improvement in sensitivity of mass spectrometry has enabled us to find protein modifications of low stoichiometry. This raises a question as to whether the observation of a mass increase from a peptide and subsequent MS/MS to pinpoint the modification site is sufficient to conclude that the residue is modified in vivo and whether another validation procedure is necessary. High occurrence of lysine formylation from silver-stained gels has been reported.45 Here we report the observation that peptides containing K, R, H, and E residues are modified with the addition of 14 or 28 Da, suggesting methylation. However, we failed to observe corresponding isotope labeling of these putative methylated proteins with isotope-labeled Met that is the precursor for SAM, the most widely used methyl donor in cells. This is attributed to either exogenous methylation reaction or the existence of additional methylation donors other than SAM. Our findings provide a cautionary note for protein methylation identified solely by mass spectrometry and point to the need for other independent verification, preferably by isotopic labeling, if the methylation reaction mechanism is clear. This precaution applies to not only poorly understood E-methylation reaction in mammalian system but also well-established in vivo N-methylation (K and R). In the case of D/E-methylation, the artifact may be minimized by using buffer systems without methanol.
Supplementary Material
Acknowledgments
This work is supported in part by NIH CA84199 (J.Q.) and Welch Foundation Q-1670 (J.Q.) and DOD- W81XWH-04-1-0137 (Y.W.). We thank Drs. Huda Zoghbi, Tony Eissa, and Wei Gu for the samples of MeCP2, iNOS, and p53.
Footnotes
SUPPORTING INFORMATION AVAILABLE
Additional information as noted in text. This material is available free of charge via the Internet at http://pubs.acs.org.
References
- 1.Cheng X, Zhang X. Mutat Res. 2007;618:102–15. doi: 10.1016/j.mrfmmm.2006.05.041. [DOI] [PMC free article] [PubMed] [Google Scholar]
- 2.Shi Y, Whetstine JR. Mol Cell. 2007;25:1–14. doi: 10.1016/j.molcel.2006.12.010. [DOI] [PubMed] [Google Scholar]
- 3.Walsh CT, Garneau-Tsodikova S, Gatto GJ., Jr Angew Chem, Int Ed. 2005;44:7342–72. doi: 10.1002/anie.200501023. [DOI] [PubMed] [Google Scholar]
- 4.Clarke S. Curr Opin Cell Biol. 1993;5:977–83. doi: 10.1016/0955-0674(93)90080-a. [DOI] [PubMed] [Google Scholar]
- 5.Kim SC, Sprung R, Chen Y, Xu Y, Ball H, Pei J, Cheng T, Kho Y, Xiao H, Xiao L, Grishin NV, White M, Yang XJ, Zhao Y. Mol Cell. 2006;23:607–18. doi: 10.1016/j.molcel.2006.06.026. [DOI] [PubMed] [Google Scholar]
- 6.Mann M, Jensen ON. Nat Biotechnol. 2003;21:255–61. doi: 10.1038/nbt0303-255. [DOI] [PubMed] [Google Scholar]
- 7.Rappsilber J, Friesen WJ, Paushkin S, Dreyfuss G, Mann M. Anal Chem. 2003;75:3107–14. doi: 10.1021/ac026283q. [DOI] [PubMed] [Google Scholar]
- 8.Boisvert FM, Cote J, Boulanger MC, Richard S. Mol Cell Proteomics. 2003;2:1319–30. doi: 10.1074/mcp.M300088-MCP200. [DOI] [PubMed] [Google Scholar]
- 9.Brame CJ, Moran MF, Broom-Cerajewski LD. Rapid Commun Mass Spectrom. 2004;18:877–81. doi: 10.1002/rcm.1421. [DOI] [PubMed] [Google Scholar]
- 10.Allis CD, Glover CV, Gorovsky MA. Proc Natl Acad Sci USA. 1979;76:4857–61. doi: 10.1073/pnas.76.10.4857. [DOI] [PMC free article] [PubMed] [Google Scholar]
- 11.Zhang X, Herring CJ, Romano PR, Szczepanowska J, Brzeska H, Hinnebusch AG, Qin J. Anal Chem. 1998;70:2050–9. doi: 10.1021/ac971207m. [DOI] [PubMed] [Google Scholar]
- 12.Chen Y, Kwon SW, Kim SC, Zhao Y. J Proteome Res. 2005;4:998–1005. doi: 10.1021/pr049754t. [DOI] [PubMed] [Google Scholar]
- 13.Dorsett D, Eissenberg JC, Misulovin Z, Martens A, Redding B, McKim K. Development. 2005;132:4743–53. doi: 10.1242/dev.02064. [DOI] [PMC free article] [PubMed] [Google Scholar]
- 14.Watrin E, Peters JM. Exp Cell Res. 2006;312:2687–93. doi: 10.1016/j.yexcr.2006.06.024. [DOI] [PubMed] [Google Scholar]
- 15.Yazdi PT, Wang Y, Zhao S, Patel N, Lee EY, Qin J. Genes Dev. 2002;16:571–82. doi: 10.1101/gad.970702. [DOI] [PMC free article] [PubMed] [Google Scholar]
- 16.Fang FC. J Clin Invest. 1997;99:2818–25. doi: 10.1172/JCI119473. [DOI] [PMC free article] [PubMed] [Google Scholar]
- 17.Lowenstein CJ, Padalko E. J Cell Sci. 2004;117:2865–7. doi: 10.1242/jcs.01166. [DOI] [PubMed] [Google Scholar]
- 18.Shapiro MJ, Chakrabarti I, Koshland DE., Jr Proc Natl Acad Sci USA. 1995;92:1053–6. doi: 10.1073/pnas.92.4.1053. [DOI] [PMC free article] [PubMed] [Google Scholar]
- 19.Terwilliger TC, Koshland DE., Jr J Biol Chem. 1984;259:7719–25. [PubMed] [Google Scholar]
- 20.Terwilliger TC, Wang JY, Koshland DE., Jr J Biol Chem. 1986;261:10814–20. [PubMed] [Google Scholar]
- 21.McFadden PN, Clarke S. Proc Natl Acad Sci USA. 1982;79:2460–4. doi: 10.1073/pnas.79.8.2460. [DOI] [PMC free article] [PubMed] [Google Scholar]
- 22.Hoelz DJ, Arnold RJ, Dobrolecki LE, bdel-Aziz W, Loehrer AP, Novotny MV, Schnaper L, Hickey RJ, Malkas LH. Proteomics. 2006;6:4808–16. doi: 10.1002/pmic.200600142. [DOI] [PubMed] [Google Scholar]
- 23.Bode AM, Dong Z. Nat Rev Cancer. 2004;4:793–805. doi: 10.1038/nrc1455. [DOI] [PubMed] [Google Scholar]
- 24.Nan X, Campoy FJ, Bird A. Cell. 1997;88:471–81. doi: 10.1016/s0092-8674(00)81887-5. [DOI] [PubMed] [Google Scholar]
- 25.Harikrishnan KN, Chow MZ, Baker EK, Pal S, Bassal S, Brasacchio D, Wang L, Craig JM, Jones PL, Sif S, El-Osta A. Nat Genet. 2005;37:254–64. doi: 10.1038/ng1516. [DOI] [PubMed] [Google Scholar]
- 26.Chuikov S, Kurash JK, Wilson JR, Xiao B, Justin N, Ivanov GS, McKinney K, Tempst P, Prives C, Gamblin SJ, Barlev NA, Reinberg D. Nature. 2004;432:353–60. doi: 10.1038/nature03117. [DOI] [PubMed] [Google Scholar]
- 27.Huang J, Perez-Burgos L, Placek BJ, Sengupta R, Richter M, Dorsey JA, Kubicek S, Opravil S, Jenuwein T, Berger SL. Nature. 2006;444:629–32. doi: 10.1038/nature05287. [DOI] [PubMed] [Google Scholar]
- 28.Huang J, Perez-Burgos L, Placek BJ, Sengupta R, Richter M, Dorsey JA, Kubicek S, Opravil S, Jenuwein T, Berger SL. Nature. 2006;444:629–32. doi: 10.1038/nature05287. [DOI] [PubMed] [Google Scholar]
- 29.Yao X, Nguyen V, Wriggers W, Rubenstein PA. J Biol Chem. 2002;277:22875–82. doi: 10.1074/jbc.M201685200. [DOI] [PubMed] [Google Scholar]
- 30.Cass KA, Clark EB, Rubenstein PA. Arch Biochem Biophys. 1983;225:731–9. doi: 10.1016/0003-9861(83)90084-x. [DOI] [PubMed] [Google Scholar]
- 31.Chuikov S, Kurash JK, Wilson JR, Xiao B, Justin N, Ivanov GS, McKinney K, Tempst P, Prives C, Gamblin SJ, Barlev NA, Reinberg D. Nature. 2004;432:353–60. doi: 10.1038/nature03117. [DOI] [PubMed] [Google Scholar]
- 32.Huang J, Perez-Burgos L, Placek BJ, Sengupta R, Richter M, Dorsey JA, Kubicek S, Opravil S, Jenuwein T, Berger SL. Nature. 2006;444:629–32. doi: 10.1038/nature05287. [DOI] [PubMed] [Google Scholar]
- 33.Amikura T, Sekine M, Hirai Y, Fujimoto S, Hatae M, Kobayashi I, Fujii T, Nagata I, Ushijima K, Obata K, Suzuki M, Yoshinaga M, Umesaki N, Satoh S, Enomoto T, Motoyama S, Nishino K, Haino K, Tanaka K. Gynecol Oncol. 2006;100:365–71. doi: 10.1016/j.ygyno.2005.09.010. [DOI] [PubMed] [Google Scholar]
- 34.Ohgaki H, Hard GC, Hirota N, Maekawa A, Takahashi M, Kleihues P. Cancer Res. 1992;52:2995–8. [PubMed] [Google Scholar]
- 35.Lewis JD, Meehan RR, Henzel WJ, Maurer-Fogy I, Jeppesen P, Klein F, Bird A. Cell. 1992;69:905–14. doi: 10.1016/0092-8674(92)90610-o. [DOI] [PubMed] [Google Scholar]
- 36.Amir RE, Van dVI, Wan M, Tran CQ, Francke U, Zoghbi HY. Nat Genet. 1999;23:185–8. doi: 10.1038/13810. [DOI] [PubMed] [Google Scholar]
- 37.Chen WG, Chang Q, Lin Y, Meissner A, West AE, Griffith EC, Jaenisch R, Greenberg ME. Science. 2003;302:885–9. doi: 10.1126/science.1086446. [DOI] [PubMed] [Google Scholar]
- 38.Ong SE, Mittler G, Mann M. Nat Methods. 2004;1:119–26. doi: 10.1038/nmeth715. [DOI] [PubMed] [Google Scholar]
- 39.Zhu H, Pan S, Gu S, Bradbury EM, Chen X. Rapid Commun Mass Spectrom. 2002;16:2115–23. doi: 10.1002/rcm.831. [DOI] [PubMed] [Google Scholar]
- 40.Ong SE, Blagoev B, Kratchmarova I, Kristensen DB, Steen H, Pandey A, Mann M. Mol Cell Proteomics. 2002;1:376–86. doi: 10.1074/mcp.m200025-mcp200. [DOI] [PubMed] [Google Scholar]
- 41.Zhang K, Tang H, Huang L, Blankenship JW, Jones PR, Xiang F, Yau PM, Burlingame AL. Anal Biochem. 2002;306:259–69. doi: 10.1006/abio.2002.5719. [DOI] [PubMed] [Google Scholar]
- 42.Galasinski SC, Resing KA, Ahn NG. Methods. 2003;31:3–11. doi: 10.1016/s1046-2023(03)00082-3. [DOI] [PubMed] [Google Scholar]
- 43.Boisvert FM, Cote J, Boulanger MC, Richard S. Mol Cell Proteomics. 2003;2:1319–30. doi: 10.1074/mcp.M300088-MCP200. [DOI] [PubMed] [Google Scholar]
- 44.Scott JM, Weir DG. Lancet. 1981;2:337–40. doi: 10.1016/s0140-6736(81)90650-4. [DOI] [PubMed] [Google Scholar]
- 45.Oses-Prieto JA, Zhang X, Burlingame AL. Mol Cell Proteomics. 2007;6:181–92. doi: 10.1074/mcp.M600279-MCP200. [DOI] [PubMed] [Google Scholar]
Associated Data
This section collects any data citations, data availability statements, or supplementary materials included in this article.