

Abstract
FRET technologies are now routinely used to establish the spatial relationships between two cellular components (A and B). Adding a third target component (C) increases the complexity of the analysis between interactions AB/BC/AC. Here, we describe a novel method for analyzing a three-color (ABC) FRET system called three-color spectral FRET (3sFRET) microscopy, which is fully corrected for spectral bleedthrough. The approach quantifies FRET signals and calculates the apparent energy transfer efficiencies (Es). The method was validated by measurement of a genetic (FRET standard) construct consisting of three different fluorescent proteins (FPs), mTFP, mVenus, and tdTomato, linked sequentially to one another. In addition, three 2-FP reference constructs, tethered in the same way as the 3-FP construct, were used to characterize the energy transfer pathways. Fluorescence lifetime measurements were employed to compare the relative relationships between the FPs in cells producing the 3-FP and 2-FP fusion proteins. The 3sFRET microscopy method was then applied to study the interactions of the dimeric transcription factor C/EBPα (expressing mTFP or mVenus) with the heterochromatin protein 1α (HP1α, expressing tdTomato) in live-mouse pituitary cells. We show how the 3sFRET microscopy method represents a promising live-cell imaging technique to monitor the interactions between three labeled cellular components.
Introduction
The use of the many different fluorescent proteins (FPs) (1) in fluorescence microscopy has led to a revolution in live-cell imaging techniques, allowing visualization of dynamic protein interactions under physiological conditions. Also, new organic dyes with improved photostability and pH stability and excellent spectral characteristics provide additional tools for cellular imaging. The use of these probes for Förster resonance energy transfer (FRET) microscopy allows investigators to monitor protein interactions inside living cells (2–5) and provides a sensitive tool for investigating a variety of biological phenomena that produce changes in molecular proximity over a range 1–10 nm.
Intensity-based FRET imaging methods that measure the sensitized emission from the acceptor can be used with most microscopy systems to monitor discrete molecular events. However, background signals resulting from spectral bleedthrough (SBT) contaminate the donor and acceptor channels and must be removed for accurate FRET measurements. Many different methods (6–22) have been developed to remove SBT, but most are limited to data analysis for a single donor/acceptor FRET pair. A method to measure the interrelationships of three cellular components (A, B, and C) would require sequential imaging and analysis of the FRET-pair combinations AB, BC, and AC. A simplified three-color FRET analysis system would be of great benefit in determining protein complex assemblies during signaling events, trafficking dynamics, or cytokinesis, particularly in the context of treatments, which may alter the relationship of the three components of interest.
Most studies of three-color FRET have been carried out in vitro in solutions using fluorometry or spectroscopy to detect components labeled by organic dyes for medical diagnostics (23–28). For example, a high-throughput screening assay based on three-color FRET was developed that monitors conformational changes of RNA and binding of the ribosomal protein S15 in the early stage of prokaryotic ribosome assembly (29). Besides ensemble-based assays, three-color FRET has also been employed for single-molecule studies (30–33). At present, only the studies of Galperin et al. (34), using a combination of cyan, yellow, and monomeric red FPs in wide-field microscopy, have attempted to apply three-color FRET analysis to processes in living cells. That study used double-labeled and single-labeled control specimens, as well as acceptor photobleaching of the most red-shifted FP in the triple-labeled specimens, to determine individual FRET efficiencies (34). This is essentially an adaptation of 2-color FRET methodology to the three possible FRET pairings, and the study lacked modeling to describe the energy transfer efficiencies in the system. Here, we describe a straightforward three-color FRET microscopy method that overcomes these shortcomings. The approach allows accurate determination of the interactions between three spectrally distinct fluorophores expressed in living cells, without routinely requiring double-labeled samples.
This novel, to our knowledge, three-color spectral FRET (3sFRET) method is based on the detection of the sensitized emissions from two different acceptors by confocal spectral microscopy. The approach utilizes three separate single-labeled control specimens, and algorithm-based software to determine the corrected FRET signals and apparent energy transfer efficiencies (Es) in a specimen producing proteins labeled with three different FPs. The method was evaluated using a FRET standard approach in living cells (21). For this approach, three different FPs—mTFP, mVenus, and tandem dimer Tomato (tdTomato)—were linked to each other to generate a three-color FRET standard. In addition, three different 2-FP combinations, each tethered in the same way as the 3-FP construct, were generated. The 2-FP reference constructs were analyzed using an established 2-color spectral FRET (2sFRET) microscopy method and were compared with the apparent Es of the 3-FP construct processed in 3sFRET microscopy, assuming spatial relationships between FPs in the 2-FP reference constructs being identical to those in the 3-FP construct, verified by fluorescence lifetime measurements. Once validated, the 3sFRET microscopy method was applied to characterize the interactions between the dimerized transcription factor CCAAT/enhancer binding protein α (C/EBPα) and the heterochromatin protein-1α (HP1α) in live-mouse pituitary cells. Our studies demonstrate that the 3sFRET microscopy method represents a promising live-cell imaging technique to monitor the interactions between three different labeled cellular components that form complexes, clusters, or discrete associations during cellular signaling or trafficking events.
Materials and Methods
The three-color FRET imaging model
The energy transfer efficiency (E) of a FRET pair, defined as the energy transfer rate (kT) divided by the sum of all deactivation rates of the excited state of the donor (Eq. 1), is dependent on the inverse of the sixth power of the distance between the donor and acceptor (Eq. 2) (35,36). Thus, measuring changes of E can indicate distance changes between the donor and acceptor.
| (1) |
| (2) |
where k is the sum of the rates for deactivation of the excited state of the donor other than FRET, including the total nonradiative rate (knr) of the donor in the absence of any acceptor and the radiative rate (kr) of the donor. Ro is the Förster distance of the FRET pair (see Section D in the Supporting Material for details).
The three-color FRET model has three symbolic fluorophores, F1 (donor), F2 (acceptor to F1 and donor to F3), and F3 (acceptor), assuming that the spectral overlap (donor emission-acceptor excitation) of each pair (F1-F2, F1-F3, and F2-F3) is sufficient for FRET to occur. Ex1, Ex2, and Ex3 are the one-photon peak excitation wavelengths for F1, F2, and F3, respectively. For a practical imaging model to calculate the E values in the three-fluorophore system, we made the following assumptions:
-
•
Any potential excitation of F1 by Ex2 under experimental imaging conditions does not produce any noticeable signal or cause energy transfer.
-
•
Any potential excitation of F1 or F2 by Ex3 under experimental imaging conditions does not produce any noticeable signal or cause energy transfer.
Ex1 excitation
Energy transfer events in the three-fluorophore system at Ex1 are of prime interest.
F1 (donor) is excited and transfers energy directly to F2 (acceptor) at a rate kT12.
F1 (donor) is excited and transfers energy directly to F3 (acceptor) at a rate kT13.
F2 (acceptor to F1 and donor to F3) can directly absorb Ex1 and be sensitized due to the energy transfer from F1 (donor), and it then transfers energy to F3 (acceptor) at a rate kT23.
Based on Förster theory, the F1-F2, F1-F3, and F2-F3 E values in the three-fluorophore system excited by Ex1 are defined as E12 (Eq. 3), E13 (Eq. 4), and E23 (Eq. 5), respectively.
| (3) |
| (4) |
| (5) |
The E between F2 and F3 (E23) is governed by kT23 and k2 (Eq. 5), showing a two-color FRET event (Eq. 1); thus, the E (E23)-distance (r23) relationship for the F2-F3 pair is described by Eq. 2, with their Förster distance (Ro23). However, the competition between the energy transfers from the donor (F1) to the two acceptors (F2 and F3) makes the F1-F2 (E12) and F1-F3 (E13) E values mutually dependent on both kT12 and kT13, in addition to k1 (Eqs. 3 and 4). Therefore, the E-distance relationship for the F1-F2 or F1-F3 pair cannot be simply explained by Eq. 2. The estimation of either the F1-F2 (r12) or F1-F3 (r13) distance requires measurement of both E12 and E13, as shown in Eqs. 6 and 7 (24).
| (6) |
| (7) |
where Ro12 and Ro13 are the Förster distances of the F1-F2 and F1-F3 pairs, respectively.
Equations 2, 6, and 7 suggest that the distances between fluorophores (r12, r13, and r23) in the three-color FRET system are directly mapped from their E values (E12, E13, and E23) subjected to their Förster distances (Ro12, Ro13, and Ro23). Therefore, the E measurements can provide valuable predictions of the relative distance (changes) between fluorophores. To develop a sensitized FRET microscopy imaging model to measure the E values in the three-fluorophore system, we followed a similar analytical calculation scheme used by Watrob et al. (25) to obtain the emitted intensities of F1 (I11), F2 (I12), and F3 (I13) when excited by Ex1:
| (8) |
| (9) |
| (10) |
where QY1, QY2, and QY3 are the native quantum yields of F1, F2, and F3, respectively, and IA11, IA12, and IA13 are the absorbed intensities of F1, F2, and F3, respectively, at t = 0. The derivation of Eqs. 8–10 is described in Section A of the Supporting Material.
Ex2 excitation
Assuming that under experimental conditions Ex2 does not excite F1 to any noticeable degree, the three-fluorophore system excited by Ex2 becomes a two-color FRET system, where F2 transfers energy to F3 at the rate kT23 and the corresponding energy transfer efficiency is E23 (Eq. 6). The emitted intensities of F2 (I22), and F3 (I23) in the three-fluorophore system excited by Ex 2 were derived as follows:
| (11) |
| (12) |
where IA22 and IA23 are the absorbed intensities of F2 and F3, respectively, at t = 0.
Ex3 excitation
Assuming that under experimental conditions Ex3 does not excite F1 and F2 to produce a noticeable signal, there is no FRET signal considered at Ex3 in the three-fluorophore system.
3sFRET microscopy
Based on the model described above, 3sFRET utilizes a spectral microscopy imaging technique, which produces λ-stacks consisting of x and y (spatial) and λ (spectral) dimensions with emission signals in a series of spectral intervals equally sampled over a spectral range at each pixel location. When it is combined with a linear unmixing algorithm (37) to separate the emitted signals of the three fluorophores, spectral imaging microscopy provides a rigorous validation of our algorithm. Given the reference spectra of single-labeled control specimens, linear unmixing provides one of the most accurate ways to separate FRET signals from the donor spectral bleedthrough contaminations caused by the overlap of the donor emission into the acceptor spectrum; acceptor spectral bleedthrough (ASBT) components are still mixed with the FRET signals, but will be removed by our data analysis algorithm, which employs single-labeled control specimens.
Data acquisition procedure
The data acquisition procedure is illustrated in Table 1. The triple-labeled (F1-F2-F3) specimen is excited sequentially by Ex1, Ex2, and Ex3 to acquire three λ-stacks. The λ-stacks are then unmixed into the F1, F2, and F3 channels using the combination of the F1, F2, and F3 reference spectra, which are obtained from the F1, F2, and F3 single-labeled specimens excited by Ex1, Ex2, and Ex3, respectively. The λ-stacks of the F2 (excited sequentially by Ex1 and Ex2) and F3 (excited sequentially by Ex1, Ex2, and Ex3) single-labeled specimens are also acquired and unmixed to remove ASBT contaminations (discussed below).
Table 1.
Image acquisition steps in 3sFRET microscopy
| Specimens | Excitation∗ | Spectral images(λ-stack) | Unmixed images† |
||
|---|---|---|---|---|---|
| F1 channel | F2 channel | F3 channel | |||
| F1-F2-F3 |
Ex1 | I1S | I11 | I12 | I13 |
| Ex2 | I2S | — | I22 | I23 | |
| Ex3 | I3S | — | — | I33 | |
| F1 | Ex1 | I11S | — | — | — |
| F2 |
Ex1 | I21S | — | I212 | — |
| Ex2 | I22S | — | I222 | — | |
| F3 | Ex1 | I31S | — | — | I313 |
| Ex2 | I32S | — | — | I323 | |
| Ex3 | I33S | — | — | I333 | |
Ex1, Ex2, and Ex3 are the excitation wavelengths for F1, F2, and F3, respectively. All imaging parameters are identical for triple- and single-labeled specimens.
Signals in a λ-stack are directly linearly unmixed on the system into the F1, F2, and F3 channels using the same set of F1, F2, and F3 reference spectra: I11S, I22S, and I33S; ASBT correction requires a second step, included in the 3sFRET software.
The data processing routine
The data processing routine was designed through analyzing the signal components in the unmixed images of the triple-labeled specimen, based on the theoretical analysis described in the three-color FRET imaging model. The nomenclature and interactions of these signal components is shown in Fig. 1 and described as follows. The spectral images (I1S) of the triple-labeled specimen excited by Ex1 are linearly unmixed into the F1 (I11), F2 (I12), and F3 (I13) channels (Table 1).
I11 (Eq. 8) is the emission signal of quenched F1.
I12 (Eq. 9) has two components: FRET12 (QY2 × IA11 × E12 × [1 − E23]) is the sensitized emission of F2 due to the energy transfer F1→F2, reduced by the energy transfer F2→F3; ASBT12 (QY2 × IA12 × [1 − E12]) is the emission signal of F2 excited by Ex1.
I13 (Eq. 10) has four components: FRET13 (QY3 × IA11 × E13) is the sensitized emission of F3 due to the energy transfer F1→F3; FRET23t (QY3 × IA11 × E12 × E23) is the sensitized emission of F3 on the energy transfer relay F1→F2→F3, where FRET F2→F3 is induced by FRET F1→F2; FRET23d (QY3 × IA12 × E23) also quantifies the sensitized emission of F3 due to the energy transfer F2→F3, but this energy transfer is induced by the direct excitation of Ex1; ASBT13 (QY3 × IA13) is the emission signal of F3 excited by Ex1.
Figure 1.
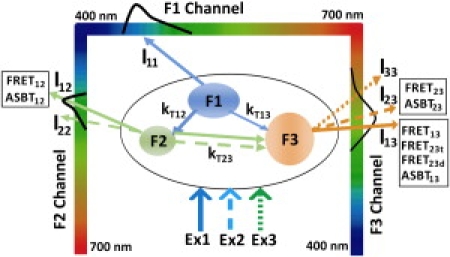
Signal components in the triple-labeled unmixed images in 3sFRET microscopy. The donor spectral bleedthrough is removed through linear unmixing; however, FRET signals still contain the acceptor spectral bleedthrough (ASBT). The λ-stack I1S (excited by Ex1) is unmixed into the F1 (I11), F2 (I12), and F3 (I13) channels: I11 is the quenched F1 signal; I12 has both FRET (FRET12) and ASBT (ASBT12) signals; I13 includes ASBT (ASBT13) and several FRET signals: FRET13, FRET23t, FRET23d. When excited by Ex2, the specimen becomes a two-color (F2-F3) FRET system. After unmixing the λ-stack I2S, two images are obtained in the F2 (I22) and F3 (I23) channels: I22 is the quenched F2 signal; I23 is both FRET (FRET23) and ASBT (ASBT23). Ex3 does not produce FRET. The image I33 obtained through unmixing the λ-stack I3S measures the F3 fluorescence intensities. Detailed explanations of each signal component are given in the section entitled: The data processing routine.
Inserting the above signal components into Eqs. 8–10, we then derived Eqs. 13 and 14 to calculate E12 and E13:
| (13) |
| (14) |
where (x,y) is a pixel coordinate; SS1, SS2, and SS3 are the detector spectral sensitivities at the F1, F2, and F3 peak emission wavelengths, respectively, used to correct for a signal readout difference induced by the quantum efficiencies of the detector at different wavelengths. The FRET12 signal is measured by separating the ASBT12 signal from the I12 image:
| (15) |
The FRET13 + FRET23t signal is quantified by removing both the FRET23d and ASBT13 signal components from the I13 image (Eq. 16). FRET23d represents the energy transfer from F2 to F3 while F2 is directly excited by Ex1; the energy transfer efficiency (E23) can be expressed using ASBT12 (quenched donor signal) and FRET23d (FRET signal) in Eq. 17; thus, given E23 and ASBT12 (calculations of which are described below), FRET23d can be calculated (Eq. 17).
| (16) |
| (17) |
E23 is measured by exciting the three-fluorophore system with Ex2, when the system becomes a two-color FRET (F2-F3) system. The spectral images (I2S) of the triple-labeled specimen are linearly unmixed into the F2 (I22) and F3 (I23) channels (Table 1).
I22 (Eq. 11) is the emission signal of quenched F2.
I23 (Eq. 12) has two signal components: FRET23 (QY2 × IA22 × E23) measures the sensitized emission of F3 due to the energy transfer F2→F3; ASBT23 (QY3 × IA22) is the emission signal of F3 excited by Ex2.
E23 is then calculated from I22 and FRET23 in Eq. 18, and FRET23 is measured by removing ASBT contaminations from the I23 image in Eq. 19.
| (18) |
| (19) |
Now, the only requirement for the calculations of E12 (Eq. 13), E13 (Eq. 14), and E23 (Eq. 18) is to determine ASBT12 and ASBT13 (Eqs. 15–17) and ASBT23 (Eq. 19), which is a common problem in sensitized FRET microscopy. In 3sFRET microscopy, this problem is solved by using the F2 and F3 single-labeled control specimens and employing the same mechanism applied in an established (2sFRET) microscopy method (21), which was developed for analyzing a single FRET pair composed of one donor and one acceptor. Briefly, the ASBT12, ASBT13, and ASBT23 levels are estimated by Eqs. 20–22, respectively:
| (20) |
| (21) |
| (22) |
where the I22 and I33 images are described above (Table 1). For different pixel intensities in I22, ASBT12ratio is calibrated from I212/I222 (Table 1). In the same way, for different pixel intensities in I33, ASBT13ratio and ASBT23ratio are calibrated from I313/I333 and I323/I233 (Table 1).
The 3sFRET microscopy algorithm was incorporated into a software package. Given the input of a set of unmixed images of the triple-labeled and single-labeled specimens described in Table 1, the software will generate the FRET12, FRET13 + FRET23t, FRET23, E12, E13, and E23 images, and it also produces a full data set with the option of creating a set of regions of interest and statistical evaluations. An additional algorithm, applied to three-color FRET in wide-field or conventional confocal microscopy was also developed to quantify FRET signals and E values in the three-fluorophore system (see Section B in the Supporting Material).
Plasmid construction, cell transfection, and imaging methodologies
A plasmid was generated that incorporated the coding sequences for three separate FPs, mTFP (F1), mVenus (F2), and tdTomato (F3), each linked sequentially. The mTFP was coupled to mVenus by a five-amino-acid (aa) sequence (SGLRS), and mVenus was linked to tdTomato by a 10-aa sequence (KEFCSRPVAT), encoding the fusion protein mTFP-5aa-mVenus-10aa-tdTomato (F1-F2-F3). In addition, three separate 2-FP FRET-standard plasmids were also generated: mTFP-5aa-mVenus (F1-F2), mVenus-10aa-tdTomato (F2-F3), and mTFP-5aa-Amber-10aa-tdTomato (F1-F3). Amber is a nonfluorescent mutant form of mVenus (Y66C) used in the F1-F3 construct to maintain the same spatial relationship between mTFP and tdTomato as in the 3-FP construct. Each of the plasmids was used in transfection of live-mouse pituitary GHFT1 cells, and the fluorescence signals from the fusion proteins produced were acquired and analyzed (see details in Section C of the Supporting Material). In addition, the 3sFRET microscopy method was applied to characterize the interactions between the dimerized transcription factor C/EBPα (expressing either mTFP or mVenus) and the heterochromatin binding protein HP1α (expressing tdTomato) in live-mouse pituitary GHFT1 cells. Details about the C/EBPα-mTFP, C/EBPα-mVenus and HP1α-tdToamto constructs are described in Section C of the Supporting Material. The photophysical properties and respective FRET pair Förster distances of mTFP, mVenus, and tdTomato are shown in Section D of the Supporting Material.
The 3-FP FRET-standard specimens were analyzed in 3sFRET microscopy, and the 2-FP FRET-standard reference specimens were processed by the established 2sFRET microscopy method (21) to validate the 3sFRET results, with the usage of single-labeled cells only expressing mTFP, mVenus, or tdTomato (see Table S3 in the Supporting Material). In addition, we created a second F1-F2 reference specimen by photobleaching tdTomato in the specimen expressing the mTFP-5aa-mVenus-10aa-tdTomato construct. The 2-FP/double-labeled reference specimens are not required for regular 3sFRET, but served to substantiate the algorithm. The 3sFRET microscopy method was then applied to cells expressing C/EBPα-mTFP, C/EBPα-mVenus, and HP1α-tdTomato together. Here, the single-labeled cells that expressed only C/EBPα-mTFP, C/EBPα-mVenus, or HP1α-tdTomato were used for SBT correction. Details about the three-color and two-color sFRET imaging and data analysis are described in Section E of the Supporting Material. Fluorescence lifetime imaging (FLIM) measurements were also carried out to compare the linkers in the 3-FP versus the 2-FP FRET-standard constructs. Details about the FLIM-FRET imaging and data analysis are shown in Section F of the Supporting Material.
Results and Discussion
For any new assay, there are many elements that need to be optimized and verified, some only initially, and 3sFRET is no exception. Although the algorithm described here does not require double-labeled specimens, it is sensible to initially prepare double-labeled FRET pairs, check their spectral properties, and verify that F1 interacts with F2 and/or F3 and F2 interacts with F3, and to finally evaluate these results with those obtained using 3sFRET.
Validation of the 3sFRET microscopy method using the FRET standards
Fig. 2 A shows the raw three λ-stacks for the 3-FP FRET-standard construct expressed in live cells excited at Ex1 (458 nm; solid line), Ex2 (514 nm; dashed line), and Ex3 (561 nm; dotted line) wavelengths, respectively, before linear unmixing. Fig. 2, B–D, provides the spectra of the single-labeled control specimens, where the solid-line data are used for linear unmixing: mTFP at Ex1 (Fig. 2 B); mVenus at Ex2 (Fig. 2 C); tdTomato at Ex3 (Fig. 2 D). For removal of ASBT contaminations, a different combination of the λ-stack data from the single-labeled control specimens was used: mVenus at Ex1 and Ex2 (Fig. 2 C, solid and dashed lines); tdTomato at Ex1, Ex2, and Ex3 (Fig. 2 D, solid, dashed, and dotted lines). The unprocessed data provided some interesting observations. First, the spectrum of the mTFP-5aa-mVenus-10aa-tdTomato specimen excited by Ex3 (561 nm; Fig. 2 A, dotted line) was almost identical to the tdTomato reference spectrum (Fig. 2 C, solid line), indicating that neither mTFP nor mVenus was excited by the 561 nm wavelength under these imaging conditions. Second, the spectral peaks for the acceptor fluorophores (Fig. 2 A) at Ex1–Ex3 suggested that FRET had occurred, even without the linear unmixing and ASBT correction. Processing the unmixed images in the 3sFRET software produced the E images shown in Fig. 2 E (E between mTFP and mVenus), Fig. 2 F (E between mTFP and tdTomato), and Fig. 2 G (E between mVenus and tdTomato).
Figure 2.
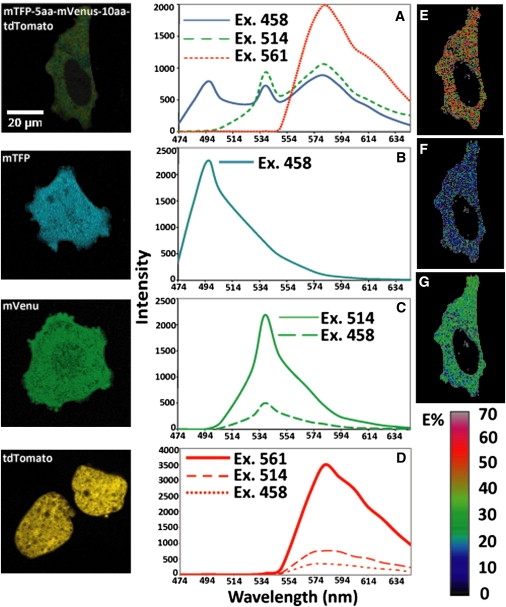
Image acquisition in 3sFRET microscopy. Triple- and single-labeled specimens were excited under identical imaging conditions, at optimal power levels for each excitation wavelength. (A–D) The λ-stacks of an mTFP-5aa-mVenus-10aa-tdTomato (F1-F2-F3) specimen were generated at 458-nm (Ex1) (solid line), 514-nm (Ex2) (dashed line), and 561-nm (Ex3) (dotted line) wavelengths (A), and were then unmixed using the mTFP (F1) (B), mVenus (F2) (C, solid line), and tdTomato (F3) (D, solid line) reference spectra. (E–G) Processing the unmixed images in the 3sFRET software produced the apparent FRET efficiency images for mTFP-mVenus (E12 × 100) (E), mTFP-tdTomato (E13 × 100) (F), and mVenus-tdTomato (E23 × 100) (G). In this process, the unmixed images of the mVenus and tdTomato single-labeled specimens were also used to remove ASBT contaminations. In C, comparing the λ-stacks of an mVenus-alone specimen excited at the 458-nm (dashed line) and 514-nm (solid line) wavelengths indicated the ASBT level of mVenus. In D, the λ-stacks of a tdTomato-alone specimen excited at the 458-nm (dotted line), 514-nm (dashed line), and 561-nm (solid line) wavelengths were compared to show the ASBT levels of tdTomato. (Zeiss 510 Meta (Carl Zeiss Inc., Thornwood, NY) 63 X/1.4 NA oil).
Representative acquired and processed images of the 2-FP FRET-standard reference specimens analyzed by 2sFRET microscopy are shown in Fig. S4, where the data analysis is described. A comparison of the two λ-stacks obtained with 458 nm excitation before and after photobleaching tdTomato in the 3-FP FRET-standard specimen shows intensity increase at the peak emission wavelengths of both mTFP and mVenus (see Fig. S4). This observation indicates that both mTFP and mVenus transferred energy to tdTomato, since both fluorophores were dequenched after tdTomato was bleached.
Average E values of the 3-FP FRET-standard specimens (n = 9) are listed in Table 2, along with those of the 2-FP FRET-standard reference specimens evaluated in 2sFRET microscopy. E12, E13, and E23 are the average E values between mTFP and mVenus, between mTFP and tdTomato, and between mVenus and tdTomato, respectively. As with other intensity-based sensitized FRET techniques, E values measured in 3sFRET microscopy are also apparent energy transfer efficiencies, which inter alia include non-FRET donors in the calculation. The distances between fluorophores are therefore an expression of relative proximities—valuable information in the study of cellular events. In three-color FRET, E values of F1-F2 and F1-F3 are influenced by each other (Eqs. 6 and 7). However, to directly compare the E values of F1-F2 and F1-F3 of the 2-FP and 3-FP FRET-standard constructs, the following adjustments are made to the 3-FP E values: for F1-F2, we need to adjust the 42.57% value by E12/(1 − E13) to 49.94%, and for F1-F3 the 14.76% needs to be adjusted by E13/(1 − E12) to 25.7%. Table 2 shows that the adjusted E for F1-F2 of the 3-FP specimens (49.94%) closely matches that of the mTFP-5aa-mVenus (F1-F2) reference specimens (51.18%) and slightly differs from that of another F1-F2 (mTFP-5aa-mVenus-10aa-tdTomato after bleaching tdTomato) reference specimens (56.38%). A difference is seen between the adjusted E for F1-F3 of the 3-FP specimens (25.7%) and that of the F1-F3 reference specimens (17.11%). This is most likely explained by the difference between the F1-F3 spatial relationships in the two constructs (see FLIM-FRET measurements below). The F2-F3 E value of the 3-FP specimens (27.73%) is measured by exciting the specimens with Ex2 (essentially a two-color FRET event, since Ex2 does not excite F1) and thus can be directly compared to that of the F2-F3 reference specimens (26.39%) processed in 2sFRET microscopy.
Table 2.
Apparent FRET E values between fluorophores of 3-FP specimens processed by the 3sFRET algorithm and 2-FP reference specimens processed with the 2sFRET algorithm
| Method | 3-FP and 2-FP specimens | FRET event between
fluorophores∗ |
||
|---|---|---|---|---|
| F1-F2 (E12 × 100)(mTFP-mVenus) | F1-F3 (E13 × 100)(mTFP-tdTomato) | F2-F3 (E23 × 100)(mVenus-tdTomato) | ||
| 3sFRET | mTFP-5aa-mVenus-10aa-tdTomato(F1-F2-F3) | 42.57 ± 1.00(Equivalent two-color E is 49.94%) † | 14.76 ± 0.87(Equivalent two-color E is 25.7%) ‡ | 27.73 ± 3.15 |
| mTFP-5aa-mVenus-10aa-tdTomato after bleaching tdTomato | 56.38 ± 0.82 | NA |
NA |
|
| mTFP-5aa-mVenus (F1-F2) |
51.18 ± 1.93 |
|||
| 2sFRET | mTFP-5aa-Amber-10aa-tdTomato (F1-F3) |
NA |
17.11 ± 1.12 |
NA |
| mVenus-10aa-tdTomato (F2-F3) | NA | NA | 26.39 ± 3.69 | |
In 3sFRET, the F1-F2 and F1-F3 E values are mutually dependent on both F1-F2 and F1-F3 distances, and the E-distance relationship for F1-F2 or F1-F3 is described by Eqs. 6 and 7. In 2sFRET, the E-distance relationship of a single FRET pair is described by Eq. 2. To compare F1-F2 or F1-F3 E values of 3sFRET and 2sFRET microscopy, an adjustment of the 3sFRET E is necessary (see † and ‡). For the F2-F3 of the 3-FP specimen, the E value is measured by exciting the specimen with Ex2 (essentially a two-color FRET event, since Ex2 does not excite F1) and thus is directly comparable to that measured from the F2-F3 2-FP reference specimen.
Using the FRET-standard data, we investigated whether the signal levels could influence the E values calculated by the 3sFRET algorithm. Thus, the E12, E13, and E23 data were plotted over the mTFP, mVenus, and tdTomato intensity levels in Fig. S2. The figure demonstrates that the E results are consistent and that the three E values are well separated, with an intensity range of 500 gray levels to the saturation level of 4095 (12 bit).
FLIM-FRET measurements
FLIM microscopy was used to validate the FRET standard, and to verify the spatial relationship measurements obtained by the intensity-based 3sFRET and 2sFRET microscopy. Fig. 3 A shows the decay rates determined for the mTFP-5aa-Amber, mTFP-5aa-mVenus, mTFP-5aa-Amber-10aa-tdTomato, and mTFP-5aa-Amber-10aa-tdTomato in living cells. As expected, the mTFP-5aa-Amber (donor-alone control) had the longest lifetime (2.73 ns). The donor lifetime was shortened more in the mTFP-5aa-mVenus (1.61 ns) than in the mTFP-5aa-Amber-10aa-tdTomato (2.08 ns), where in each case there is only one route for energy transfer from mTFP directly to mVenus or tdTomato. The decay rate was increased most for mTFP-5aa-mVenus-10aa-tdTomato, resulting in the shortest mTFP lifetime (1.21 ns), which reflects the two quenching routes for mTFP by both mVenus and tdTomato. Fig. 3 C provides representative examples of the processed data of the four constructs.
Figure 3.
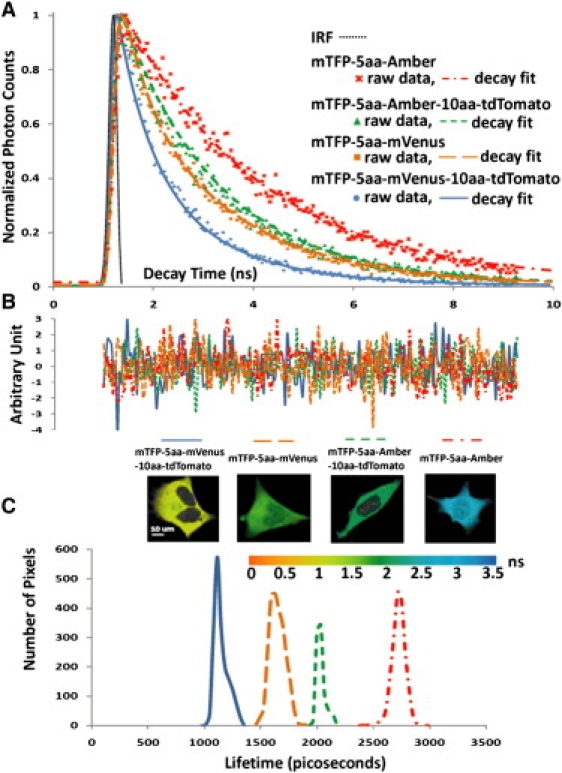
FLIM-FRET measurements. The mTFP-5aa-mVenus (F1-F2), mTFP-5aa-Amber-10aa-tdTomato (F1-F3), and mTFP-5aa-mVenus-10aa-tdTomato (F1-F2-F3) constructs were analyzed by FLIM-FRET microscopy. The unquenched donor lifetime was determined from mTFP-5aa-Amber cells using a single exponential decay model. The quenched donor lifetime in the presence of an acceptor—mVenus, tdTomato, or mVenus-10aa-tdTomato—was based on a biexponential decay model. All lifetimes were determined using an estimated instrument response function (IRF) of 300 ps at the full width at half-maximum for the FLIM system (dotted line in A). (A) Representative raw data and decay fit for each construct—mTFP-5aa-Amber (dot-dashed line), mTFP-5aa-Amber-10aa-tdTomato (short-dashed line), mTFP-5aa-mVenus (long-dashed line), and mTFP-5aa-mVenus-10aa-tdTomato (solid line). (B) Corresponding fitting residuals. (C) Lifetime distributions for quenched mTFP in mTFP-5aa-mVenus-10aa-tdTomato (1.21 ns), mTFP-5aa-mVenus (1.61 ns), and mTFP-5aa-Amber-10aa-tdTomato (2.08 ns) and unquenched mTFP in mTFP-5aa-Amber (2.73 ns). These measurements clearly indicate the fastest decay of mTFP in the presence of the two acceptors (-5aa-mVenus-10aa-tdTomato) and also a faster decay of mTFP with -5aa-mVenus than with -5aa-Amber-10aa-tdTomato. (Biorad Radiance 2100 (Carl Zeiss Inc.) with Becker & Hickl SPC 150 (Becker and Hickl, Berlin, Germany) and mutliphoton excitation at 870 nm, 63 X/1.2 NA water).
The FLIM-FRET measurements estimated the E values for mTFP-5aa-mVenus and mTFP-5aa-Amber-10aa-tdTomato at 41.03% and 23.81%, respectively (see Section F in the Supporting Material). Differences between the FLIM-FRET E values and the 2sFRET E values (Table 2) are observed, as a direct comparison between FLIM-FRET and sFRET E values is only possible if coefficients are known for the quantum yields and instrument quantum efficiencies (see Eqs. 13, 14, and 18). It is usually difficult to carry out these calibrations. However, this is not an issue for measuring changes of Es, since those parameters are assumed to be consistent factors within an assay. There are other differences between FLIM-FRET and intensity-based sensitized FRET E values, such as 3sFRET or 2sFRET, which measures the apparent E between fluorophores, since it cannot distinguish quenched (FRET) from non-quenched (non-FRET) donors. In contrast, the FLIM-FRET microscopy method can estimate the percentages (pre-exponential factors) of different donor species (quenched or unquenched). These factors can cause differences between the intensity-based sensitized FRET E and the FLIM-FRET E, measured on the same FRET system (13,16,19).
The overall E of mTFP-5aa-mVenus-10aa-tdTomato was determined as 55.79%, and this E accounts for the energy transfers from mTFP to both mVenus and tdTomato (see Section F in the Supporting Material). Taking the E values of F1-F2 (41.03%) or F1-F3 (23.81%) into Eq. 2, the corresponding F1-F2/F3 distance is calculated. Assuming the two distances are maintained in the 3-FP specimen, and using Eqs. 6 and 7, we then calculated the individual E values of F1-F2 (34.65%) and F1-F3 (15.56%) in the three–FP construct. The sum of the two individual E values is 50.21%, which is slightly smaller than the overall E (55.79%) measured from the 3-FP specimen. This relationship was also observed from the intensity-based (2sFRET versus 3sFRET) measurements: the sum (68.29%) of the E values of the F1-F2 (51.18%) and F1-F3 (17.11%) reference specimens is smaller than the sum (75.64%) of the F1-F2 (49.94%) and F1-F3 (25.7%) two-color equivalent E values of the 3-FP specimen (Table 2). A similar issue was discussed in the literature (38), but current experimental techniques have not resolved this issue. We do not think this is an obstacle to 3sFRET microscopy, since this technique, as with other intensity-based sensitized FRET techniques, is mainly designed to measure relative changes in E rather than absolute E values within a biological assay. Despite some caveats that exist when comparing FLIM-FRET E values directly with those obtained using intensity-based measurements, we concluded that the FRET-standard approach was suitable for development and validation of the 3sFRET assay.
Detecting the interactions of dimerized C/EBPα with HP1α using 3sFRET
The 3sFRET method was then used to measure the interactions between C/EBPα and HP1α in the living-cell nucleus. The C/EBP family of transcription factors localizes to regions of constitutive heterochromatin in mouse cells, where their associations may function to establish cell-specific patterns of gene expression (39,40). C/EBPα is known to bind to the repetitive DNA elements that form the chromocenters as an obligate dimer (41). Earlier, we used FRET-based imaging to directly measure the dimerized C/EBPα in regions of heterochromatin (42). It is important to note that when localized to the chromocenters, C/EBPα interacts with other proteins that mark these domains, including HP1α (43). Here, we used 3sFRET to establish that the C/EBPα dimer was associated with HP1α in regions of heterochromatin (Fig. 4). The three-color FRET results suggest that the dimerized C/EBPα proteins form clusters in regions of centromeric heterochromatin, and there is clearly some form of regulated interaction between C/EBPα and HP1α. To verify the 3sFRET measurement, photobleaching of the tdTomato labeling HP1α was carried out in selected triple-labeled cells. Intensity increases in the spectra obtained for both mTFP and mVenus were observed in the regions of heterochromatin after the photobleaching of tdTomato (Fig. S3). When combined with the 3sFRET measurements, these results confirmed FRET measurements between the dimerized C/EBPα and HP1α in the living-cell nucleus.
Figure 4.
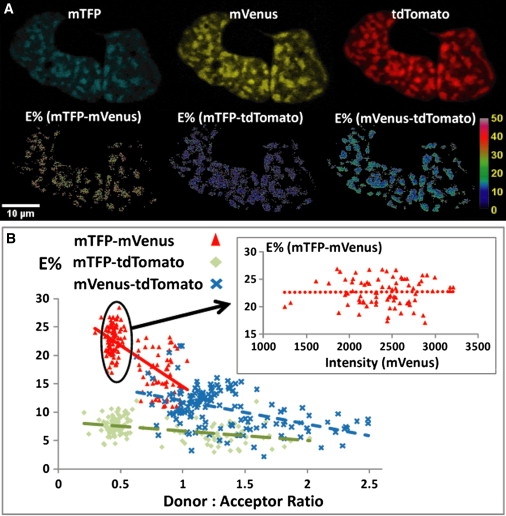
Demonstration of the homodimerization of C/EBPα and its interaction with HP1α in live-mouse pituitary GHFT1 cells by (3sFRET microscopy. (A) The unmixed images (I11, I22, and I33) show that C/EBPα (expressing mTFP or mVenus) and HP1α (expressing tdTomato) are co-localized in regions of centromeric heterochromatin, where the dimerization of C/EBPα (mTFP-mVenus) and its interaction with HP1α (mTFP-tdTomato and mVenus-tdTomato) are indicated by the E% (FRET efficiency percentage) images obtained in 3sFRET microscopy. (B) The mTFP-mVenus E% is negatively dependent (R = 0.69) on the donor (mTFP)/acceptor (mVenus) intensity ratios (triangles), where the mTFP intensity is determined from I11 plus both FRET12 and FRET13, and the mVenus intensity is determined from I22 plus FRET23. (Inset) In a narrow donor/acceptor ratio range (0.3∼0.5), the mTFP-mVenus E% is independent (R = 0.01) of the acceptor level. These data indicate that the dimerized CEBPα proteins form clusters in regions of centromeric heterochromatin. The mTFP-tdTomato (diamonds) and the mVenus-tdTomato (crosses) E%s are not strongly negatively dependent (mTFP, R = 0.41; mVenus, R = 0.47) on the donor (mTFP, mVenus)/acceptor (tdTomato) intensity ratios, indicating a more mixed cluster/random interaction. The tdTomato intensity is determined from I33. (Zeiss 510 Meta (Carl Zeiss Inc.), 63×/1.4 NA oil).
Conclusions and Outlook
From theory and modeling to practice, we described a simplified approach for three-color spectral FRET (3sFRET) microscopy, which was developed based on apparent FRET efficiency analysis to estimate relative spatial relationships between three spectrally distinct fluorophores. We evaluated this method using FRET-standard fusion proteins expressed in live cells. The 3sFRET approach was then applied to measure the interactions between proteins produced in living cells that were independently labeled with the three different FPs. The results confirmed our earlier FRET studies showing that 1), C/EBPα localized to heterochromatin as a dimer, and 2), C/EBPα interacted with HP1α in the chromocenters. These results support the view that HP1α functions to assemble macromolecular complexes in chromatin (44). It is important to note that the 3sFRET approach now allows additional experimentation not previously accessible. For example, heterodimer formation between C/EBP family members could be assessed in the context of the interactions with HP1α. In a similar way, mutations that influence dimer formation could also be examined simultaneously for their effect on the interactions with HP1α.
Our results demonstrate the utility of the 3sFRET microscopy method for characterizing energy transfers between the three fluorescent proteins in living cells, making this a promising technique for broad applications in cell biology and other life-science applications. The alternative approach to this 3sFRET microscopy method would be to use sequential application of existing two-color FRET microscopy imaging techniques, which is time consuming (i.e., F1-F2, F1-F3, F2-F3), and limiting where, for example, time-lapse studies or multiple focal sections are required, when each pair would have to be imaged sequentially. Here, only the three-fluorophore (F1-F2-F3) specimen is monitored over time in 3sFRET microscopy, providing also data for the same region of interest. The same data analysis used in 3sFRET microscopy can also be applied in other microscopy methods, such as wide-field microscopy or conventional confocal microscopy (see Section B in the Supporting Material). However, the optimization of the biological system to allow efficient and balanced expression of the three different labeled proteins might be a significant limitation to the three-color FRET approach. This is a general problem for FRET-based studies and varies depending on the biological system. We recognize that some systems may not be amenable to the three-color approach.
The 3sFRET microscopy can be extended to other suitable FPs, to fluorescent organic dyes as conjugates, or to antibody staining and quantum dots. Depending on the design of a three-fluorophore system, this method can be tailored to create the combination of one donor interacting simultaneously with two acceptors or one donor with two FPs where the intermediate FP acts as an acceptor for the first FP and, upon sensitization, becomes the donor for the third FP. Either situation would be suitable, for example, for signaling complexes, where multiple proteins assemble upon stimulation, which could be tracked in four dimensions. Furthermore, the relative distances established by 3sFRET between three labeled components, and their changes over time, could provide valuable insights into the dynamics of the interaction.
Acknowledgments
The authors thank Ms. Nicole Hays for technical support and Dr. Steven S. Vogel of the National Institutes of Health for critical reading of our manuscript and valuable suggestions.
This work was supported by National Institutes of Health grant DK47301 (R.N.D.) and by the W. M. Keck Center for Cellular Imaging (A.P.).
Supporting Material
References
- 1.Day R.N., Davidson M.W. The fluorescent protein palette: tools for cellular imaging. Chem. Soc. Rev. 2009;38:2887–2921. doi: 10.1039/b901966a. [DOI] [PMC free article] [PubMed] [Google Scholar]
- 2.Sekar R.B., Periasamy A. Fluorescence resonance energy transfer (FRET) microscopy imaging of live cell protein localizations. J. Cell Biol. 2003;160:629–633. doi: 10.1083/jcb.200210140. [DOI] [PMC free article] [PubMed] [Google Scholar]
- 3.Wallrabe H., Periasamy A. Imaging protein molecules using FRET and FLIM microscopy. Curr. Opin. Biotechnol. 2005;16:19–27. doi: 10.1016/j.copbio.2004.12.002. [DOI] [PubMed] [Google Scholar]
- 4.Vogel S.S., Thaler C., Koushik S.V. Fanciful FRET. Sci. STKE. 2006;2006:re2. doi: 10.1126/stke.3312006re2. [DOI] [PubMed] [Google Scholar]
- 5.Piston D.W., Kremers G.J. Fluorescent protein FRET: the good, the bad and the ugly. Trends Biochem. Sci. 2007;32:407–414. doi: 10.1016/j.tibs.2007.08.003. [DOI] [PubMed] [Google Scholar]
- 6.Trón L., Szöllósi J., Jovin T.M. Flow cytometric measurement of fluorescence resonance energy transfer on cell surfaces. Quantitative evaluation of the transfer efficiency on a cell-by-cell basis. Biophys. J. 1984;45:939–946. doi: 10.1016/S0006-3495(84)84240-X. [DOI] [PMC free article] [PubMed] [Google Scholar]
- 7.Mátyus L. Fluorescence resonance energy transfer measurements on cell surfaces. A spectroscopic tool for determining protein interactions. J. Photochem. Photobiol. B. 1992;12:323–337. doi: 10.1016/1011-1344(92)85039-w. [DOI] [PubMed] [Google Scholar]
- 8.Nagy P., Vámosi G., Szöllösi J. Intensity-based energy transfer measurements in digital imaging microscopy. Eur. Biophys. J. 1998;27:377–389. doi: 10.1007/s002490050145. [DOI] [PubMed] [Google Scholar]
- 9.Gordon G.W., Berry G., Herman B. Quantitative fluorescence resonance energy transfer measurements using fluorescence microscopy. Biophys. J. 1998;74:2702–2713. doi: 10.1016/S0006-3495(98)77976-7. [DOI] [PMC free article] [PubMed] [Google Scholar]
- 10.Sorkin A., McClure M., Carter R. Interaction of EGF receptor and grb2 in living cells visualized by fluorescence resonance energy transfer (FRET) microscopy. Curr. Biol. 2000;10:1395–1398. doi: 10.1016/s0960-9822(00)00785-5. [DOI] [PubMed] [Google Scholar]
- 11.Kraynov V.S., Chamberlain C., Hahn K.M. Localized Rac activation dynamics visualized in living cells. Science. 2000;290:333–337. doi: 10.1126/science.290.5490.333. [DOI] [PubMed] [Google Scholar]
- 12.Xia Z., Liu Y. Reliable and global measurement of fluorescence resonance energy transfer using fluorescence microscopes. Biophys. J. 2001;81:2395–2402. doi: 10.1016/S0006-3495(01)75886-9. [DOI] [PMC free article] [PubMed] [Google Scholar]
- 13.Hoppe A., Christensen K., Swanson J.A. Fluorescence resonance energy transfer-based stoichiometry in living cells. Biophys. J. 2002;83:3652–3664. doi: 10.1016/S0006-3495(02)75365-4. [DOI] [PMC free article] [PubMed] [Google Scholar]
- 14.Elangovan M., Wallrabe H., Periasamy A. Characterization of one- and two-photon excitation fluorescence resonance energy transfer microscopy. Methods. 2003;29:58–73. doi: 10.1016/s1046-2023(02)00283-9. [DOI] [PubMed] [Google Scholar]
- 15.Wallrabe H., Elangovan M., Barroso M. Confocal FRET microscopy to measure clustering of ligand-receptor complexes in endocytic membranes. Biophys. J. 2003;85:559–571. doi: 10.1016/S0006-3495(03)74500-7. [DOI] [PMC free article] [PubMed] [Google Scholar]
- 16.Zal T., Gascoigne N.R. Photobleaching-corrected FRET efficiency imaging of live cells. Biophys. J. 2004;86:3923–3939. doi: 10.1529/biophysj.103.022087. [DOI] [PMC free article] [PubMed] [Google Scholar]
- 17.van Rheenen J., Langeslag M., Jalink K. Correcting confocal acquisition to optimize imaging of fluorescence resonance energy transfer by sensitized emission. Biophys. J. 2004;86:2517–2529. doi: 10.1016/S0006-3495(04)74307-6. [DOI] [PMC free article] [PubMed] [Google Scholar]
- 18.Chen Y., Elangovan M., Periasamy A. FRET data analysis—the algorithm. In: Periasamy A., Day R.N., editors. Molecular Imaging: FRET Microscopy and Spectroscopy. Oxford University Press; New York: 2005. pp. 126–145. [Google Scholar]
- 19.Chen H., Puhl H.L., 3rd, Ikeda S.R. Measurement of FRET efficiency and ratio of donor to acceptor concentration in living cells. Biophys. J. 2006;91:L39–L41. doi: 10.1529/biophysj.106.088773. [DOI] [PMC free article] [PubMed] [Google Scholar]
- 20.Chen Y., Periasamy A. Intensity range based quantitative FRET data analysis to localize protein molecules in live cell nuclei. J. Fluoresc. 2006;16:95–104. doi: 10.1007/s10895-005-0024-1. [DOI] [PubMed] [Google Scholar]
- 21.Chen Y., Mauldin J.P., Periasamy A. Characterization of spectral FRET imaging microscopy for monitoring nuclear protein interactions. J. Microsc. 2007;228:139–152. doi: 10.1111/j.1365-2818.2007.01838.x. [DOI] [PMC free article] [PubMed] [Google Scholar]
- 22.Megías D., Marrero R., Montoya M.C. Novel λ FRET spectral confocal microscopy imaging method. Microsc. Res. Tech. 2009;72:1–11. doi: 10.1002/jemt.20633. [DOI] [PubMed] [Google Scholar]
- 23.Ramirez-Carrozzi V.R., Kerppola T.K. Dynamics of Fos-Jun-NFAT1 complexes. Proc. Natl. Acad. Sci. USA. 2001;98:4893–4898. doi: 10.1073/pnas.091095998. [DOI] [PMC free article] [PubMed] [Google Scholar]
- 24.Liu J., Lu Y. FRET study of a trifluorophore-labeled DNAzyme. J. Am. Chem. Soc. 2002;124:15208–15216. doi: 10.1021/ja027647z. [DOI] [PubMed] [Google Scholar]
- 25.Watrob H.M., Pan C.P., Barkley M.D. Two-step FRET as a structural tool. J. Am. Chem. Soc. 2003;125:7336–7343. doi: 10.1021/ja034564p. [DOI] [PubMed] [Google Scholar]
- 26.Haustein E., Jahnz M., Schwille P. Triple FRET: a tool for studying long-range molecular interactions. ChemPhysChem. 2003;4:745–748. doi: 10.1002/cphc.200200634. [DOI] [PubMed] [Google Scholar]
- 27.Heinze K.G., Jahnz M., Schwille P. Triple-color coincidence analysis: one step further in following higher order molecular complex formation. Biophys. J. 2004;86:506–516. doi: 10.1016/S0006-3495(04)74129-6. [DOI] [PMC free article] [PubMed] [Google Scholar]
- 28.Aneja A., Mathur N., Mathur P.C. Triple-FRET technique for energy transfer between conjugated polymer and TAMRA dye with possible applications in medical diagnostics. J. Biol. Phys. 2008;34:487–493. doi: 10.1007/s10867-008-9107-y. [DOI] [PMC free article] [PubMed] [Google Scholar]
- 29.Klostermeier D., Sears P., Williamson J.R. A three-fluorophore FRET assay for high-throughput screening of small-molecule inhibitors of ribosome assembly. Nucleic Acids Res. 2004;32:2707–2715. doi: 10.1093/nar/gkh588. [DOI] [PMC free article] [PubMed] [Google Scholar]
- 30.Heilemann M., Tinnefeld P., Sauer M. Multistep energy transfer in single molecular photonic wires. J. Am. Chem. Soc. 2004;126:6514–6515. doi: 10.1021/ja049351u. [DOI] [PubMed] [Google Scholar]
- 31.Hohng S., Joo C., Ha T. Single-molecule three-color FRET. Biophys. J. 2004;87:1328–1337. doi: 10.1529/biophysj.104.043935. [DOI] [PMC free article] [PubMed] [Google Scholar]
- 32.Clamme J.P., Deniz A.A. Three-color single-molecule fluorescence resonance energy transfer. ChemPhysChem. 2005;6:74–77. doi: 10.1002/cphc.200400261. [DOI] [PubMed] [Google Scholar]
- 33.Lee N.K., Kapanidis A.N., Weiss S. Three-color alternating-laser excitation of single molecules: monitoring multiple interactions and distances. Biophys. J. 2007;92:303–312. doi: 10.1529/biophysj.106.093211. [DOI] [PMC free article] [PubMed] [Google Scholar]
- 34.Galperin E., Verkhusha V.V., Sorkin A. Three-chromophore FRET microscopy to analyze multiprotein interactions in living cells. Nat. Methods. 2004;1:209–217. doi: 10.1038/nmeth720. [DOI] [PubMed] [Google Scholar]
- 35.Förster T. Delocalized excitation and excitation transfer. In: Sinanoglu O., editor. Modern Quantum Chemistry. Academic Press; 1965. pp. 93–137. [Google Scholar]
- 36.Clegg R.M. Fluorescence resonance energy transfer. In: Wang X.F., Herman B., editors. Fluorescence Imaging Spectroscopy and Microscopy. John Wiley & Sons; New York: 1996. pp. 179–251. [Google Scholar]
- 37.Zimmermann T., Rietdorf J., Pepperkok R. Spectral imaging and linear un-mixing enables improved FRET efficiency with a novel GFP2-YFP FRET pair. FEBS Lett. 2002;531:245–249. doi: 10.1016/s0014-5793(02)03508-1. [DOI] [PubMed] [Google Scholar]
- 38.Koushik S.V., Blank P.S., Vogel S.S. Anomalous surplus energy transfer observed with multiple FRET acceptors. PLoS ONE. 2009;4:e8031. doi: 10.1371/journal.pone.0008031. [DOI] [PMC free article] [PubMed] [Google Scholar]
- 39.Tang Q.Q., Lane M.D. Role of C/EBP homologous protein (CHOP-10) in the programmed activation of CCAAT/enhancer-binding protein-β during adipogenesis. Proc. Natl. Acad. Sci. USA. 2000;97:12446–12450. doi: 10.1073/pnas.220425597. [DOI] [PMC free article] [PubMed] [Google Scholar]
- 40.Liu W., Enwright J.F., 3rd, Schaufele F. CCAAT/enhancer binding protein α uses distinct domains to prolong pituitary cells in the growth 1 and DNA synthesis phases of the cell cycle. BMC Cell Biol. 2002;3:6. doi: 10.1186/1471-2121-3-6. [DOI] [PMC free article] [PubMed] [Google Scholar]
- 41.Tang Q.Q., Lane M.D. Activation and centromeric localization of CCAAT/enhancer-binding proteins during the mitotic clonal expansion of adipocyte differentiation. Genes Dev. 1999;13:2231–2241. doi: 10.1101/gad.13.17.2231. [DOI] [PMC free article] [PubMed] [Google Scholar]
- 42.Day R.N., Periasamy A., Schaufele F. Fluorescence resonance energy transfer microscopy of localized protein interactions in the living cell nucleus. Methods. 2001;25:4–18. doi: 10.1006/meth.2001.1211. [DOI] [PubMed] [Google Scholar]
- 43.Demarco I.A., Periasamy A., Day R.N. Monitoring dynamic protein interactions with photoquenching FRET. Nat. Methods. 2006;3:519–524. doi: 10.1038/nmeth889. [DOI] [PMC free article] [PubMed] [Google Scholar]
- 44.Maison C., Almouzni G. HP1 and the dynamics of heterochromatin maintenance. Nat. Rev. Mol. Cell Biol. 2004;5:296–304. doi: 10.1038/nrm1355. [DOI] [PubMed] [Google Scholar]
Associated Data
This section collects any data citations, data availability statements, or supplementary materials included in this article.