

Abstract
The central nervous system regulates peripheral immune responses via the vagus nerve, the primary neural component of the cholinergic anti-inflammatory pathway. Electrical stimulation of the vagus nerve suppresses pro-inflammatory cytokine release in response to endotoxin, I/R injury, and hypovolemic shock and protects against lethal hypotension. To determine the effect of vagus nerve stimulation on coagulation pathways, anesthetized pigs were subjected to partial ear resection before and after electrical vagus nerve stimulation. We observed that electrical vagus nerve stimulation significantly decreased bleeding time (pre–electrical vagus nerve stimulation = 1033 ± 210 s versus post–electrical vagus nerve stimulation = 585 ± 111 s; P < 0.05) and total blood loss (pre–electrical vagus nerve stimulation = 48.4 ± 6.8 mL versus post–electrical vagus nerve stimulation = 26.3 ± 6.7 mL; P < 0.05). Reduced bleeding time after vagus nerve stimulation was independent of changes in heart rate or blood pressure and correlated with increased thrombin/antithrombin III complex generation in shed blood. These data indicate that electrical stimulation of the vagus nerve attenuates peripheral hemorrhage in a porcine model of soft tissue injury and that this protective effect is associated with increased coagulation factor activity.
Keywords: Inflammatory reflex, hemorrhage, thrombin-antithrombin complex, α7 nAChR, hemostasis
INTRODUCTION
Injury, infection, and ischemia activate cells of the innate immune system, which releases proinflammatory cytokines, such as TNF and HMGB1, to activate specific immune responses and enhance wound healing and pathogen clearance. Mammals have evolved multiple, redundant mechanisms to confine and control innate immunity and cytokine release, because cytokine production can damage tissues in arthritis, inflammatory bowel disease, septic shock, and severe sepsis. A recent discovery revealed that the central nervous system regulates peripheral inflammation by action potentials transmitted in the vagus nerve, which provides a controlling signal over innate immunity. The “cholinergic anti-inflammatory pathway,” the motor arm of an inflammatory reflex, is composed of the vagus nerve and signal transduction in the innate immune system that requires the α7 nicotinic acetylcholine receptor subunit. The cholinergic anti-inflammatory pathway nominally controls cytokine release in real time, but it can also be activated with electrodes that stimulate the vagus nerve. This confers significant therapeutic advantage to animals with endotoxemia, sepsis, pancreatitis, and hypovolemic shock (1–4).
During traumatic injury, bleeding activates coagulation pathways, a cascade of serine proteases that culminates in the cleaving of prothrombin to thrombin; this in turn generates fibrin, the main constituent of a thrombus. Thrombin generation occurs in two phases: the reaction time (“r time”) is characterized by the appearance of nanomolar amounts of thrombin generated at a relatively low rate (5–7); to clot formation time (“k time”) is characterized by the generation of thrombin at a high rate, the full activation of platelets, and formation of a solid thrombus (5–9). Multiple mechanisms have evolved to confine and control activation of coagulation, because dysregulation is associated with bleeding (e.g., hemophilia) or excessive clotting (e.g., diffuse intravascular coagulation). Tissue factor pathway inhibitor is the dominant negative regulator of clotting time (10), whereas antithrombin III primarily inhibits clot formation time (11–19).
During the course of studying the effects of vagus nerve stimulation (VNS) on innate immunity in animals with injury, we unexpectedly observed that VNS significantly slowed hemorrhage. Accordingly, here we report the results of studying the influence of VNS on peripheral hemorrhage in pigs subjected to ear resection. Vagus nerve stimulation shortened bleeding time and increased local generation of thrombin/antithrombin III (TAT) complexes.
MATERIALS AND METHODS
Animals
Piglets of both sexes (25–30 kg) were acquired from a local farm and allowed free access to food and water before the experiment. All animal experiments were performed in accordance with the National Institutes of Health guidelines under protocols approved by the Institutional Animal Care and Use Committee of the city of Vienna.
Vagus nerve stimulation
Pigs of both sexes (2–5 months of age; 25–30 kg) were anesthetized with azaperone (280 mg i.m., Stresnil; Jannsen-Cilag, Vienna, Austria), ketamine hydrochloride (10 mg/kg i.m., Ketavet; Pharmacia & Upjohn, Freiburg, Germany), and diazepam (10 mg i.m., Gewacalm; Nycomed, Linz, Austria). Thiopental-sodium (100–400 mg; Biochemie, Vienna, Austria) was administered through punctured ear veins to maintain anesthesia, as required. Tracheas were intubated, and ventilation started at a tidal volume of 10 mL/kg, a respiratory rate of 22 breaths/min, and a positive end-expiratory pressure level of 2 to 3 cm H2O. Isoflurane (0.8%) was added to the inspiratory gas (O2, 100%) to maintain anesthesia. Polyethylene catheters were placed in the right femoral vein and right femoral artery. A 14F silastic catheter was inserted suprapubically into the urinary bladder. After achieving i.v. access, anesthesia was maintained by continuous infusion of midazolam and sufentanil. To ensure adequate fluid resuscitation, Ringer’s lactate solution was infused continuously via the femoral vein. Body temperature was measured with a rectal thermistor and maintained at 38°C to 39°C by using a heat blanket. Access to the left cervical vagus nerve was gained through a standard carotid artery cut-down. The vagus nerve was dissected away from the carotid sheath and lifted slightly with bipolar stimulating electrodes. Electrical stimulation (3.5 mA, 5 Hz, 30 s) was applied every 5 min for 30 min (total of seven stimulations). In sham-stimulated animals, the vagus nerve was exposed but not isolated from the carotid sheath or stimulated.
Partial ear resection
Each ear was warmed to 38°C ± 0.5°C with a heat lamp for 10 min before resection; ear temperature was monitored using a noncontact infrared thermometer. A section 3 cm wide and 1.5 cm long was marked with an indelible marker and then amputated with a no. 11 scalpel. Blood was allowed to flow freely from the wound site and was collected in a graduated cylinder to measure total blood loss. Volume of blood shed was recorded every minute until bleeding stopped. Bleeding time was measured with a timer; bleeding was defined as having stopped when time between drops exceeded 20 s.
Hematological analyses
Blood from the femoral artery catheter and the wound site was collected and analyzed for bleeding time; total shed-blood volume; blood cell counts; clotting activity by thromboelastography, whole-blood coagulation, and platelet aggregation; and TAT complex formation, as described below. Blood collected from the wound site was allowed to drip freely into a graduated cylinder; 1-mL microcentrifuge tubes were placed between the wound and the graduated cylinder to collect aliquots for the analyses below.
Thromboelastography
Citrated blood was collected from the femoral artery catheter. One-milliliter aliquots in plastic cuvettes were recalcified with 20μL of 0.2 M CaCl2 (NATEM solution) and analyzed by rotational thromboelastography (RoTEG; Dynabyte Medical, Munich, Germany). Reaction time (r time), coagulation time (k time), and maximum clot firmness (maximum amplitude [MA]) were recorded. Native blood was collected from the wound site, and the same end points were analyzed without recalcification.
Platelet aggregation
Citrated blood was collected from the femoral artery catheter in 1-mL aliquots and activated with 80 μg collagen and analyzed by Multiplate (Dynabyte Medical). Platelet aggregation velocity (arbitrary unit [AU]/min), total platelet aggregation (AU), and area under the curve (AUC; AU · min) were recorded.
TAT complex enzyme-linked immunosorbent assay
EDTA blood was collected from the femoral artery catheter or directly from the wound site in 1-mL aliquots. Thrombin/antithrombin complex enzyme-linked immunosorbent assays (ELISAs) were performed and calibrated with included standards, according to the manufacturer’s instructions (Enzygnost TATmicro; Dade Behring, Marburg GmbH, Marburg, Germany).
Cell counts and other hematological end points
Citrated blood was collected from the femoral artery catheter or directly from the wound site in 1-mL aliquots. White blood cell (WBC) counts, red blood cell (RBC) counts, platelet counts, and hematocrit were analyzed using a Cell-Dyn 1300 (Abbott Diagnostics, Vienna, Austria).
Data analysis
Data are presented as mean ± SEM, unless indicated otherwise. For all statistical analyses, P < 0.05 was considered significant. Ear laterality was not a factor in the design of the experiment; therefore, laterality was not included as a factor in the analyses.
Repeated-measures ANOVA
The analyses were performed separately on the two end points of TAT complex levels at 3 min after wounding and at 6 min after wounding. A mixed-models approach to repeated-measures analysis of variance, where the one “between” factor was the grouping factor of VNS or sham stimulation, and the one “within” or repeated factor was time, i.e., prestimulation or poststimulation. The results on the untransformed data were not qualitatively different from the transformed data, so for simplicity, the results are displayed in their original units.
t Test
Analyses were performed on the end point of bleeding time and shed-blood volume using the two-tailed, homoscedastic t test.
Correlation between bleeding time and TAT6
The percent change from the “PreStim” or “PreSham” period to the “PostStim” or “PostSham” period was created for the end points of bleeding time and TAT concentration in blood shed from the wound. The relationship between bleeding time and TAT concentration (in terms of percent change from before stimulation to after) was explored with the Pearson correlation coefficient (the Spearman correlation, a nonparametric counterpart to the Pearson correlation, was also computed and found to be qualitatively the same as the Pearson). A Fisher z transformation was performed to compare the two correlations.
RESULTS
Electrical VNS does not affect heart rate, blood pressure, or body temperature
Blood pressure, heart rate, body temperature, hematocrit, RBC counts, WBC counts, and platelet counts were measured throughout the protocol. Table 1 lists these parameters in both sham-stimulated and vagus nerve–stimulated animals (n = 6–8/group), at baseline (before surgery) and at the time of the second ear resection (PostStim). No significant changes were observed in heart rate, MAP, or body temperature. Blood collected from an indwelling femoral artery catheter was analyzed for WBC count, RBC count, hematocrit, and platelet count. In animals that received a sham VNS procedure, RBC count (pre–sham stimulation = 4.50 ± 0.10 m/μL versus post–sham stimulation = 3.65 ± 0.07 m/μL; P < 0.05) and hematocrit (pre–sham stimulation = 25.75% ± 0.72% versus post–sham stimulation = 20.84% ± 0.40%; P < 0.05) decreased significantly as compared with pre–sham stimulation measurements. In animals that received electrical VNS, RBC counts (prestimulation = 4.50 ± 0.10 m/μL versus post–sham stimulation = 4.08 ± 0.17 m/μL; P < 0.05), but not hematocrit, were reduced significantly. Comparisons between post–sham VNS measures with post–electrical VNS measures indicated that RBC count (post–sham stimulation = 3.65 ± 0.07 m/μL versus postelectrical stimulation = 4.08 ± 0.14 m/μL; P < 0.05) and hematocrit (post–sham stimulation = 20.84% ± 0.40% versus postelectrical stimulation = 23.02% ± 1.00%; P = 0.05) were significantly different as compared with animals that received sham VNS.
Table 1.
Systemic responses to VNS
| Endpoint | Prestimulation |
Sham |
VNS |
P vs. sham | ||||||
|---|---|---|---|---|---|---|---|---|---|---|
| Average | ±SE | Average | ±SE | P | Average | ±SE | P | |||
| Hemodynamics | MAP, mmHg | 87 | 2 | 80 | 3 | 0.06 | 87 | 3 | 0.90 | 0.18 |
| Heart rate, beats/min | 104 | 6 | 110 | 7 | 0.53 | 103 | 9 | 0.97 | 0.55 | |
| Body temperature, °C | 37.8 | 0.1 | 37.9 | 0.1 | 0.55 | 37.9 | 0.2 | 0.56 | 0.93 | |
| Cell counts | WBC, ×103/μL | 15.3 | 0.9 | 12.9 | 1.2 | 0.14 | 12.5 | 1.1 | 0.13 | 0.84 |
| RBC, ×106/μL | 4.5 | 0.1 | 3.7 | 0.1 | 0.00 | 4.1 | 0.1 | 0.04 | 0.02 | |
| Hematocrit, % | 25.8 | 0.7 | 20.8 | 0.4 | 0.00 | 23.0 | 1.0 | 0.07 | 0.05 | |
| Platelet count, ×103/μL | 344.9 | 24.6 | 292.7 | 32.6 | 0.22 | 290.0 | 13.2 | 0.22 | 0.95 | |
Electrical VNS attenuates bleeding time
We developed a porcine model of soft tissue injury in which anesthetized pigs were subjected to partial ear resection. To determine the effects of VNS on bleeding time, anesthetized animals (n = 6–8/group) were subjected to partial ear resection. Bleeding began as steady streams of blood and slowed to a drip over time. Bleeding was defined as “stopped” when the time between blood drops exceeded 20 s. Nerve stimulated animals were then subjected to left cervical VNS (3.5 mA, 5 Hz, 0.5-ms pulse width) for 30 s every 5 min for 30 min, for a total of seven stimulation periods. Control animals received sham stimulation, in which the cervical vagus was exposed but not stimulated. Ten minutes after VNS (or sham stimulation), the contralateral ear was subjected to a similar resection technique, and total bleeding time recorded. Vagus nerve stimulation significantly reduced bleeding time by 40% compared with bleeding after the first wounding event (P < 0.05) (Fig. 1). No significant differences in bleeding time were observed after sham stimulation as compared with bleeding time before stimulation (bleeding time was reduced by <7% compared with bleeding after the first wounding event) (Fig. 1).
Fig. 1. Anesthetized pigs (n = 6–8/group) were subjected to a partial right ear resection.

Bleeding began as steady streams of blood and slowed to a drip over time. Bleeding was defined as having ceased when time between drops exceeded 20 s. Animals were then subjected to left cervical VNS or sham stimulation, in which the cervical vagus was exposed but not stimulated; 10 min after VNS (or sham stimulation), the left ear was subjected to the same partial resection model, and total bleeding time recorded. Bleeding time was recorded in minutes and is presented as percentage of baseline (prestimulation bleeding time) ± SEM. Student t test was used to compare the vagus nerve–stimulated group (PostVNS) or the sham-stimulated group (PostSham) to the unstimulated control (PreStim) (*P < 0.05).
Electrical VNS decreases shed-blood volume
To determine the effects of VNS on the volume of blood shed from the wound site, anesthetized animals (n = 6–8/group) were subjected to partial ear resection as described above. Blood was allowed to flow freely from the wound into graduated cylinders to measure total blood shed volume. Animals were then subjected to VNS or a sham stimulation procedure, as described above. Ten minutes after VNS (or sham stimulation), the contralateral ear was subjected to partial resection technique, and total shed blood collected and measured. The volume of blood shed from the wound was significantly reduced by VNS (Fig. 2; pre-VNS total shed-blood volume = 48.4 ± 6.8 mL versus post-VNS total shed-blood volume = 26.4 ± 6.7 mL; P < 0.05). The total volume of blood shed from the wound was not significantly different after sham stimulation procedures, in which the vagus nerve was visualized but not manipulated, as compared with pre–sham stimulation shed-blood volume (data not shown). Moreover, the rate of blood loss was significantly decreased in animals receiving VNS (Fig. 3).
Fig. 2. Blood shed from the wounds was collected in graduated cylinders and measured in milliliters.

Values are presented as percentage of baseline (prestimulation bleeding time) ± SEM. Student t test was used to compare the vagus nerve–stimulated group (PostVNS) to the unstimulated control (PreStim) (*P < 0.05).
Fig. 3. Electrical VNS reduces rate of blood loss.

The volume of blood shed from wounds inflicted after VNS (black squares) or sham stimulation (hollow diamonds) was measured in graduated cylinders every minute and plotted against time. Values are presented as the quantity of blood shed (in milliliters) per minute after wounding ± SEM. Student t test was used to compare the vagus nerve–stimulated group (vns) to the unstimulated control (sham) at each time point (*P < 0.05).
VNS reduces clot formation time in circulating blood
Blood was collected from an indwelling femoral artery catheter and analyzed for whole-blood coagulation activity as assessed by rotational thromboelastography (RoTEG), platelet aggregation activity as assessed by the Multiplate analyzer, and thombin/antithrombin (TAT) complex levels as assessed by ELISA. RoTEG analyses of circulating blood measured the r value (a measure of the time required to initiate clot formation, also known as reaction time, which is dependent on the activity of coagulation factors); the k value (a measure of the speed with which a clot is formed, also known as clot formation time, which is in part dependent on generation of thrombin); as well as the MA, a measure of the strength of the clot. Platelet aggregation activity was measured as the AUC, a reflection of overall platelet activity; aggregation (maximum height of curve, in AU) and velocity of aggregation (maximum slope of the curve) are also reported. TAT complex ELISA was used to measure generation of thrombin. Table 2 lists the results of these analyses in circulating blood before VNS (or sham stimulation) and the results in circulating blood after VNS or sham stimulation (n = 6–8/group). In animals that received a sham VNS procedure, platelet aggregation decreased significantly, as compared with pre–sham stimulation samples (pre–sham stimulation = 55.22 ± 3.84 AU versus post–sham stimulation = 42.46 ± 3.66 AU; P = 0.05). Platelet aggregation measures were not significantly affected in animals receiving electrical VNS, but RoTEG analyses indicated that reaction (r) time of circulating blood was significantly reduced as compared with prestimulation measures (prestimulation = 473 ± 14 s versus poststimulation = 417 ± 21 s; P < 0.05).
Table 2.
Systemic coagulation responses to VNS
| Endpoint | Prestimulation |
Sham |
VNS |
||||||
|---|---|---|---|---|---|---|---|---|---|
| Average | ±SE | Average | ±SE | P | Average | ±SE | P | ||
| RoTEG | r Time, s | 473 | 14 | 429 | 26 | 0.12 | 417 | 22 | 0.04 |
| k Time, s | 135 | 8 | 136 | 10 | 0.93 | 133 | 11 | 0.90 | |
| MA, mm | 64 | 1 | 63 | 1 | 0.64 | 63 | 3 | 0.73 | |
| Platelet activity | Aggregation | 55.2 | 3.8 | 42.5 | 3.7 | 0.05 | 42.6 | 5.5 | 0.09 |
| Velocity | 10.62 | 0.70 | 8.21 | 1.02 | 0.07 | 8.18 | 0.98 | 0.07 | |
| AUC | 344.38 | 25.67 | 263.00 | 24.21 | 0.06 | 260.33 | 35.37 | 0.09 | |
| TAT complex | TAT, μg/mL | 10.2 | 2.3 | 14.0 | 0.6 | 0.24 | 13.8 | 1.3 | 0.35 |
VNS increases coagulation activity of shed blood
To determine the effects of VNS on coagulation activity in blood shed from the wound site, shed blood was collected in 1-mL aliquots at 3-min intervals, and TAT complex levels assessed by ELISA, whole-blood coagulation activity assessed by RoTEG, and platelet count assessed by the Cell-Dyn 1300 blood analysis system. Animals were then subjected to left cervical VNS or a sham stimulation procedure as described above. Ten minutes after VNS (or sham stimulation), the contralateral ear was subjected to the same partial resection technique, and the same end points measured. Enzyme-linked immunosorbent assay analysis of shed blood (n = 6/group) revealed that VNS significantly increased the concentration of TAT complex levels in shed blood 3 min after wounding (Fig. 4A; pre-VNS TAT complex concentration = 41.9 ± 8.3 μg/mL versus post-VNS TAT complex concentration = 93.5 ± 21.8 ng/mL; P < 0.05), whereas sham stimulation procedures, in which the vagus nerve was visualized but not manipulated, had no significant effect (data not shown). At 6 min after wounding, TAT complex levels are increased to a greater degree after VNS as compared with animals that received a sham stimulation procedure, although the effect is not statistically significant (Fig. 4B; pre-VNS TAT complex concentration = 135.6 ± 51.7 ng/mL versus post-VNS TAT complex concentration = 209.4 ± 73.9 ng/mL; P > 0.05). There were no significant changes in TAT complex concentrations in blood shed from the wounds of sham-stimulated animals at 6 min after wounding (data not shown). Table 3 lists platelet counts and RoTEG results in shed blood from both sham-stimulated and vagus nerve–stimulated animals (n = 6/group), at the time of the first ear resection (PreStim) and at the time of the second ear resection (PostStim); no statistically significant changes were observed in blood shed from the wound site. Data presented for these end points are for the 3-min postwounding collection only, as the blood flow rate from wounds after VNS was too low to allow reproducible measures. Notably, blood flow from the wounds of animals receiving sham stimulation sustained sufficient flow rates to perform RoTEG analyses and obtain platelet counts at 6 min and in some animals 9 min after resection (data not shown).
Fig. 4. A and B, Electrical VNS increases TAT complex levels in shed blood.

Shed blood was collected in 1-mL aliquots (n = 6/group) at 3 min (A) and 6 min (B) after ear resection and before and after VNS and assayed for TAT complex levels by ELISA. TAT complex levels are presented as percentage of baseline (first white bar) in shed blood after electrical VNS (black bar) or sham stimulation (second white bar), as compared with prestimulation TAT complex concentrations. Values are presented as percentage of baseline ± SEM. Repeated-measures ANOVA was used to compare the vagus nerve–stimulated group (PostVNS) to the unstimulated control (PreStim) (*P = 0.05).
Table 3.
Local coagulation responses to VNS
| Baseline |
Sham |
Poststimulation |
||||||
|---|---|---|---|---|---|---|---|---|
| Average | ±SE | Average | ±SE | P vs. baseline | Average | ±SE | P vs. baseline | |
| Platelets×103/μL | 337.7 | 45.6 | 322.0 | 57.4 | 0.82 | 292.0 | 18.1 | 0.57 |
| RoTEG k time, s | 517 | 89 | 387 | 44 | 0.21 | 397 | 105 | 0.46 |
| RoTEG r time, s | 166 | 29 | 155 | 7 | 0.72 | 130 | 11 | 0.47 |
| RoTEG MA, mm | 70 | 3 | 70 | 1 | 1.00 | 72 | 2 | 0.65 |
Changes in bleeding time after electrical VNS correlate with changes in TAT complex levels in shed blood
To determine whether changes in bleeding time after electrical VNS correlate with changes in coagulation activity in blood shed from the wound, both end points (bleeding time and TAT complex levels in shed blood) were expressed as percentage change by comparing prestimulation data with poststimulation data from animals subjected to electrical VNS or the sham VNS procedure. There was a strong positive correlation between changes in bleeding time and changes in TAT complex levels in blood shed from animals subjected to sham stimulation (Fig. 5; Pearson = +0.836; R2 = 0.6989). In contrast, there were strong negative correlation changes in bleeding time and changes in TAT complex levels in blood shed from animals subjected to electrical VNS (Pearson = −0.919; R2 = 0.8447). The Fisher z transformation revealed that the two correlations are significantly different (P < 0.001).
Fig. 5. Changes in bleeding time correlate with increases in TAT complex levels in shed blood after electrical VNS.
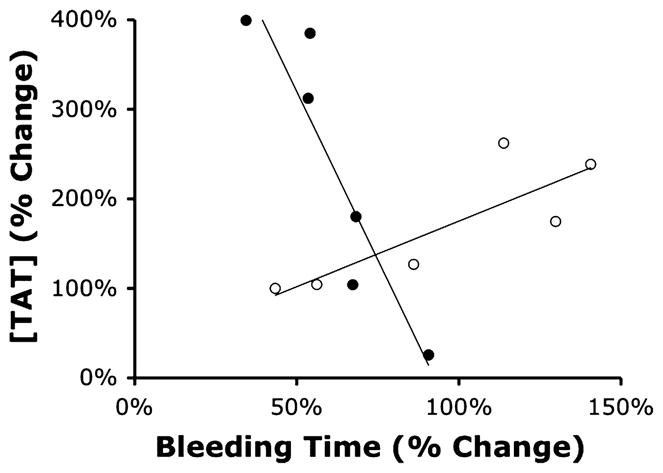
Changes in TAT complex levels in shed blood were plotted against change in bleeding time. Open circles represent data from sham-stimulated animals; filled circles indicate data from animals that received electrical VNS. Pearson correlation coefficient was computed to determine the relationship between bleeding time and TAT complex levels in the vagus nerve–stimulated group (black circles) or the sham-stimulated group (white circles). Fisher z transformation revealed the two correlations are significantly different (P < 0.001).
DISCUSSION
Data presented here indicate that electrical VNS regulates hemostasis, attenuates peripheral hemorrhage, and reduces shed-blood volume in pigs. The effects of VNS on bleeding time are independent of effects on heart rate or blood pressure, suggesting that vagus nerve activity modulates the coagulation activity of blood.
Prothrombin is produced in liver and released into the systemic circulation constitutively as a protoenzyme. At the site of vascular injury, activated factor X cleaves prothrombin on the surface of platelets to release activated thrombin, which accelerates the generation of fibrin and clot deposition (20). Antithrombin is a constitutively produced thrombin inhibitor, which maintains an anticoagulant state by binding activated thrombin as it diffuses from the site of vascular injury (21, 22). Measurement of TAT complex levels is an indirect but sensitive and widely accepted measure of thrombin generation. Here, VNS failed to significantly alter TAT complex levels in the circulation at any time point in the study, but VNS significantly increased the level of TAT complex found in blood shed from the wound site, as compared with blood shed from the contralateral wound before VNS. No significant increase in TAT complex levels was observed in shed blood after a sham stimulation procedure. The change in bleeding time induced by VNS correlated with changes in TAT complex levels in shed blood, suggesting that increased thrombin formation contributed to the observed reduction in bleeding time. The observation that VNS increased TAT complex formation specifically in shed blood, but not in the systemic circulation, suggests that efferent vagus nerve activity directly or indirectly modulates thrombin activity at the site of injury. Reduced blood flow rate across the wound, as observed in animals subjected to VNS, may have increased TAT concentration in shed blood. Further studies will address mechanisms of control of local TAT production rates.
Platelet aggregation and RoTEG assays were used to assess the effect of VNS on blood coagulation activity. In the RoTEG data presented here, r time, or the reaction time to initiate clot formation; k time, or the coagulation time; and MA, or the maximum viscosity of the clot were measured in both the general circulation and in shed blood, before and after sham or electrical VNS. Reduced platelet aggregation in the circulation was observed in both groups, but reached statistical significance (P < 0.05) only in the sham group; k time and MA in circulating blood were not significantly changed by VNS, but r time was significantly shortened after VNS. RoTEG analyses of shed blood revealed no statistically significant changes in clotting activity after either sham or VNS. Although VNS modulates r time, the mechanism of this effect has yet to be defined.
Previous studies have shown that electrical or pharmacological stimulation of the cholinergic anti-inflammatory pathway significantly protects rodents against the pathological sequelae of hypovolemic shock and improves survival (23). The model of peripheral hemorrhage described here does not induce hemorrhagic shock; less than 1% of total blood volume was shed. The peripheral injuries induced in our model are potentially controllable through more conventional methods, such as direct compression or application of a tourniquet. Whether VNS can be used for noncompressible hemorrhage, such as internal (organ) hemorrhage, has yet to be determined, and it should be interesting to study the effects of stimulating other nerves. Extrapolation of these findings to clinical trauma is further complicated by thermoregulation and anesthesia. In our studies, the temperature of the skin at the wound site was regulated to minimize the potential effect of thermoregulatory responses on vasodilatory status, bleeding time, and volume of blood shed. In addition, these studies were conducted in the presence of general anesthesia, which has the potential to alter neurologic and coagulation responses to injury.
Implanted vagus nerve stimulators are used in humans for the treatment of epilepsy and depression that are refractory to other means of treatment (24, 25), an approach that would be impractical for an acute injury. To our knowledge, coagulation responses have not been studied in patients with implanted vagus nerve stimulators. Application of this approach to acute hemorrhage and trauma can now be explored for possible adaptation for prehospital care of military or civilian casualties using a device designed to suppress bleeding without significantly influencing heart rate. The molecular events after VNS converge on pathways that control local activation of thrombin, suggesting that vagus nerve stimulators may have therapeutic utility in hemophilia, a disease that results from abnormalities in coagulation factor activity that compromise the speed at which clots are formed at the site of injury. Elucidation of the mechanism of action of the anti-hemorrhage activity of VNS may reveal novel therapeutic approaches for a variety of trauma- and hemorrhage-related applications.
Acknowledgments
This work was supported by the Defense Advanced Research Programs Agency (approved for public release, distribution unlimited) and the National Institute of General Medical Sciences.
The authors thank Kathy Ryan, PhD, and Maj Col Lloyd Ketchum, MD, for insightful advice.
References
- 1.Tracey KJ. The inflammatory reflex. Nature. 2002;420(6917):853–859. doi: 10.1038/nature01321. [DOI] [PubMed] [Google Scholar]
- 2.Czura CJ, Tracey KJ. Autonomic neural regulation of immunity. J Intern Med. 2005;257(2):156–166. doi: 10.1111/j.1365-2796.2004.01442.x. [DOI] [PubMed] [Google Scholar]
- 3.Borovikova LV, Ivanova S, Zhang M, Yang H, Botchkina GI, Watkins LR, Wang H, Abumrad N, Eaton JW, Tracey KJ. Vagus nerve stimulation attenuates the systemic inflammatory response to endotoxin. Nature. 2000;405(6785):458–462. doi: 10.1038/35013070. [DOI] [PubMed] [Google Scholar]
- 4.Wang H, Yu M, Ochani M, Amella CA, Tanovic M, Susarla S, Li JH, Wang H, Yang H, Ulloa L, et al. Nicotinic acetylcholine receptor alpha7 subunit is an essential regulator of inflammation. Nature. 2003;421(6921):384–388. doi: 10.1038/nature01339. [DOI] [PubMed] [Google Scholar]
- 5.Lawson JH, Kalafatis M, Stram S, Mann KG. A model for the tissue factor pathway to thrombin. I. An empirical study. J Biol Chem. 1994;269(37):23357–23366. [PubMed] [Google Scholar]
- 6.Rand MD, Lock JB, van’t Veer C, Gaffney DP, Mann KG. Blood clotting in minimally altered whole blood. Blood. 1996;88(9):3432–3445. [PubMed] [Google Scholar]
- 7.Butenas S, van ’t Veer C, Mann KG. Evaluation of the initiation phase of blood coagulation using ultrasensitive assays for serine proteases. J Biol Chem. 1997;272(34):21527–21533. doi: 10.1074/jbc.272.34.21527. [DOI] [PubMed] [Google Scholar]
- 8.Brummel KE, Butenas S, Mann KG. An integrated study of fibrinogen during blood coagulation. J Biol Chem. 1999;274(32):22862–22870. doi: 10.1074/jbc.274.32.22862. [DOI] [PubMed] [Google Scholar]
- 9.Cawthern KM, van ’t Veer C, Lock JB, DiLorenzo ME, Branda RF, Mann KG. Blood coagulation in hemophilia A and hemophilia C. Blood. 1998;91(12):4581–4592. [PubMed] [Google Scholar]
- 10.van ’t Veer C, Mann KG. Regulation of tissue factor initiated thrombin generation by the stoichiometric inhibitors tissue factor pathway inhibitor, antithrombin-III, and heparin cofactor-II. J Biol Chem. 1997;272(7):4367–4377. doi: 10.1074/jbc.272.7.4367. [DOI] [PubMed] [Google Scholar]
- 11.Olson ST, Björk I, Shore JD. Kinetic characterization of heparin-catalyzed and uncatalyzed inhibition of blood coagulation proteinases by antithrombin. Methods Enzymol. 1993;222:525–559. doi: 10.1016/0076-6879(93)22033-c. [DOI] [PubMed] [Google Scholar]
- 12.Girard TJ, Warren LA, Novotny WF, Likert KM, Brown SG, Miletich JP, Broze GJ., Jr Functional significance of the Kunitz-type inhibitory domains of lipoprotein-associated coagulation inhibitor. Nature. 1989;338(6215):518–520. doi: 10.1038/338518a0. [DOI] [PubMed] [Google Scholar]
- 13.Rapaport SI. The extrinsic pathway inhibitor: a regulator of tissue factor–dependent blood coagulation. Thromb Haemost. 1991;66(1):6–15. [PubMed] [Google Scholar]
- 14.Broze GJ, Jr, Warren LA, Novotny WF, Higuchi DA, Girard JJ, Miletich JP. The lipoprotein-associated coagulation inhibitor that inhibits the factor VII-tissue factor complex also inhibits factor Xa: insight into its possible mechanism of action. Blood. 1988;71(2):335–343. [PubMed] [Google Scholar]
- 15.Walker FJ, Sexton PW, Esmon CT. The inhibition of blood coagulation by activated Protein C through the selective inactivation of activated factor V. Biochim Biophys Acta. 1979;571(2):333–342. doi: 10.1016/0005-2744(79)90103-7. [DOI] [PubMed] [Google Scholar]
- 16.Suzuki K, Stenflo J, Dahlbäck B, Teodorsson B. Inactivation of human coagulation factor V by activated protein C. J Biol Chem. 1983;258(3):1914–1920. [PubMed] [Google Scholar]
- 17.Hockin MF, Kalafatis M, Shatos M, Mann KG. Protein C activation and factor Va inactivation on human umbilical vein endothelial cells. Arterioscler Thromb Vasc Biol. 1997;17(11):2765–2775. doi: 10.1161/01.atv.17.11.2765. [DOI] [PubMed] [Google Scholar]
- 18.Eaton D, Rodriguez H, Vehar GA. Proteolytic processing of human factor VIII. Correlation of specific cleavages by thrombin, factor Xa, and activated protein C with activation and inactivation of factor VIII coagulant activity. Biochemistry. 1986;25(2):505–512. doi: 10.1021/bi00350a035. [DOI] [PubMed] [Google Scholar]
- 19.Esmon CT. The regulation of natural anticoagulant pathways. Science. 1987;235(4794):1348–1352. doi: 10.1126/science.3029867. [DOI] [PubMed] [Google Scholar]
- 20.Esmon CT. Thrombomodulin as a model of molecular mechanisms that modulate protease specificity and function at the vessel surface. FASEB J. 1995;9(10):946–955. doi: 10.1096/fasebj.9.10.7615164. [DOI] [PubMed] [Google Scholar]
- 21.Collen D, Schetz J, de Cock F, Holmer E, Verstraete M. Metabolism of antithrombin III (heparin cofactor) in man: effects of venous thrombosis and of heparin administration. Eur J Clin Invest. 1977;7(1):27–35. doi: 10.1111/j.1365-2362.1977.tb01566.x. [DOI] [PubMed] [Google Scholar]
- 22.Persson E, Bak H, Olsen OH. Substitution of valine for leucine 305 in factor VIIa increases the intrinsic enzymatic activity. J Biol Chem. 2001;276(31):29195–29199. doi: 10.1074/jbc.M102187200. [DOI] [PubMed] [Google Scholar]
- 23.Tracey KJ. Reflex control of immunity. Nat Rev Immunol. 2009;9(6):418–428. doi: 10.1038/nri2566. [DOI] [PMC free article] [PubMed] [Google Scholar]
- 24.Daban C, Martinez-Aran A, Cruz N, Vieta E. Safety and efficacy of vagus nerve stimulation in treatment-resistant depression. A systematic review. J Affect Disord. 2008;110(1–2):1–15. doi: 10.1016/j.jad.2008.02.012. [DOI] [PubMed] [Google Scholar]
- 25.Ramani R. Vagus nerve stimulation therapy for seizures. J Neurosurg Anesthesiol. 2008;20(1):29–35. doi: 10.1097/ANA.0b013e31815b7df1. [DOI] [PubMed] [Google Scholar]