

Abstract
Using restriction fragment differential display (RFDD) technology, we have identified the imprinted gene neuronatin (Nnat) as a hypothalamic target under the influence of leptin. Nnat mRNA expression is decreased in several key appetite regulatory hypothalamic nuclei in rodents with impaired leptin signaling and during fasting conditions. Furthermore, peripheral administration of leptin to ob/ob mice normalizes hypothalamic Nnat expression. Comparative immunohistochemical analysis of human and rat hypothalami demonstrates that NNAT protein is present in anatomically equivalent nuclei, suggesting human physiological relevance of the gene product(s). A putative role of Nnat in human energy homeostasis is further emphasized by a consistent association between single nucleotide polymorphisms (SNPs) in the human Nnat gene and severe childhood and adult obesity.
INTRODUCTION
In search for a novel leptin-regulated gene product involved in the control of energy homeostasis, we used a modified differential display method to compare hypothalamic mRNA expression profiles between lean wild-type and obese ob/ob mice, and db/db mice. In particular, one mRNA fragment pointed to a robustly downregulated gene in genetically obese mice and was subsequently identified as neuronatin (Nnat).
The Nnat gene was originally discovered from a differential display on the developing rat brain (1). It exists in two major variants tentatively leading to synthesis of either an α (81 amino acids) or a β (54 amino acids) form of NNAT protein (1–5). Both forms have potential cleavage sites flanked by basic amino acids as signal peptides (6), but very little is known about their putative function.
Originally, Nnat was thought to be a brain-specific developmental gene involved in neuronal differentiation. More recent data, however, have demonstrated Nnat to be abundantly expressed in several peripheral tissues. In the pancreatic β-cells (7) and adipocytes (8), Nnat is considered to play important roles in glucose-mediated insulin secretion and adipocyte differentiation indicating a role in metabolic regulation. In this respect, it is also worth emphasizing that Nnat is a paternally inherited imprinted gene (9). Genes expressed from only one allele are often involved in regulation of growth and hence indirectly in the control of energy and glucose homeostasis (10).
To further understand the putative role of the Nnat gene in the regulation of energy balance, we initiated a series of studies examining Nnat mRNA and NNAT protein expression in genetically obese rodent brain. To provide clinical validation of the discovery, genetic epidemiology was used to examine associations between variations in the Nnat gene and severe forms of adult and childhood obesity.
Methods and Procedures
Differential display analysis of gene expression in hypothalamic tissue
A modified differential display method, restriction fragment differential display analysis, RFDD-PCR (11) was used to analyze total RNA isolated from the hypothalamus in C57BL wt, C57BL/6J:ob/ob, and C57BL/6J:db/db mice (Taconic, Lille Skensved, Denmark). Briefly, a pool of four hypothalamic tissue samples from each group was subjected to RNA isolation and processed according to the RFDD-PCR protocol, as described in detail in the Display Profile kit available from Qbiogene (now MP Biomedicals, Solon, OH). The resulting gene fragments were resolved on polyacrylamide gels. Gene fragments representing differentially expressed genes were isolated, cloned, and sequenced using standard techniques.
Proteins and substances
Two different NNAT fragments were used for the immunization and radioimmunoassay (RIA) experiments: peptide 1, the 44 amino-acid predicted NNAT α-fragment (sequence:H FRNPPGTQPIARSEVFRYS LQKLAHTVSRTGRQVLGERRHRAPN-OH); peptide 2, the 23 amino-acid predicted Nnat β-fragment (sequence: H-KLAHTVSRTGR QVLGERRHRAPN-OH). Peptides for the immunization experiments were synthesized (by liquid phase synthesis) at Schafer-N (Copenhagen, Denmark) with a purity >95%. Peptides for the RIA analysis experiments were synthesized (by solid phase synthesis) at Aurigene Discovery Technologies (Bangalore, India).
ISH
A 341 base-pair Nnat complementary DNA fragment was cloned into the pBluescript K+ vector (accession no: x83570; primers: 5′ 672 CATCAACCAGCAGAATGGAC 691, 3′ 1013 TGAGACCAGGGATAA GCAAG 994) and in vitro transcription of linearized plasmids was used to generate 33P labeled Nnat sense and antisense probes. In situ hybridization (ISH) was performed as described previously (12).
Antibodies and immunohistochemistry
Peptides were coupled to bovine serum albumin (fraction V; Roche Diagnostics, Hvidovre, Denmark) and New Zealand white rabbits (Charles River, Brussels, Belgium) were then immunized with peptide 1 (n = 4) and peptide 2 (n = 4). Single immunohistochemistry using DAB as chromogen, and single and double fluorescence immunohistochemistry was performed as previously described (13,14). Preimmune serum was obtained from all rabbits. An antibody was generated (333rb), and single immunohistochemistry revealed that blood collections nos. 4 and 5 generated the best staining (labeled 333rb-4 and 333rb-5). 333rb-4 was used for the immunohistochemical and western blotting experiments, and 333rb-5 was used for the RIA analyses. Specificity of the 333rb antiserum was tested in an immunostaining experiment where antibody (333rb-4 and 333-rb-5) was preincubated overnight at 4 °C with either 1 μmol/l Nnat α-fragment 38–81 (Schafer-N) or 1 μmol/l Nnat β-fragment 59–81 (Aurigene Discovery Technologies) followed by single immunoreactivity using DAB as chromogen.
Human hypothalamic tissue was obtained under a personal license to P.J.L. from the Dutch Brain Bank.
Animal experiments
All animals were housed under a 12-h light, 12-h dark (lights on at 0600 hours) in a temperature-controlled environment (22–24 °C) with free access to food and water unless otherwise stated. All experiments were conducted in accordance with internationally accepted principles for the care and use of laboratory animals and were approved by the Danish committee for animal research. Two groups of animals were used for ISH experiments: (i) nine Ob/? and 20 ob/ob mice (C57BL/6J strain; Jackson Laboratories, Bar Harbor, ME) injected daily for 5 days with leptin (10 ob/ob mice, 1.5 mg/kg; Calbiochem-Novabiochem, La Jolla, CA) or vehicle (10 ob/ob mice and nine Ob/? mice); (ii) 16 obese Zucker fa/fa and 16 lean Fa/? littermates (Charles River, Sulzfeld, Germany), half of each genotype being subjected to a 48-h fast. All animals were killed by decapitation, brains were removed, snap-frozen on dry ice and stored at −80 °C until further processing. For each individual ISH experiment, all slides were processed simultaneously and exposed onto the same X-ray film. Autoradiograms were analyzed on a computerized image analysis system as area multiplied by intensity following background subtraction (NIH Image 1.60b; National Institutes of Health, Bethesda, MD).
Western blotting experiments
Protein was extracted from frozen rat hypothalamic tissue blocks using standard techniques. Extracts were diluted in 1.25xLDS (Invitrogen, Taastrup, Denmark) containing 50 mmol/l dithiothreitol. The protein concentration was determined using a Bradford kit (Bio-Rad, Copenhagen, Denmark) as described by the manufacturer. Western blotting and ECL samples were run on a 12% NuPAGE gel (Invitrogen Novex, NP0342) using the MES buffer system (Invitrogen), followed by blotting onto PVDF membrane (Invitrogen Novex, LC2002) as described by the manufacturer. NNAT peptides were detected by enhanced chemoluminescence: The membrane was blocked overnight in 1× phosphate-buffered saline (PBS), 10% nonfat dry milk, and 0.1% Tween) at 4 °C. The membrane was washed in PBS and incubated with NNAT antibody (333rb-4) diluted 1:250 in PBS with 5% nonfat dry milk for 60 min at room temperature. The membrane was then washed 6 × 5 min in PBS + 0.1% Tween, then incubated for 60 min in horse-radish peroxidase–coupled anti-rabbit IgG (Cell Signaling, Danvers, MA) diluted 1:60,000 in PBS with 5% nonfat dry milk followed by 6 × 5 min washes in PBS + 0.1% Tween. Detection was performed with a Supersignal West Femto maximum sensitivity substrate (Pierce, Rockford, IL).
RIA analysis
Five hundred microliters of reconstituted sample or standard in assay buffer (0.04 mol/l PBS, pH 7.4, 58 μmol/l human serum albumin, 0.1 mol/l NaCl, Trasylol 400000 KIE/L, and sodium-EDTA 0.5 mol/l, pH 7.4) was incubated for 48 h with 200 μl antiserum (333rb-5) diluted 1:8,000 in 0.04 mol/l PBS (pH 7.4, 58 μmol/l human serum albumin). Samples were added 100 μl radiolabeled peptide (NNAT α-fragment 38–81), diluted 1:1,500 in 0.04 mol/l PBS (pH 7.4, 58 μmol/l HS), incubation for another 48 h before separation of bound and free peptide was performed by absorption to plasma-coated activated charcoal. Following centrifugation, the supernatant and charcoal precipitates were counted using synthetic rat NNAT α-fragment 38–81 (Schafer-N) and NNAT β-fragment 59–81 (Aurigene Discovery Technologies) as standards. All procedures were performed at 4 °C. The coefficients of variation within and between assay were between 3 and 16% (n = 17).
Cell culture experiments
PC12 cells were cultured in a humidified atmosphere containing 5% CO2 in medium composed of RPMI 1640 added with fresh 2 mmol/l L-glutamine, 10% heat-inactivated donor horse serum, 5% heat-inactivated fetal calf serum, and Pen/Strep (100 U/ml penicillin and 100 μg/ml streptomycin). Confluent cultures were used as undifferentiated PC12 cells. Differentiation of PC12 cells was obtained by growing PC12 in normal- or serum-reduced medium containing nerve growth factor (250 ng/ml final concentration). HEK293 cells were cultured in a humidified atmosphere containing 5% CO2 in a medium composed of D-MEM (+GlutaMax) added 10% heat-inactivated fetal bovine serum and Pen/Strep (100 U/ml penicillin and 100 μg/ml streptomycin). The cells were transfected with three different plasmids in a 3:1 FuGENE:DNA ratio: (i) control (PcDNA3.1D/V5-HIS/lacZ): 18 μl FuGENE, 1.66 μl plasmid, 580 μl Opti-MEM; (ii) NNAT-α (full-length complementary DNA clone inserted into pcDNA-3 vector): 18 μl FuGENE, 4.41 μl plasmid, 578 μl Opti-MEM; (iii) NNAT-β (full-length complementary DNA clone inserted into pcDNA-3 vector): 18 μl FuGENE, 5 μl plasmid, 577 μl Opti-MEM.
Hypothalamic, white adipose tissue, pancreas, and pituitary gland RIA
A total of 20 male Wistar rats (200 g; Taconic, Lille Skensved, Denmark) were housed under standard laboratory conditions with ad lib access to food and water. Two experimental groups were included in the study: (i) 15 rats with ad lib access to food and water; (ii) five rats fasted for 48 h but with ad lib access to drinking water. The rats were decapitated, and the brains were rapidly removed. Hypothalamus, pituitary gland, pancreas, and epididymal fat were dissected and immediately frozen on dry ice before storage at −80 °C until extraction. Each sample was weighed and boiled in 10 volumes of demineralized water for 25 min followed by homogenization and centrifugation. The supernatant was decanted. The sediment was homogenized with five volumes of 0.5 mol/l acetic acid, mixed with the boiling water supernatant, then centrifuged before the supernatant was decanted and freeze-dried. Before analysis, the dried extract was reconstituted in assay buffer and analyzed in duplicate.
Human genetic studies
The human populations genotyped in this study have been described elsewhere (15–17). The study protocol was approved by all local ethics committees, and informed consent was obtained from each subject before participation in the study. Genotyping was done by the Applied Biosystems SNPlex Technology (Applied Biosystems, Naerum, Denmark) based on the oligonucleotide ligation assay combined with multiplex PCR target amplification (http://www.applied-biosystems.com). The chemistry of the assay relies on a set of universal core reagent kits and a set of single nucleotide polymorphism (SNP)–specific ligation probes allowing a multiplex genotyping of 48 SNPs simultaneously in a unique sample. A quality control measure was included by using specific internal controls for each step of the assay (according to the manufacturer’s instructions). Allelic discrimination was performed through capillary electrophoresis analysis using an Applied Biosystems 3730xl DNA Analyzer and GeneMapper 3.7 software. Duplicate samples were assayed with a concordance rate of 100%. All SNPs were in Hardy–Weinberg equilibrium in the control group (P > 0.05).
Statistical analysis
Statistical analysis was performed by analysis of variance unless otherwise stated. Tests for deviation from Hardy–Weinberg equilibrium and for association were performed with the de Finetti program (http://ihg.gsf.de/cgi-bin/hw/hwa1.pl). TDT test has been performed using XDT and Aspex TDT programs (http://aspex.sourceforge.net/).
RESULTS
Identification of Nnat as a leptin-regulated transcript
The RFDD-PCR analyses of hypothalamic mRNA expression profiles between lean wild-type and genetically obese mice identified several gene fragments. These were isolated, cloned, sequenced, and subjected to bioinformatic analysis. One mRNA fragment was robustly downregulated in both ob/ob and db/db mice, and identified as Nnat (Figure 1a). Subsequent ISH experiments identified Nnat mRNA in several hypothalamic areas, including the hypothalamic paraventricular nucleus (PVN), the arcuate nucleus (Arc), the ventromedial and dorsomedial hypothalamic nucleus (DMH), and the lateral hypothalamic area (LHA) (Figure 1b–d; Figure 2a–d). The comparison of obese and wild-type mice revealed a significant decrease in Nnat mRNA levels in the DMH/LHA of ob/ob mice (Figure 1f), and 5 days of once-daily injection with leptin to ob/ob mice normalized Nnat mRNA expression in the DMH and LHA (Figure 1f). Also in fasted obese (fa/fa) and lean (Fa/?) Zucker rats, a significant effect of genotype was demonstrated in the DMH and PVN (Figure 1g,h), as well as a significant effect of genotype and fasting. A significant effect of fasting was also observed in the Arc, ventromedial hypothalamic nucleus, and LHA with a nearly identical down-regulation of Nnat expression in fasted rats of both genotypes (data not shown).
Figure 1.

Hypothalamic Nnat mRNA expression. (a) Image from part of the RFDD analysis showing the gene fragment representing neuronatin (586–669 base pairs, Gb: AK003004) downregulated (absent) in ob/ob and db/db mice. (b–d) Radioactive ISH with antisense probe on rat hypothalamus (b, PVN; c, VMH and Arc; d, Arc and DMH). (e) Radioactive ISH with sense probe. (f) Nnat mRNA levels in the DMH and LHA of lean Ob/? mice, and in vehicle- or leptin-treated ob/ob mice. (g,h) Nnat mRNA levels in lean and obese Zucker rats showing reduced Nnat mRNA expression in the DMH (g) and PVN (h) of leptin receptor–deficient and fasted animals. Data in f–h are means ± s.e.m.; asterisk indicate P < 0.05 (ANOVA followed by Fisher’s post hoc test or Student’s t-test). DMH, dorsomedial hypothalamic nucleus; ISH, in situ hybridization; LHA, lateral hypothalamic area; PVN, paraventricular nucleus; RFDD, restriction fragmented differential display.
Figure 2.

Microphotographs of NNAT-immunoreactivity (left panels) and Nnat mRNA expression (dark-field images obtained from emulsion right panels) juxtaposed to illustrate overlap between NNAT-ir and Nnat mRNA. ARC, arcuate nucleus; DMHc, dorsomedial hypothalamic nucleus compact part; LHA, lateral hypothalamic area; PVN, paraventricular nucleus.
Nnat-immunization and characterization of antibodies
NNAT-α (44aa) and NNAT-β (23aa) were synthesized and subsequently used for immunization of New Zealand rabbits. One antibody (333rb) gave rise to cellular NNAT staining in both rat and human brain sections (Figure 3a–d). Preimmune serum from rabbit 333rb did not give rise to any staining (Figure 3a) and preabsorbtion of 333rb antibody with either NNAT-α or NNAT-β abolished all staining (data not shown). In western blots, 333rb recognized both the NNAT-α and NNAT-β peptides used for immunization and only two bands (corresponding in size to full-length NNAT-α and NNAT-β peptides; Figure 4c). In RIA analyses, dilution curves of tissue extracts were found to parallel the NNAT-α standard curve (data not shown), and data from the transfection experiments showed high levels in transfected and low in nontransfected cells. Taken together, the immunohistochemical, western blotting, and RIA analyses suggest that the 333rb antibody specifically binds to NNAT peptides and provides no evidence for crossreactivity to other peptides/proteins.
Figure 3.

Immunohistochemical analysis of NNAT protein in the rat and human brain. (a) No staining is seen in the PVN using preimmune serum from rabbit 333rb. (b) NNAT-ir cell bodies in the PVN using serum from rabbit 333rb immunized against processed NNAT-α. (c) NNAT-ir in the LHA of the human brain. (d) CART-ir in the LHA of the human brain. (e–h) Double immunofluorescence showing colocalization (arrows) between CART-ir (e,f), MCH-ir (g) and orexin-ir (h) neurons with NNAT (red) in the LHA of the rat. Bars = 100 μm (a,b,e,g,h) and 10 μm (c,d,f). LHA, lateral hypothalamic area; PVN, paraventricular nucleus.
Figure 4.
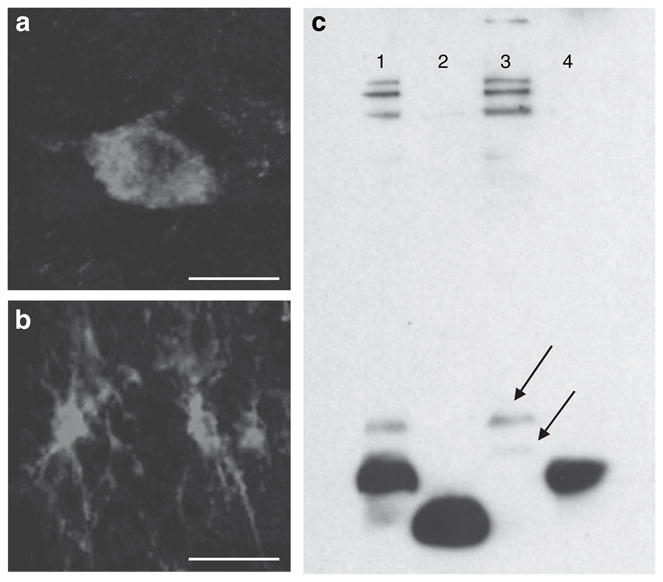
(a,b) Confocal laser microphotographs of NNAT-ir in a (a) neuron and (b) glial cell from the rat DMH and periventricular nucleus, respectively. Staining is seen throughout the cytoplasm in both structures. (c) Western blot. Lane 1, brain extract + 10 ng NNAT-α (37–81); lane 2, 10 ng NNAT-β (32–54); lane 3, brain extract; lane 4, 10 ng NNAT-α (37–81). The antibody recognizes both peptides used for the immunization experiments. In rat brain extract, two bands appear (arrows) of ~9,000 and 6,000 kDa corresponding to unprocessed forms of NNAT-α (1–81) (predicted mass = 9,211 kDa) and NNAT-β (1–54) (predicted mass = 6,127 kDa), respectively. DMH, dorsomedial hypothalamic nucleus.
Nnat-immunoreactivity in rodent and human hypothalamus
Immunohistochemical analysis revealed expression of NNAT protein largely confined to limbic structures including the amygdala and bed nucleus of stria terminalis, as well as to the hypothalamic nuclei expressing Nnat mRNA (Figure 2). Because of the important role played by the lateral hypothalamic area in controlling the behavioral aspect of food intake and because a high number of NNAT-ir positive cells were observed in this area in the human hypothalamus, we focused our attention to this area in the phenotypic characterization studies. Double fluorescence immunohistochemistry revealed NNAT-immunoreactive neurons colocalizing with CART (cocaine- and amphetamine-regulated transcript), MCH (melanin- concentrating hormone), and orexin-expressing neurons in the LHA (Figure 3e–h), but not with CART neurons in the Arc (data not shown). The cellular localization of NNAT was evaluated by confocal microscopy (Figure 4a,b). It has previously been suggested that NNAT is a membrane-associated protein because the N-terminal part of both NNAT-α and NNAT-β are rich in hydrophobic amino acids (1–3). However, our confocal microscopy images suggested that NNAT protein is predominantly located in the cytoplasma (Figure 4a,b).
Characterization of hypothalamic NNAT protein using RIA and western blotting
The cellular staining characteristics of NNAT led us to a further characterization of NNAT proteins. A western blot of hypothalamic brain extracts yielded bands with a size equivalent to unprocessed forms of NNAT. No secreted peptides with lower mass as predicted by the SignalP server could be identified (Figure 4c). Consequently, we developed a RIA method to determine the fate of NNAT protein synthesized in PC12 cells (18,19). Although the RIA method readily detected NNAT protein in PC12 lysate, we were unable to detect NNAT protein in the cell media suggesting that PC12 cells do not secrete NNAT protein (Table 1). This was also evident using transfected HEK293 cells with plasmids encoding full-length NNAT-α and NNAT-β (Table 1) suggesting that NNAT is a cytoplasmic protein not bound for secretion. In order to associate changes in Nnat mRNA expression with changes in protein levels, we examined the effect of 48-h fasting on NNAT protein levels in male Wistar rats and found a near significant effect in the hypothalamus of fasted rats. A small reduction of NNAT protein levels following fasting was also observed in white adipose tissue, but not in the pituitary or pancreas (Table 1).
Table 1.
RIA analysis of NNAT protein
| NNAT pmol/g free-fed (n = 5) | NNAT pmol/g 48-h fast (n = 5) | NNAT pmol/g cell lysate (n = 2) | NNAT pmol/g culture medium (n = 2–3) | |
|---|---|---|---|---|
| PC12 undifferentiated | 26.85 ± 1.95 | 0.0 ± 0.0 | ||
| PC12 differentiated | 23.20 ± 2.40 | 2.55 ± 2.55 | ||
| HEK293 cntr | 38.40 ± 10.40 | 0.0 ± 0.0 | ||
| HEK293-α | 304.5 ± 166.5 | 0.0 ± 0.0 | ||
| HEK293-β | 382.5 ± 27.5 | 0.0 ± 0.0 | ||
| Hypothalamus | 1.14 ± 0.12 | 0.84 ± 0.08 | ||
| Pituitary gland | 6.93 ± 0.61 | 6.75 ± 1.72 | ||
| WAT | 0.51 ± 0.04 | 0.38 ± 0.13 | ||
| Pancreas | 0.41 ± 0.04 | 0.38 ± 0.13 |
RIA analysis of hypothalamus, pituitary gland, WAT (epididymal), and pancreas extracts from free-fed and fasted animals. In the hypothalamus and WAT, a near significant (P < 0.1) decrease of NNat protein was observed in fasted animals. RIA analysis of cell lysate and cell media from PC12 cells and HEK cells transfected with either control plasmid (cntr) or a plasmid containing full-length NNAT-α complementary DNA or full-length NNAT-β complementary DNA showed NNAT protein in cell lysates but never in the media—suggesting that NNAT proteins are not secreted.
HEK, human embryonic kidney; RIA, radioimmunoassay; WAT, white adipose tissue.
Identification of NNAT SNPs associated with morbid obesity
Using a tagging SNP procedure in the BLCAP locus, we genotyped six SNPs in 2,764 lean subjects with normal glucose tolerance, 813 obese children, and 896 class III obese adults, all French whites, and unrelated. In this initial design, we had a statistical power of 80% to detect an odds ratio of 1.16 (minor allele frequency of 0.2, pα = 0.05). One SNP located in the 3′ region of Nnat (rs6090836) showed association with childhood obesity, class III adult obesity, and pooled severe forms of obesity (Table 2), which remained significant (P < 0.05) following the application of a simple Bonferroni correction for multiple testing. In a second step, we genotyped nine additional SNPs in partial linkage disequilibrium (0.8 < r2 < 1) with rs6090836, according to the HapMap database, in order to find the potential causative SNP in the obesity-associated linkage disequilibrium block by odds ratio comparison. The nine SNPs showed nominal association with class III adult obesity and severe forms of obesity (data not shown). However, one SNP (rs6019102) located in the 3′ region of Nnat and showing strong linkage disequilibrium with rs6090836 was clearly the most strongly associated with childhood obesity, class III adult obesity, and severe forms of obesity (Table 2). To assess the evidence against rs6019102 being the sole causal variant in the region, we used a two-SNP logistic regression model with both rs6090836 and rs6019102 in the whole group of obese and control subjects, as previously described (20). We were unable to distinguish between the effects of rs6090836 and rs6019102 on risk for severe obesity. In order to exclude a potential undetected stratification effect, we genotyped the SNP rs6019102 in 154 families (N = 741) discordant for class III obesity, of Swedish descent, and we observed overtransmission of the C risk allele to class III (BMI ≥40 kg/m2) obese offsprings (transmitted = 62%, P one-sided = 0.019), but no significant preferential transmission of the paternally or maternally inherited alleles (data not shown). We then assessed whether the rs6019102 was associated with quantitative variation of BMI and body fat mass, using data from a recently published whole genome association study in a US whites general population (N = 1,000) for in silico replication (17). Because the rs6019102 SNP was not included in the 500K Affymetrix array, we selected a surrogate in complete linkage disequilibrium with this SNP (rs3764718, r2 = 1). Rs3764718 polymorphism was significantly associated with variation of BMI and body fat mass (P = 0.0051 and P = 0.0049, respectively). These results suggest that genetic variation at the Nnat locus is associated with susceptibility to severe forms of obesity and quantitative variation of body fat mass in humans.
Table 2.
Genotypic distribution and odds ratios of rs6090836 and rs6019102 among control and obese subjects
| SNPs | Genotype counts | MAF | Allelic odds ratio (95% CI) | P value (allelic) | ||
|---|---|---|---|---|---|---|
| rs6090836 | CC | CT | TT | |||
| Controls | 1,416 (0.55) | 969 | 168 (0.07) | 0.26 | ||
| Obese children | 408 (0.52) | 318 | 63 (0.08) | 0.28 | 1.14 (1.005–1.29) | 0.041 |
| Controls | 1,416 (0.55) | 969 | 168 (0.07) | 0.26 | ||
| Class III obese adults | 450 (0.51) | 348 | 87 (0.10) | 0.29 | 1.22 (1.08–1.37) | 0.0012 |
| Controls | 1,416 (0.55) | 969 | 168 (0.07) | 0.26 | ||
| Pooled obese forms of obesity | 858 (0.51) | 666 | 150 (0.09) | 0.29 | 1.18 (1.07–1.30) | 0.00083 |
| rs6019102 | TT | TC | CC | |||
| Controls | 1,325 (0.55) | 907 | 157 (0.07) | 0.26 | ||
| Obese children | 296 (0.48) | 266 | 53 (0.09) | 0.3 | 1.26 (1.10–1.45) | 0.00089 |
| Controls | 1,325 (0.55) | 907 | 157 (0.07) | 0.26 | ||
| Class III obese adults | 442 (0.51) | 341 | 84 (0.10) | 0.29 | 1.21 (1.07–1.37) | 0.002 |
| Controls | 1,325 (0.55) | 907 | 157 (0.07) | 0.26 | ||
| Pooled obese | 738 (0.50) | 607 | 137 (0.09) | 0.3 | 1.23 (1.11–1.36) | 0.00006 |
Significant P values <0.05 are indicated in boldface. CC, CT, TT, and TC refer to base (DNA) combinations.
CI, confidence interval; MAF; minor allele frequency; SNPs, single nucleotide polymorphisms.
DISCUSSION
In the current study, we have identified Nnat mRNA expression (Nnat) to be under the influence of leptin signaling. Subsequent analysis of Nnat mRNA expression in obese ob/ob mice and obese fa/fa rats confirmed these initial findings. Fasting reduces Nnat mRNA levels in several hypothalamic nuclei involved in appetite regulation in both lean and obese Zucker rats indicating that hypothalamic Nnat is influenced by both leptin-dependent leptin-independent metabolic perturbations. The similar localization of NNAT-immunoreactivity in rodent and human brain could indicate that NNAT protein plays a similar functional role in both species. A significant association between Nnat SNPs and human obesity supports a role in metabolic regulation.
Although Nnat expression has been investigated in a number of developmental studies (1–3), no studies have examined possible physiological regulation of Nnat mRNA levels in adult rats. In the current study, we found the expression of Nnat mRNA and NNAT protein to be largely confined to limbic structures including the amygdala, bed nucleus of stria terminalis, as well as the mediobasal hypothalamus. In the present study, we have concentrated the neuroanatomical study of Nnat-expressing cells to hypothalamic nuclei, as this was the brain region demonstrating leptin-dependent regulation of Nnat mRNA expression in ob/ob mice. Although the Arc is considered the major central sensor of leptin, Nnat mRNA expression in this hypothalamic nucleus was unaffected by disruptions in leptin signaling. Immunohistochemical analysis revealed that NNAT in the Arc was expressed in tanycytes and not in neurons.
Interestingly, the DMH and PVN represented the only sites where Nnat mRNA levels were influenced by disruptions in leptin signaling. However, Nnat mRNA expression was regulated by fasting in most examined hypothalamic nuclei including the DMH, PVN, ventromedial hypothalamic nucleus, and Arc, as well as the lateral hypothalamic area. In the PVN, NNAT-immunoreactive cell bodies were predominantly located in the magnocellular portion of the PVN containing the oxytocinergic and vasopressinergic hypophysiotropic neurons. A lower number of cell bodies were also located in the medial parvocellular division in accordance with the ISH data. NNAT expression in the DMH was mainly restricted to the compact part of the nucleus. This part of the DMH also expresses NPY mRNA that has been implicated in appetite regulation (21). It is tempting to speculate that NNAT mRNA and protein are found in these neurons, but colocalization between NNAT and NPY would have to be done using ISH techniques because these neurons do not accumulate peptide to facilitate visualization of cell bodies. Further anatomical studies are needed to elucidate the phenotype of the NNAT-ir neurons in the PVN and the DMH. Given the important role of lateral hypothalamic neurons in appetite and body-weight regulation (22) and the finding of numerous NNAT-immunoreactive cell bodies in the human and rat hypothalamus, we examined colocalization between NNAT and MCH, and CART and orexin. In the lateral hypothalamic area, NNAT was found to be colocalized with both MCH, orexin, and CART. These findings together with the observed effects of fasting in the LHA could indicate that NNAT plays a functional role in these neurons.
Our initial analysis of the NNAT protein sequence led to the suggestion that various posttranslational forms of Nnat may serve as secreted neuropeptides. However, western blots suggested that hypothalamic NNAT-immunoreactivity corresponds to the full-length peptide sequence. Taken together with the lack of axonal and bouton-like structure labeling, these data speak against an intravesicular posttranslational processing. Furthermore, cell lines expressing the Nnat genes did not spontaneously release the peptide.
Although the physiological role of Nnat in brain function is largely unknown, the relevance of Nnat for human metabolic regulation was supported by the significant association between Nnat SNPs and human obesity. Several linkage and association studies have identified obesity loci to numerous regions of the human genome (23,24). Using genome-wide association scans, genetic variants of a number of loci have been identified, including FTO, MC4R, TMEM18, KCTD15, GNPDA2, SH2B1, MTCH2, and NEGR1(25–27). All of these loci are located with close proximity to genes that are highly expressed in the central nervous system. Thus, it is not unlikely that novel candidate genes linked to human obesity, like Nnat, encode a protein preferentially expressed in the central nervous system.
Very few functional studies addressing the molecular mode of action of Nnat have been published. Overexpression of Nnat in human aortic endothelial cells triggers activation of NF-κB-regulated genes (28). Apparently, Nnat-induced activation of NF-κB is mediated via PI3-kinase activation. If data obtained in aortic cell lines are universally transferable to neurons and other cell types of the central nervous system, a focal point for interaction with endogenous mediators of energy homeostasis exists as both insulin and leptin employ these intracellular signaling pathways in hypothalamic neurons (29).
Nnat is also expressed in peripheral tissues such as adipocytes and cells in pancreatic islets. In adipose tissue, it has been suggested that Nnat is involved in the regulation of adipogenesis (8). In the endocrine pancreas, it has been suggested that Nnat plays a role in glucose-stimulated insulin secretion from β-cells (7). Congruently, these data suggest that Nnat could be a key player in several tissues important in energy homeostasis.
In conclusion, the present study demonstrates that hypothalamic Nnat mRNA expression is influenced by leptin and by fasting. The SNP data from human populations demonstrate association between obesity and SNPs in the Nnat locus. Collectively, these data indicate that hypothalamic NNAT could be involved in the regulation of energy homeostasis. Given the widespread expression of Nnat, it seems that conditional knockout models should be employed in order to tease out the relative significance of NNAT protein in the various organs involved in metabolic processes.
Acknowledgments
We thank Farida Sahebzadeh, Anna Maria Thomsen, and Anja Daniel Andersen for excellent technical assistance. We thank the Danish Biotechnology Centre for Cellular Communication (J.F.), the Danish Diabetes Association, and the Novo Nordisk Foundation for financial support (N.V., M.T.-C.).
Footnotes
DISCLOSURE
N.V., J.J., M.T.-C., P.J.L., and L.K.L. were previously employed by Rheoscience. Other authors declared no conflict of interest.
References
- 1.Joseph R, Dou D, Tsang W. Molecular cloning of a novel mRNA (neuronatin) that is highly expressed in neonatal mammalian brain. Biochem Biophys Res Commun. 1994;201:1227–1234. doi: 10.1006/bbrc.1994.1836. [DOI] [PubMed] [Google Scholar]
- 2.Joseph R, Dou D, Tsang W. Neuronatin mRNA: alternatively spliced forms of a novel brain-specific mammalian developmental gene. Brain Res. 1995;690:92–98. doi: 10.1016/0006-8993(95)00621-v. [DOI] [PubMed] [Google Scholar]
- 3.Wijnholds J, Chowdhury K, Wehr R, Gruss P. Segment-specific expression of the neuronatin gene during early hindbrain development. Dev Biol. 1995;171:73–84. doi: 10.1006/dbio.1995.1261. [DOI] [PubMed] [Google Scholar]
- 4.Dou D, Joseph R. Structure and organization of the human neuronatin gene. Genomics. 1996;33:292–297. doi: 10.1006/geno.1996.0195. [DOI] [PubMed] [Google Scholar]
- 5.Dou D, Joseph R. Cloning of human neuronatin gene and its localization to chromosome-20q 11.2-12: the deduced protein is a novel “proteolipid”. Brain Res. 1996;723:8–22. doi: 10.1016/0006-8993(96)00167-9. [DOI] [PubMed] [Google Scholar]
- 6.Nielsen H, Engelbrecht J, Brunak S, von Heijne G. A neural network method for identification of prokaryotic and eukaryotic signal peptides and prediction of their cleavage sites. Int J Neural Syst. 1997;8:581–599. doi: 10.1142/s0129065797000537. [DOI] [PubMed] [Google Scholar]
- 7.Chu K, Tsai MJ. Neuronatin, a downstream target of BETA2/NeuroD1 in the pancreas, is involved in glucose-mediated insulin secretion. Diabetes. 2005;54:1064–1073. doi: 10.2337/diabetes.54.4.1064. [DOI] [PMC free article] [PubMed] [Google Scholar]
- 8.Suh YH, Kim WH, Moon C, et al. Ectopic expression of Neuronatin potentiates adipogenesis through enhanced phosphorylation of cAMP-response element-binding protein in 3T3-L1 cells. Biochem Biophys Res Commun. 2005;337:481–489. doi: 10.1016/j.bbrc.2005.09.078. [DOI] [PubMed] [Google Scholar]
- 9.Kikyo N, Williamson CM, John RM, et al. Genetic and functional analysis of neuronatin in mice with maternal or paternal duplication of distal Chr 2. Dev Biol. 1997;190:66–77. doi: 10.1006/dbio.1997.8681. [DOI] [PubMed] [Google Scholar]
- 10.Plagge A, Gordon E, Dean W, et al. The imprinted signaling protein XL alpha s is required for postnatal adaptation to feeding. Nat Genet. 2004;36:818–826. doi: 10.1038/ng1397. [DOI] [PubMed] [Google Scholar]
- 11.Gravesen A, Warthoe P, Knochel S, Thirstrup K. Restriction fragment differential display of pediocin-resistant Listeria monocytogenes 412 mutants shows consistent overexpression of a putative beta-glucoside-specific PTS system. Microbiology. 2000;146(Pt 6):1381–1389. doi: 10.1099/00221287-146-6-1381. [DOI] [PubMed] [Google Scholar]
- 12.Vrang N, Larsen PJ, Tang-Christensen M, Larsen LK, Kristensen P. Hypothalamic cocaine-amphetamine regulated transcript (CART) is regulated by glucocorticoids. Brain Res. 2003;965:45–50. doi: 10.1016/s0006-8993(02)04064-7. [DOI] [PubMed] [Google Scholar]
- 13.Vrang N, Phifer CB, Corkern MM, Berthoud HR. Gastric distension induces c-Fos in medullary GLP-1/2-containing neurons. Am J Physiol Regul Integr Comp Physiol. 2003;285:R470–R478. doi: 10.1152/ajpregu.00732.2002. [DOI] [PubMed] [Google Scholar]
- 14.Vrang N, Tang-Christensen M, Larsen PJ, Kristensen P. Recombinant CART peptide induces c-Fos expression in central areas involved in control of feeding behaviour. Brain Res. 1999;818:499–509. doi: 10.1016/s0006-8993(98)01349-3. [DOI] [PubMed] [Google Scholar]
- 15.Dina C, Meyre D, Samson C, et al. Comment on “A common genetic variant is associated with adult and childhood obesity”. Science. 2007;315:187. doi: 10.1126/science.1129402. author reply 187. [DOI] [PubMed] [Google Scholar]
- 16.Jacobson P, Torgerson JS, Sjöström L, Bouchard C. Spouse resemblance in body mass index: effects on adult obesity prevalence in the offspring generation. Am J Epidemiol. 2007;165:101–108. doi: 10.1093/aje/kwj342. [DOI] [PubMed] [Google Scholar]
- 17.Liu YJ, Liu XG, Wang L, et al. Genome-wide association scans identified CTNNBL1 as a novel gene for obesity. Hum Mol Genet. 2008;17:1803–1813. doi: 10.1093/hmg/ddn072. [DOI] [PMC free article] [PubMed] [Google Scholar]
- 18.Zheng S, Chou AH, Jimenez AL, et al. The fetal and neonatal brain protein neuronatin protects PC12 cells against certain types of toxic insult. Brain Res Dev Brain Res. 2002;136:101–110. doi: 10.1016/s0165-3806(02)00348-6. [DOI] [PubMed] [Google Scholar]
- 19.Joseph R, Tsang W, Dou D, Nelson K, Edvardsen K. Neuronatin mRNA in PC12 cells: downregulation by nerve growth factor. Brain Res. 1996;738:32–38. doi: 10.1016/0006-8993(96)00768-8. [DOI] [PubMed] [Google Scholar]
- 20.Smyth DJ, Cooper JD, Bailey R, et al. A genome-wide association study of nonsynonymous SNPs identifies a type 1 diabetes locus in the interferon-induced helicase (IFIH1) region. Nat Genet. 2006;38:617–619. doi: 10.1038/ng1800. [DOI] [PubMed] [Google Scholar]
- 21.Yang L, Scott KA, Hyun J, et al. Role of dorsomedial hypothalamic neuropeptide Y in modulating food intake and energy balance. J Neurosci. 2009;29:179–190. doi: 10.1523/JNEUROSCI.4379-08.2009. [DOI] [PMC free article] [PubMed] [Google Scholar]
- 22.Leinninger GM, Jo YH, Leshan RL, et al. Leptin acts via leptin receptor-expressing lateral hypothalamic neurons to modulate the mesolimbic dopamine system and suppress feeding. Cell Metab. 2009;10:89–98. doi: 10.1016/j.cmet.2009.06.011. [DOI] [PMC free article] [PubMed] [Google Scholar]
- 23.Rankinen T, Zuberi A, Chagnon YC, et al. The human obesity gene map: the 2005 update. Obesity (Silver Spring) 2006;14:529–644. doi: 10.1038/oby.2006.71. [DOI] [PubMed] [Google Scholar]
- 24.Rankinen T, Bouchard C. Genetics of food intake and eating behavior phenotypes in humans. Annu Rev Nutr. 2006;26:413–434. doi: 10.1146/annurev.nutr.26.061505.111218. [DOI] [PubMed] [Google Scholar]
- 25.Frayling TM, Timpson NJ, Weedon MN, et al. A common variant in the FTO gene is associated with body mass index and predisposes to childhood and adult obesity. Science. 2007;316:889–894. doi: 10.1126/science.1141634. [DOI] [PMC free article] [PubMed] [Google Scholar]
- 26.Thorleifsson G, Walters GB, Gudbjartsson DF, et al. Genome-wide association yields new sequence variants at seven loci that associate with measures of obesity. Nat Genet. 2009;41:18–24. doi: 10.1038/ng.274. [DOI] [PubMed] [Google Scholar]
- 27.Willer CJ, Speliotes EK, Loos RJ, et al. Six new loci associated with body mass index highlight a neuronal influence on body weight regulation. Nat Genet. 2009;41:25–34. doi: 10.1038/ng.287. [DOI] [PMC free article] [PubMed] [Google Scholar]
- 28.Mzhavia N, Yu S, Ikeda S, et al. Neuronatin: a new inflammation gene expressed on the aortic endothelium of diabetic mice. Diabetes. 2008;57:2774–2783. doi: 10.2337/db07-1746. [DOI] [PMC free article] [PubMed] [Google Scholar]
- 29.Niswender KD, Morrison CD, Clegg DJ, et al. Insulin activation of phosphatidylinositol 3-kinase in the hypothalamic arcuate nucleus: a key mediator of insulin-induced anorexia. Diabetes. 2003;52:227–231. doi: 10.2337/diabetes.52.2.227. [DOI] [PubMed] [Google Scholar]