Abstract
Purpose
We sought to identify measures of variability from sitting postural sway that are significantly different among infants who were developing typically, developmentally delayed or hypotonic, and infants that were later diagnosed with spastic or athetoid cerebral palsy.
Methods
Sixty-five infants were evaluated when they were just developing the ability to sit upright, by assessing center of pressure (COP) data using measures of both amount and temporal organization of COP variability.
Results
The results indicated that measures of variability of COP could discriminate between infants with developmental delay and infants with cerebral palsy and add to the description of sitting postural behavior.
Conclusions
Our method of evaluating sitting postural control could be an objective tool to help describe distinctive features of motor delay in an individual infant, and could lead in the design of selective therapeutic interventions for improving postural control of infants with motor delays.
Keywords: activities of daily living/sitting, biomechanics, cerebral palsy/diagnosis, cerebral palsy/physiopathology, developmental disabilities/diagnosis, developmental disabilities/physiopathology, human movement system, infant, nonlinear dynamics, physical therapy/methods, postural balance/physiology, posture/physiology
Introduction and Purpose
During sitting development in early infancy, weight may shift within the base of support due to emerging motor control skills, active exploration of postural control strategies, or body, arm and head movement used to respond to or explore the environment. The existing literature on infant sitting postural control includes kinematic and electromyographic analysis to describe sitting posture.1,2 Prior to sitting independence, infants present high variation in the recruitment patterns of muscle activation. However, these variations decrease over time, enabling the selection of the most appropriate muscle synergy and the development of sitting.2 These synergies in infants who are typically developing while learning to sit can be viewed as a progression from an in-phase (moving in the same direction) to an out-of-phase (moving in an opposite direction) coordinative relationship between the thorax and the pelvis segments.1 Infant sitting postural adjustments have also been investigated during reaching3 and it has been found that the development of postural changes during reaching while sitting presented a nonlinear and prolonged path.3 Recently, postural sway investigation has also been utilized to investigate sitting postural control.4,5 In one of those previous experiments,5 the infants sat on an inclined bicycle seat with a rigid back, which restricts infant movement and masks the true nature of the infant sitting pattern. However, Harbourne and Stergiou4 investigated the development of sitting in infants who were healthy without restricting the postural behavior by exploring the variability present in center of pressure (COP) data and they identified nonlinear behavioral characteristics.
Movement variability can be viewed and interpreted differently, depending on the theoretical perspective of motor control.6 Hierarchical theorists suggest that variability is error in the control system, which operates like a thermostat to keep the temperature at one preferred value. From this perspective, the goal of postural control in sitting would be to return to the optimal point of stability with slight variation around that point. In contrast, recently theories, such as dynamical systems, perception-action and the hypothesis of an optimal state of variability6 propose that variability benefits the organism by facilitating the exploration of the environment. Thus, the goal of postural control in sitting would be to explore diverse movement solutions by swaying within the stability limits.6 Furthermore, recent literature from several disciplines, including brain function and disease dynamics have shown that many biological phenomena are the result of nonlinear interactions and have deterministic origins.7 As such, behavior that was previously considered as error, i.e. slight variations of postural sway, may provide important information regarding the system that produced it. Such information can further our goal of improving intervention for children with posture and movement problems. For example, an infant with delayed sitting postural control may receive a different intervention depending on the theoretical perspective of the therapist regarding variability8. A therapist who believes that variability of postural sway is error in the system, will then try to support the infant in biomechanical alignment (such as a supportive seat), and avoid variable sitting behavior. Conversely, a therapist who views postural variability as an inherent, healthy behavior will facilitate a more explorative type of treatment, in which the infant experiences multiple postural strategies and is allowed to select sitting positions that may not be considered completely the best by the therapist. However, to determine which approach better promotes the acquisition of functional sitting skill, there is a need for a quantitative and objective experimental paradigm that will test not only how much variability an infant exhibits but also the pattern or structure of the variable behavior.
In an attempt to uncover both properties of infant sitting posture, Harbourne and Stergiou,9 investigated sitting development using linear and nonlinear parameters derived from COP data based on the dynamical systems perspective. Linear methods include measures from traditional statistics, such as range and root-mean-square, and provide insight regarding the amount of variability present in a COP time series. Alternatively, nonlinear methods provide insight on the temporal organization or structure of the variability present in the data by examining the patterns and the order that exist in COP data.6 Nonlinear methods were found to be sensitive in detecting subtle changes occurring during the normal maturation process of infants during sitting.9 Since there is a method that can objectively quantify sitting posture in infants, then the next logical step would be to investigate whether this experimental paradigm, proposed by Harbourne and Stergiou,9 can differentiate types of postural behavior in infants who are typically developing, or who have different types of movement or postural disorders. Quantification of postural control can lead to improved intervention for children with posture and movement problems.
Currently, a child with developmental delay is identified by abnormal neurological signs along with high risk factors occurring around birth, scores obtained on developmental screening tests, or visual analysis of their movement quality. However, currently available tests have several drawbacks. These tests vary in their specificity and sensitivity10 and are incomplete in predicting progress or developmental outcome for an individual child.11 They may only be useful at a specific age12 or may only measure progress by assessing large changes in motor skills, without being precise enough to provide information regarding rate of acquisition of skill on a short-term basis. It should be noted that even though these tests have been presented to be reliable methods of describing development and detecting developmental delay they are still subjective tests. Moreover, a diagnosis of cerebral palsy (CP) for a child that is developmentally delayed is often delayed until the age of 2 years because many of the usual clinical signs may be transient13,14. Therefore, postural control measurements may be useful in helping to differentiate the degree of severity (developmentally delayed, CP) of the disability in infants between the ages of 4 months to 2 years, such as in the sitting postural development paradigm proposed by Harbourne and Stergiou9. This paradigm is useful due to the simplicity of the model as well as the analytical method proposed. The experimental design of this paradigm requires the infant to sit on a force plate, as if sitting on the floor, thus the risk is minimal for the infant and the collection of data is accomplished without difficulty. In addition, the mathematical analysis of the COP data investigates infant sitting postural development from two different perspectives, that of amount and structure of variability, which provides a constellation of features inherent in each infant’s sitting posture. As a result, the investigation of sitting postural control by using linear and nonlinear measures of the COP data promises to give insight into the individual differences which describe the severity of disability in an infant, and which may make the infant distinct from others with a similar clinical presentation.
Therefore, the purpose of the present study was to identify measures of variability from sitting postural sway that are significantly different among typical, developmentally delayed infants, and infants with CP. A secondary goal was to identify types of postural sitting behavior that will be of importance to physical therapists when designing intervention for infants that are delayed or have CP. We hypothesized that linear and nonlinear measures of sitting postural sway variability will be able to differentiate between infants with dissimilar severity of disability as well as describing different types of postural behavior among these 3 groups of infants. Ultimately these measures may be useful in the identification of infants who would benefit from different types of early intervention as well as in the evaluation of various therapeutic protocols.
Methods
Participants
Thirty five infants who were typically developing (TD, mean age ± standard deviation,152.4 ± 8.9 days or 5.1 ± 0.3 months; gender, 18 males and 17 females), 11 infants with developmental delay (DD, mean age ± standard deviation, 360.3 ± 74.8 days or 12 ± 2.5 months) and 19 infants (mean age ± standard deviation, 486.8 ± 175.1 days or 16.2 ± 5.8 months) with DD or hypotonia, who were later diagnosed with spastic or athetoid CP participated in this study (Table 1). Infants were recruited from employee announcements at the campus of the University of Nebraska at Omaha and at the Munroe-Meyer Institute of the University of Nebraska Medical Center, as well as from early intervention programs and therapists from the University of Nebraska Medical Center and the surrounding area. Before data collection commenced, the parents of the infants provided informed consent that was approved by the university human research ethics committee.
Table.
Subject information for the infants included in the developmentally delayed group (DD) and the group with cerebral palsy (CP)
| Subject | Diagnosis at 2 years old |
|---|---|
| C01 | Spastic Quadriplegic CP |
| C02 | Right Hemiplegic CP |
| C03 | Right Hemiplegic CP |
| C04 | Hypotonic, overall delays DD |
| C05 | Developmental Delay DD |
| C06 | Premature (28 weeks), DD |
| C07 | Premature (28 weeks), DD |
| C08 | Spastic lower extremities CP |
| C09 | Hypotonic, overall delays CP |
| C10 | Athetoid CP |
| C12 | Mixed Quadriplegic CP |
| C13 | Spastic Quadriplegic CP |
| C14 | Spastic Quadriplegic CP |
| C15 | Right Hemiplegic CP |
| C17 | Noonan’s Syndrome DD |
| C18 | Athetoid CP |
| C19 | Spastic Hemiplegic CP |
| C20 | Spastic Quadriplegic CP |
| C21 | Hypotonic; motor delay DD |
| C23 | Spastic Quadriplegic CP |
| C24 | Hypotonic, motor delay DD |
| C25 | Spastic Diplegia CP |
| C26 | Motor delay, hearing impaired DD |
| C27 | Premature, motor delay DD |
| C29 | Premature, left hemiplegia CP |
| C30 | Premature, motor delay DD |
| C31 | Hypotonia, motor delay DD |
| C32 | Spastic Quadriplegia CP |
| C34 | Hypotonia, motor delay CP |
| C35 | Hypotonia, overall delay CP |
The inclusion criteria for entry into the study for the infants who were TD were: a) a score on the Peabody Developmental Motor Scale-2, Gross Motor Quotient, within 0.5SD of the mean, b) age between 5 and 7 months and c) sitting independently with or without the use of hands. The exclusion criteria for the typically developing infants were: a) a score on the Peabody Developmental Motor Scale-2, Gross Motor Quotient of greater than 0.5 SD below the mean, b) diagnosed visual deficits, and c) diagnosed musculoskeletal problems. Inclusion criteria for the infants with either CP or DD were: a) age from 7 months to 2 years, b) score less than 1.5 SD below the mean for their corrected age on the Peabody Developmental Motor Scale-2, Gross Motor Quotient, and c) sitting independently even with the use of hands. Exclusion criteria for infants with DD were: a) age over 2 years, b) a score greater than 1.5 SD below the mean for their corrected age on the Peabody Developmental Motor Scale-2, Gross Motor Quotient, and c) a diagnosed visual impairment, or a diagnosed hip dislocation or subluxation greater than 50%.
Experimental Design and Protocol
Each infant participated in 2 sessions. The first session lasted for 45 minutes and was used to perform the Peabody Developmental Motor Scale-2. This standardized test is norm-and criterion-referenced, and examines gross motor function in children from birth to 83 months. The second session, an experimental session, took place within a week.
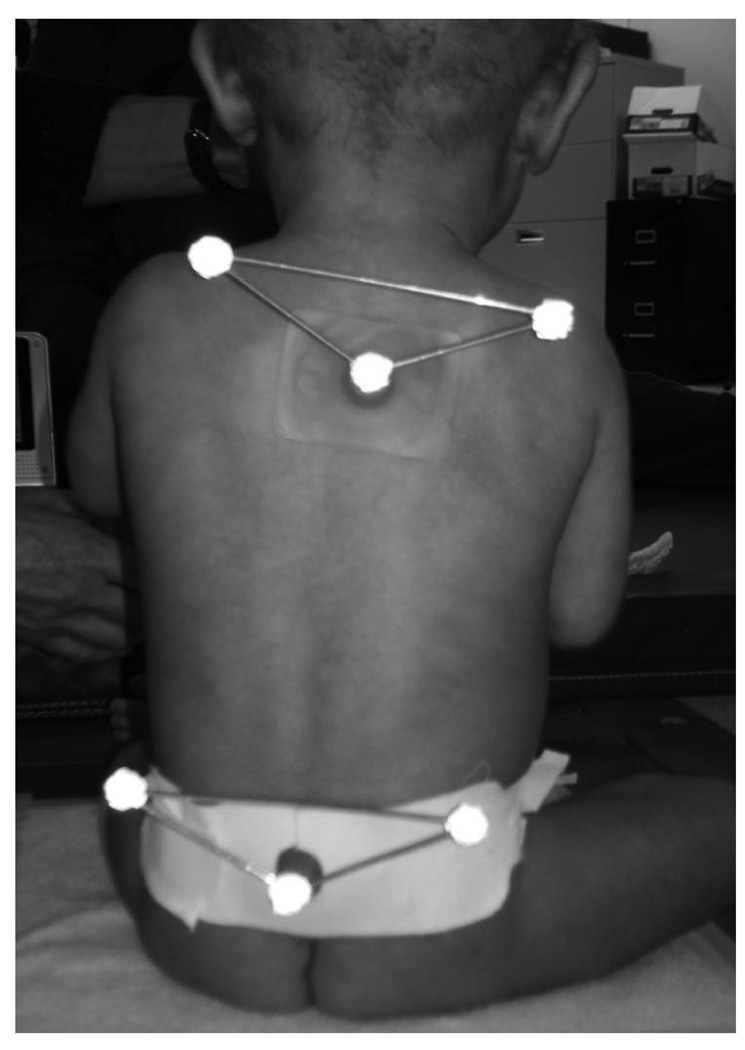
For the experimental session, the infants were allowed time to get used to the laboratory setting, and were at their parent’s side or on the parent’s lap for preparation and data collection. A standard set of infant toys was used for distraction and comfort. All attempts were made to maintain a calm, alert state by allowing the infant to eat if hungry, be held by a parent for comforting, or have the temperature of the room adapted to the infant’s comfort level. After the child was undressed by the mother (only diapers on), 2 sets of triangles with 1 reflective marker in each corner were glued with a double face tape in 2 locations (Figure 1A). However, the marker data were not analyzed for this study.
Figure 1.
Figure 1A Posterior view of the position of the infant during data collection. Kinematic data were not evaluated in this study.
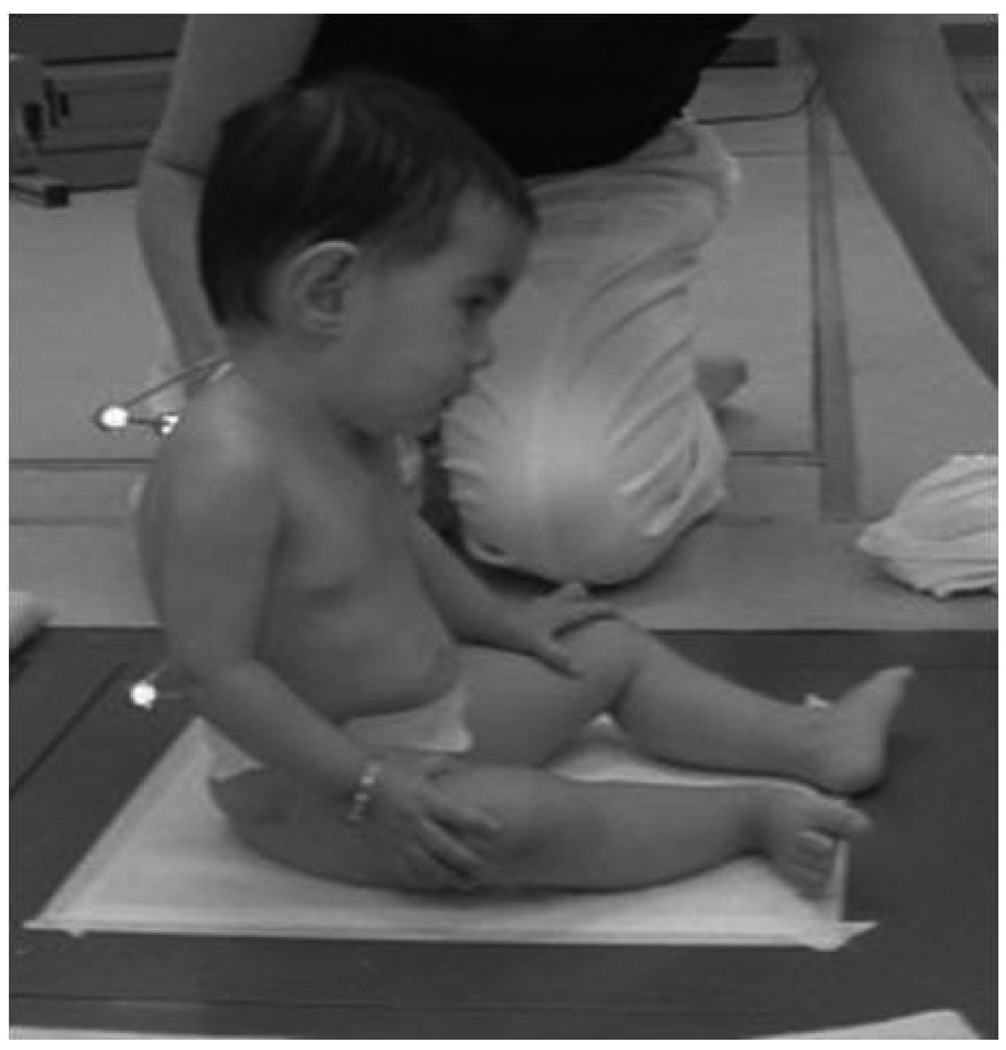
Figure 1B - Side view of the position of the infant during data collection
The infants were then placed by their parent on the top of a force plate that was covered with a special pad for warmth, which was securely adhered with tape on the force plate. The infant was held in the sitting position in the middle of the plate when calm and happy (Figure 1B). The investigator and the parent remained at 1 side and in front of the infant, respectively, during all data collection to assure the infant did not fall or become insecure. The child was held at the thorax for support, and gradually the infant was guided into a prop sitting position while being distracted by toys presented by the parent or the examiner. Once the examiner could completely let go of the infant, data were collected continuously while the child attempted to maintain postural control (Figure 1B). Trials were performed until 3 trials were obtained that were acceptable for our criteria (see below), or until the infants were indicating that they were done. At any time the child became irritated; the data collection was halted for comforting by the parent, or a chance for feeding, and then resumed only when the child was again in a calm state.
Data analysis
For data acquisition, infants sat on an AMTI force plate (Watertown, MA), interfaced to a computer system running Vicon data acquisition software (Lake Forest, CA). COP data from both the anterior-posterior (AP) and the medial-lateral (ML) directions were acquired through the Vicon software at 240 Hz, in order to be above a factor of 10 higher than the highest frequency contained in the signal. No filtering was performed on the data because such a procedure can affect the nonlinear results.16 Video of each trial was collected using 2 Panasonic recorders (Model 5100 HS) interfaced with a Panasonic Digital AV Mixer (Model WJ-MX30). The cameras were positioned to record a sagittal and a frontal view of the subject (Figures 1A and 1B).
Three acceptable trials (8.3sec) were selected from the videotape record using the following criteria: a) infant did not move the arms (not reaching, holding an object, or flapping their arms), b) infant did not vocalize or cry, c) infant was not in the process of falling, d) trunk was not inclined more than 45 degrees to either side, e) not being touched, f) the arm position (propping or not propping) of the infants was noted during the entire trial and only trials in which the infant used a consistent base of support were used.
Linear measures of the variability present in postural sway were calculated from the selected trials using customized MatLab software (Mathworks, Natick, MA) from the COP time series, based on the methodology of Prieto, Myklebust, Hoffmann, Lovett, and Myklebust.17 The linear measures calculated were the root-mean-square (RMS) and the maximum minus minimum (range) for the AP and the ML directions, as well as the length of the path traced by the COP (sway path). These parameters were selected according to Chiari et al18 and they are all independent to the effect of biomechanical factors such as weight, which changes dramatically during development. These linear measures characterized the amount of variability present in the COP data.6
In addition, 3 nonlinear measures of variability were calculated from the selected trials: theapproximate entropy (ApEn), the largest Lyapunov exponent (LyE), and the correlation dimension (CoD) for both the AP and the ML directions. Rather than quantifying the magnitude of variability as the linear measures do, the nonlinear measures are sensitive to temporal ordering in the data. Nonlinear measures of the variability present in postural sway were calculated from the COP time series as described by Harbourne and Stergiou9 and the methodology for these calculations have been published previously.19, 20
Statistical Analysis
All results from the individual trials and experimental sessions were averaged for each infant and for all linear and nonlinear parameters. Thereafter, one-way analysis of variance (ANOVA) with a test for linear trend was performed for comparisons among groups. A Tukey multiple comparison post hoc analysis was used to identify the location of the significant differences for all tests resulting in a significant F-ratio. The alpha level for significance was set at 0.05.
Results
Linear Parameters
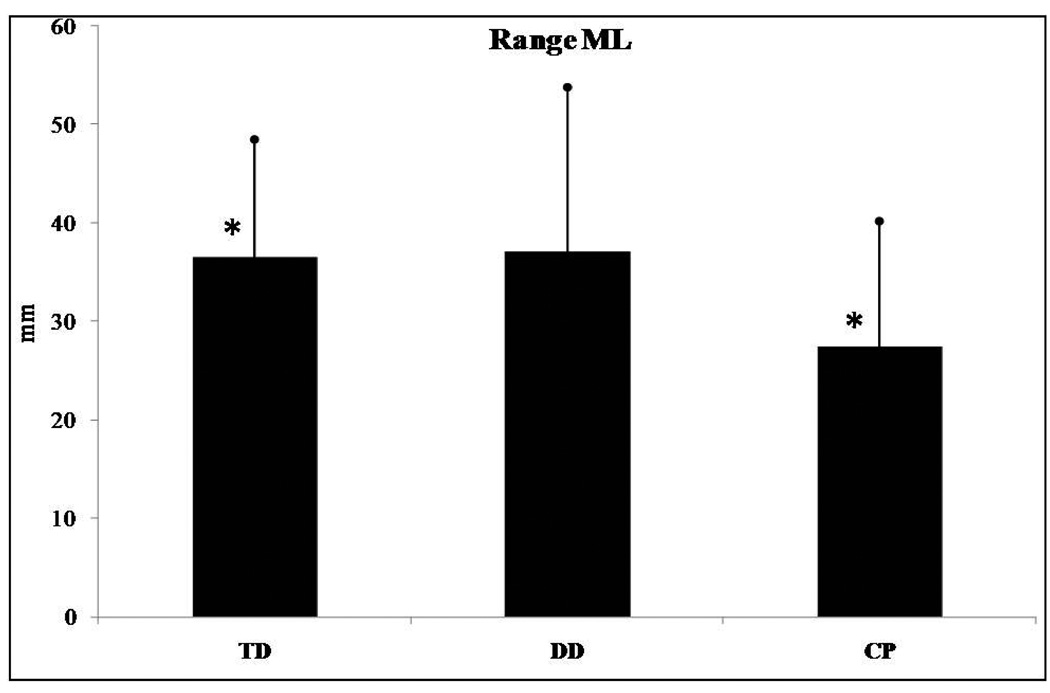
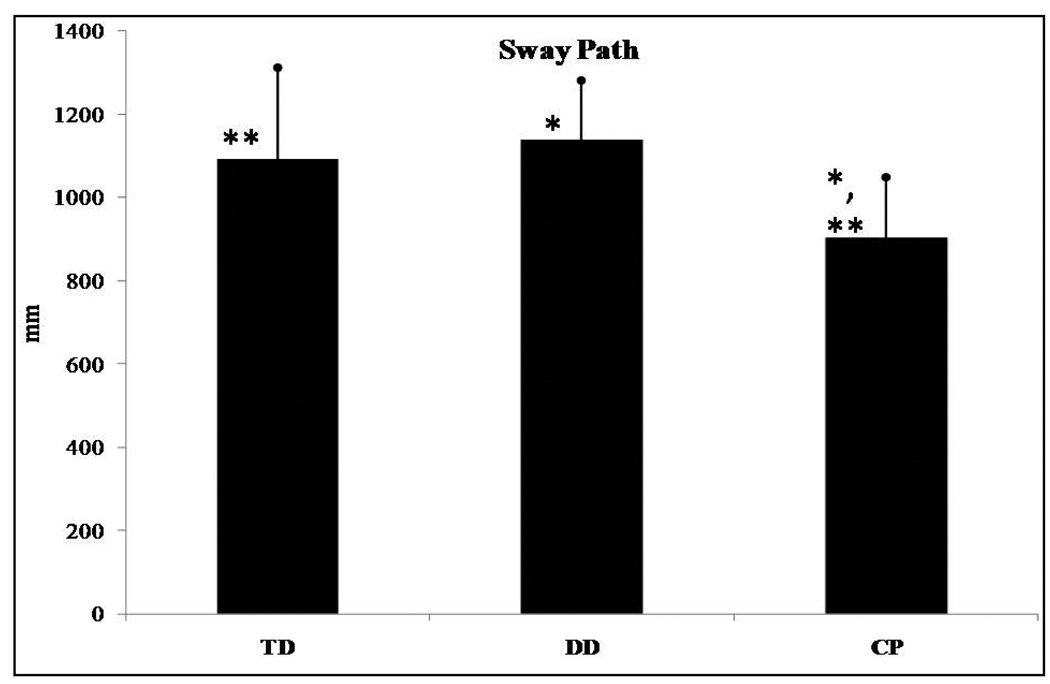
Range in the ML direction (F(2,62)=3.276, p=0.044) and sway path (F(2,62)=7.620, p=0.001) presented significant differences among groups of infants. No significant differences were found for range in the AP direction and RMS in the AP and ML directions. Post hoc analysis revealed that range in the ML direction was significantly different between infants who were TD and those with CP (Figure 2) with infants with CP presenting smaller values than those who were TD. For sway path the post hoc analysis revealed significant differences between those who were TD and the CP groups as well as between the DD and the CP groups. No differences were found between the TD and DD groups. Infants with CP had lower sway path values than infants who were TD or those with DD (Figure 3). Lastly, no statistically significant trend was found in any of the linear parameters examined.
Figure 2.
Range in the mediolateral (ML) direction presented significant differences among the groups of infants. *Asterisk indicates significant differences.
Figure 3.
Sway path presented significant differences among the groups of infants. *Asterisk indicates significant differences.
Nonlinear Parameters
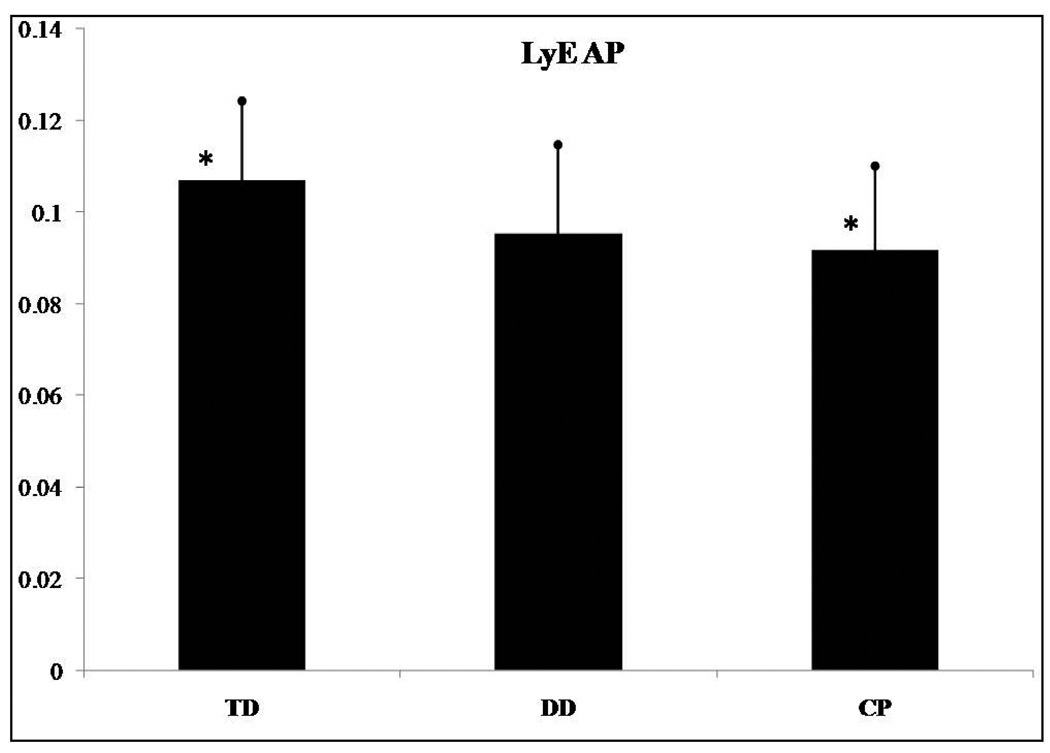
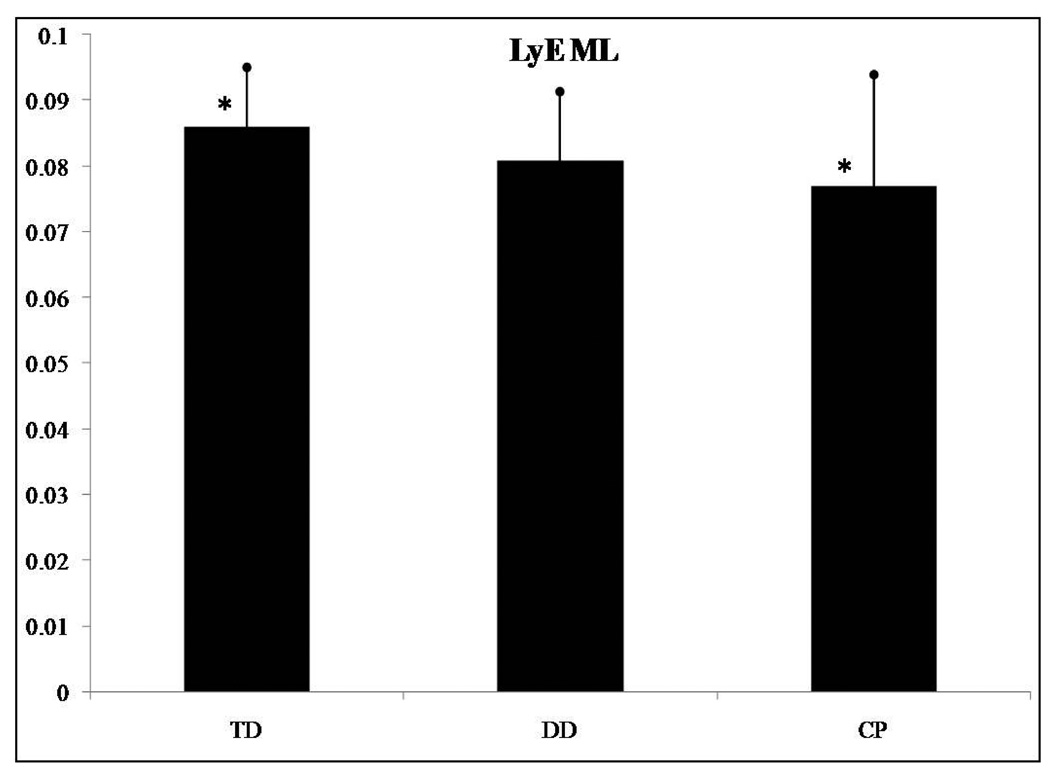
The LyE for the AP (F(2,62)=4.912, p=0.01) and the ML (F(2,62)=3.618, p=0.033) directions presented significant differences among groups of infants. No significant differences were found for the ApEn and the CoD in the AP and ML directions. Post hoc analysis revealed that the LyE for the AP direction was significantly different between infants who were TD and those with CP (Figure 4). Infants with CP presented smaller LyE values than those who were TD. The post hoc analysis of the LyE for the ML direction revealed significant differences between infants who were TD and those with CP (Figure 5). Again, infants with CP presented smaller LyE values than those who were TD. No differences were found between the TD and DD infant groups, nor were differences found between the DD and CP infant groups. Lastly, there was a statistically significant linear trend for LyE in both the AP (F(2,62)=8.742, p=0.004) and the ML (F(2,62)=7.009, p=0.01) directions.
Figure 4.
LyE in the anterior/posterior (AP) direction presented significant differences among the groups of infants. *Asterisk indicates significant differences.
Figure 5.
LyE in the mediolateral (ML) direction presented significant differences among the groups of infants. *Asterisk indicates significant differences.
For all linear and nonlinear variables that presented statistical significant differences, more than 60% of the children followed the group findings.
Discussion
The purpose of the present study was to identify measures of variability in sitting postural sway that are significantly different among infants who are TD, DD ore with hypotonia and infants with spastic or athetoid CP. We hypothesized that linear and nonlinear measures of sitting postural sway variability differentiate infants with varying degrees of disability as well as describe different types of postural behavior among these 3 groups of infants, and this hypothesis was supported. Two linear (range in the ML direction and sway path) and two nonlinear (LyE in AP and ML directions) parameters presented significant differences between infants who were TD and infants with CP, while these same variables did not show a significant difference between infants who were TD and infants with DD.
A secondary goal was to identify types of postural sitting behavior that are of importance to physical therapists when treating infants who present DD or have CP. Infants who are TD and those with DD present similar amounts of variability as described by the range variable, while infants with CP have a reduced amount of range. Our analysis indicated that range, specifically in the ML direction, was decreased in infants with CP. These results suggest that infants with CP, who acquire the sitting skill, present a rather stiff posture, especially in the ML direction, indicating a particular lack of variability for movement within the frontal plane. Another linear variable, sway path, indicated decreased amount and velocity of movement adjustments of the COP in infants with CP as compared to the infants who are TD or who demonstrate DD. Thus, both range in the medial-lateral direction and velocity of changes in the path of the COP could be the focus of intervention in infants with CP who are learning to sit.
In addition, the temporal organization of postural sitting behavior declined with the severity of the motor disorder from those with TD to those with DD to the infants with CP. Infants with TD had more divergence in the postural sway trajectories (higher LyE values), which indicates greater adaptability and flexibility to achieve the sitting skill by choosing from a wealth of postural solutions. In contrast, infants with DD were less flexible than infants who were TD (smaller LyE values; Figures 4 and 5), whereas infants with CP were the least flexible. Infants with CP seem to lock into a very limited repertoire of postural solutions, which makes it difficult to adapt to changing environmental conditions and to sit independently. If we will consider that the TD infants are behaving in a more optimal state of variability, then the severity of the condition pushes the system further away from this behavior and this optimal state.8 Interventions could target a transition towards this optimal state by incorporating environmental challenges and enhancing postural solutions. This may then enhance adaptability and flexibility.8
By characterizing the temporal organization of the variability present in the COP patterns (i.e. nonlinear analysis) or, in other words, how the movement evolves over time we were able to show how the postural sway of DD infants is different from infants who were TD and those with CP. The significant linear trend of LyE in both the AP and ML directions suggests that infants who are TD are able to maintain their sitting posture successfully when internal perturbations affect the dynamics of the system. Decreasing values of LyE across groups of developmental delay suggests decreased dynamic control and ability to explore the environment in contrast with infants with no delay that show optimal dynamic control. Therefore, in terms of early intervention approaches, therapists should be enhancing exploration of multiple postural behaviors to make the behavior of both infants with DD and infants with CP more diverse and thus adaptable to different conditions.
There are a few limitations that need to be acknowledged. First, because we enrolled infants just as they were able to sit upright, the DD and CP groups were older than the infants who were TD. The difference in age may contribute to differences in postural strategies. However, our assessments of motor skills ensured a similar entry point in the research study. Another limitation was that we did not include infants who had mild delays (between 0.5 and 1.5 SD from the mean in the Peabody Gross Motor Scale) and inclusion of these infants may alter the findings. We plan to explore such infants in future studies. We realize that these are the very children that are a dilemma for the health professionals and those working in early assessment clinics. Furthermore, because nonlinear measurement tools require the use of mathematical equations and software to evaluate time series data, nonlinear analysis is primarily done in research settings. This makes the translation of the concepts to the clinic more difficult. However, we anticipate that in the future, improvements in and the decreasing cost of technology will allow such devices to become more prevalent, and that clinical decision making will incorporate technical advances such as nonlinear measures of time series data to determine optimal intervention, and the success of these interventions. It is possible that these procedures will be used with a portable force platform to improve assessment within the home and outside of the clinic. The cost of such equipment will likely be offset by the benefits of improvements in the prognosis and intervention approaches.
Conclusions
This research determined that linear and nonlinear analysis of COP time series during sitting in infants who are TD, DD or with CP could be a useful, objective and quantitative method of distinguishing between different degrees of developmental delay and types of postural behaviors. Therefore, the evaluation of sitting postural control using linear and nonlinear tools to analyze COP time series appears to be a viable method for the early quantification of postural control,. This method can be used to document incremental changes in sitting postural control that may result from interventions for infants with motor deficiencies. In addition, our findings have additional clinical implications supporting the notion that therapists should encourage variability and multiple postural strategies during intervention designed to address goals related to sitting independence.
Acknowledgments
Grant Support: This work was supported by NIH (K25HD047194), NIDRR (H133G040118), the Bukey and MacDonald Fellowship from the University of Nebraska Medical Center.
Footnotes
Publisher's Disclaimer: This is a PDF file of an unedited manuscript that has been accepted for publication. As a service to our customers we are providing this early version of the manuscript. The manuscript will undergo copyediting, typesetting, and review of the resulting proof before it is published in its final citable form. Please note that during the production process errors may be discovered which could affect the content, and all legal disclaimers that apply to the journal pertain.
References
- 1.Kyvelidou A, Stuberg WA, Harbourne RT, Deffeyes JE, Blanke D, Stergiou N. Development of upper body coordination during sitting in typically developing infants. Pediatr Res. 2009;65:553–558. doi: 10.1203/PDR.0b013e31819d9051. [DOI] [PMC free article] [PubMed] [Google Scholar]
- 2.Hadders-Algra M, Brogren E, Forssberg H. Ontogeny of postural adjustments during sitting in infancy: variation, selection and modulation. J Physiol. 1996;493:273–288. doi: 10.1113/jphysiol.1996.sp021382. [DOI] [PMC free article] [PubMed] [Google Scholar]
- 3.van der Heide JC, Otten B, van Eykern LA, Hadders-Algra M. Development of postural adjustments during reaching in sitting children. Exp Brain Res. 2003;151:32–45. doi: 10.1007/s00221-003-1451-3. [DOI] [PubMed] [Google Scholar]
- 4.Harbourne RT, Stergiou N. Nonlinear analysis of the development of sitting postural control. Dev Psychobiol. 2003;42:368–377. doi: 10.1002/dev.10110. [DOI] [PubMed] [Google Scholar]
- 5.Bertenthal BI, Rose JL, Bai DL. Perception-action coupling in the development of visual control of posture. J Exp Psychol Hum Percept Perform. 1997;23:1631–1643. doi: 10.1037//0096-1523.23.6.1631. [DOI] [PubMed] [Google Scholar]
- 6.Stergiou N, Harbourne R, Cavanaugh J. Optimal movement variability: a new theoretical perspective for neurologic physical therapy. J Neurol Phys Ther. 2006;30:120–129. doi: 10.1097/01.npt.0000281949.48193.d9. [DOI] [PubMed] [Google Scholar]
- 7.Pincus SM, Gladstone IM, Ehrenkranz RA. A regularity statistic for medical data analysis. J Clin Monit. 1991;7:335–345. doi: 10.1007/BF01619355. [DOI] [PubMed] [Google Scholar]
- 8.Harbourne RT, Stergiou N. Movement variability and the use of nonlinear tools: principles to guide physical therapist practice. Phys Ther. 2009;89:267–282. doi: 10.2522/ptj.20080130. [DOI] [PMC free article] [PubMed] [Google Scholar]
- 9.Harbourne RT, Stergiou N. Nonlinear analysis of the development of sitting postural control. Dev Psychobiol. 2003;42:368–377. doi: 10.1002/dev.10110. [DOI] [PubMed] [Google Scholar]
- 10.Campbell SK. The infant at risk for developmental disability. In: Campbell SK, editor. Decision Making in Pediatric Neurologic Physical Therapy. Philadelphia, PA: Churchhill Livingstone; 1999. pp. 260–332. [Google Scholar]
- 11.Campbell SK, Wilhelm IJ. Development from birth to 3 years of age of 15 children at high risk for central nervous system dysfunction. Interim report. Phys Ther. 1985;65:463–469. doi: 10.1093/ptj/65.4.463. [DOI] [PubMed] [Google Scholar]
- 12.Hadders-Algra M. Evaluation of motor function in young infants by means of the assessment of general movements: a review. Pediatr Phys Ther. 2001;13:27–36. [PubMed] [Google Scholar]
- 13.Palmer FB. Strategies for the early diagnosis of cerebral palsy. J Pediatr. 2004;145:S8–S1. doi: 10.1016/j.jpeds.2004.05.016. [DOI] [PubMed] [Google Scholar]
- 14.Nelson KB, Ellenberg JH. Children who “outgrew” cerebral palsy. Pediatrics. 1982;69:529–536. [PubMed] [Google Scholar]
- 15.Hadders-Algra M, van der Heide JC, Fock JM, Stremmelaar E, van Eykern LA, Otten B. Effect of seat surface inclination on postural control during reaching in preterm children with cerebral palsy. Phys Ther. 2007;87:861–871. doi: 10.2522/ptj.20060330. [DOI] [PubMed] [Google Scholar]
- 16.Stergiou N, Buzzi UH, Kurz MJ, Heidel J. Nonlinear tools in human movement. In: Stergiou N, editor. Innovative analyses for human movment. Champaign, IL: Human Kinetics Publishers; 2004. pp. 63–90. [Google Scholar]
- 17.Prieto TE, Myklebust JB, Hoffmann RG, Lovett EG, Myklebust BM. Measures of postural steadiness: differences between healthy young and elderly adults. IEEE Trans Biomed Eng. 1996;43:956–966. doi: 10.1109/10.532130. [DOI] [PubMed] [Google Scholar]
- 18.Chiari L, Rocchi L, Cappello A. Stabilometric parameters are affected by anthropometry and foot placement. Clin Biomech (Bristol, Avon) 2002;17:666–677. doi: 10.1016/s0268-0033(02)00107-9. [DOI] [PubMed] [Google Scholar]
- 19.Kyvelidou A, Harbourne RT, Stuberg WA, Sun J, Stergiou N. Reliability of center of pressure measures for assessing the development of infant sitting postural control. Arch Phys Med Rehabil. 2009;90:1176–1184. doi: 10.1016/j.apmr.2009.01.031. [DOI] [PMC free article] [PubMed] [Google Scholar]
- 20.Harbourne RT, Deffeyes JE, Kyvelidou A, Stergiou N. Complexity of postural control in infants: linear and nonlinear features revealed by principal component analysis. Nonlinear Dynamics Psychol Life Sci. 2009;13:123–144. [PubMed] [Google Scholar]


