Abstract
Dynamic field gradient focusing (DFGF) separates and concentrates proteins in native buffers, where proteins are most soluble, using a computer-controlled electric field gradient which lets the operator adjust the pace and resolution of the separation in real-time. The work in this paper assessed whether DFGF could be scaled up from microgram analytical-scale protein loads to milligram preparative-scale loads. Linear modeling of the electric potential, protein transport, and heat transfer simulated the performance of a preparative-scale DFGF instrument. The electric potential model showed where the electrodes should be placed to optimize the shape and strength of the electric field gradient. Results from the protein transport model suggested that in 10 min the device should separate 10 mg each of two proteins whose electrophoretic mobilities differ by 5 ×. Proteins with electrophoretic mobilities differing by only 5% should separate in 3 h. The heat transfer model showed that the preparative DFGF design could dissipate 1 kW of Joule heat while keeping the separation chamber at 25°C. Model results pointed to DFGF successfully scaling up by 1000 × using the proposed instrument design.
Keywords: Design, Dynamic field gradient focusing, Modeling, Preparative electrophoresis
1 Introduction
Dynamic field gradient focusing (DFGF) has been demonstrated at the analytical scale [1, 2] and represents a broad class of equilibrium gradient methods (EGMs) that might prove useful at the preparative scale for separating electrically charged analytes, e.g., proteins. In general, EGMs use a gradient in the net force acting on an analyte such that the net force sums to zero at some point, which is the focal point for the analyte [3]. Giddings and Dahlgren [3] specifically listed IEF and density gradient sedimentation as examples of EGMs and mentioned the use of nonuniform electric or thermal fields as means for devising still more EGMs. Ivory [4] later analyzed the flux equation of an electrophoretic separation to describe several alternative electrofocusing techniques which use an electric field in an EGM. His paper also reviews the known implementations of alternative electrofocusing techniques up to the year 2000. Kelly and Woolley [5] more recently reviewed the application of electric fields in EGMs and Ivory [6] has suggested how to apply EGMs in microscale, multidimensional separations. EGMs show a wealth of potential means for separating proteins, with most current practitioners studying applications revolving around electric field gradients at the analytical scale.
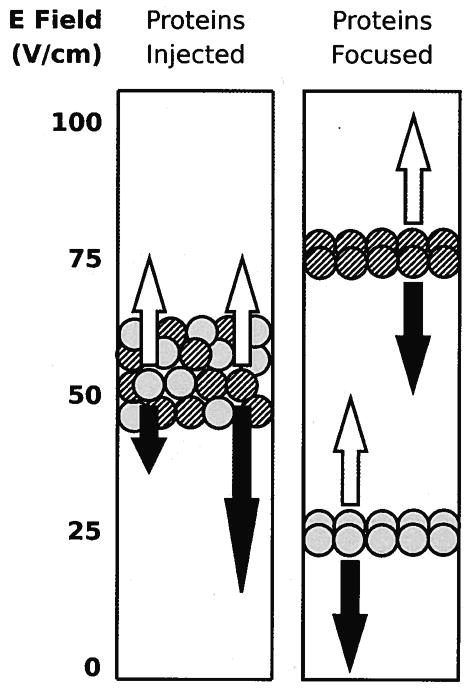
DFGF simultaneously separates and concentrates proteins, similar to IEF. However, unlike IEF, DFGF requires no pH gradient, and hence, no expensive carrier ampholytes. Instead, an electric field gradient, which increases in magnitude with column height (see far left of Fig. 1), pushes proteins down a separation chamber. The downward velocity of each protein, which decreases as the protein moves down the separation chamber, equals the product of the protein’s electrophoretic mobility and the electric field. At the same time, the counterflow buffer constantly pushes the proteins in the opposite direction; back up the chamber. The resulting net velocity varies for each protein and causes the proteins to migrate down or up the chamber until they reach their individual focal points where the velocity imparted by the electric field balances the counterflow. Thus, proteins with different electrophoretic mobilities separate and focus at unique heights in the separation chamber. This alternative focusing technique ameliorates precipitation issues typically seen in IEF because the counterflow buffer can have a pH far from the proteins’ pI so that the proteins are more soluble [7]. The adjustable, computer-controlled electric field gradient provides the unique, dynamic aspect of DFGF, allowing for real-time adjustment of the separation as it progresses.
Figure 1.
The rectangle at left represents a separation chamber with a mixture of proteins injected into the middle of the chamber. The mobility of the gray protein exceeds that of the striped protein. An electric field increases in strength with the height of the chamber and pushes the proteins downward with a velocity (black arrows) proportional to the product of the field strength and mobility. A counter flow generated by a pump pushes the proteins upwards at a constant velocity (white arrows). The rectangle on the right shows the proteins focused at heights where the two velocities balance each other.
This paper marks the start of our effort to bring the advantages of DFGF to the preparative scale, where tens to hundreds of milligrams of protein are processed. The first step on this path was to assemble a simple, qualitative model that would predict whether DFGF could scale-up. This model did not need to be complicated at this point because there was no physical device that could be run to produce data that would show that a complicated model produced a better estimate than a simple model. For example, Greenlee and Ivory [8] found that a simple, linear, qualitatively correct model under predicted how well his conductivity gradient focusing device performed, while Koegler and Ivory [9] achieved only qualitative agreement between the results of a complicated, nonlinear model and the data from her field gradient focusing unit. Therefore, nonlinear effects, like those described in other models [9, 10], were not included in the model used here. Nonlinear models will play a diagnostic and refining role once a preparative-scale DFGF instrument is designed, built, and running.
Two texts in particular can help one to understand and formulate models pertaining to electrophoresis: Electrochemical Systems, by Newman [11], and The Dynamics of Electrophoresis, by Mosher et al. [12]. As pointed out earlier, the literature was also a helpful source of information about modeling field gradient focusing techniques. Koegler and Ivory [9] have already laid out the equations for a 1-D model of the steady state concentration profiles that result from focusing proteins in a static electric field gradient generated by varying the cross-sectional area of the apparatus. Their nonlinear model allowed the ions to influence the shape of the electric field, which showed that focusing sufficient amounts of protein can distort the shape of the electric field gradient [9]. A short time later, Greenlee and Ivory [8] published a linear model for focusing in an electric field gradient generated by a salt gradient, disregarding the effect of focused proteins on the electric field. More recently, Wang et al. [13] have repeated the derivation of equations that describe focusing in electric field gradients. They also restricted their model to linear systems where the ionic distributions do not affect the electric field. Wang et al. differentiated their work by taking an approach similar to that of Giddings and Dahlgren [3]; using the first order and lower terms of Taylor expansions to approximate the shape of an arbitrary electric field around the protein’s focal point.
The work in this paper modeled the electric field, protein transport, and heat transfer within a preparative-scale DFGF instrument. This simulated the performance of a preparative DFGF apparatus accurately enough for design work. Unlike preceding work, the equations were solved in a complex 2-D domain corresponding to the cross-section of our preparative-scale DFGF instrument. The results of the models yielded a preliminary design for the prototype preparative-scale DFGF instrument, demonstrating the usefulness of this approach for other workers who wish to scale different techniques.
2 Preparative DFGF design
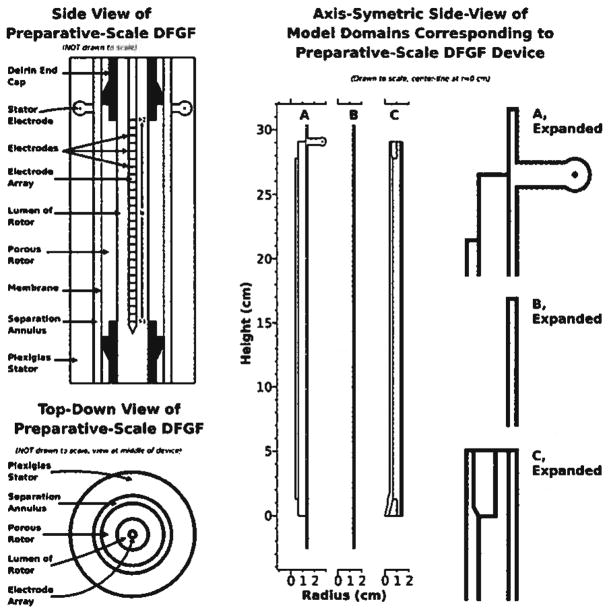
Designing the preparative DFGF instrument began by determining what physical phenomena govern the performance of the focusing technique in order to choose the appropriate equations to model. Having these key scaling criteria in hand guided the development of the preparative DFGF instrument design. In turn, the design provided the domain, or geometry, for the model, as shown in Fig. 2. Then physical parameters, listed in Table 1, and boundary conditions for the governing equations were specified prior to solving the equations.
Figure 2.
The two left-most drawings show side and top-down views of the vortex-stabilized electrophoresis chamber modified to perform DFGF. The electrode array fits in the rotor’s lumen. Cooling buffer flows over the electrode array and the electrode located in the stator. A membrane coats the surface of the porous ceramic rotor to keep proteins in the separation annulus. A dialysis membrane segregates the separation annulus from the buffer flowing over the stator electrode. The model domains, in the center and expanded on the right of the figure, represent portions of the device shown on the left of the figure. Domain A is used for calculating the electric potential. Protein transport is solved in the simple rectangular domain B, which represents the separation annulus. Domain C covers the parts of the system relevant to heat transfer.
Table 1.
Constants in simulations
| Property | Units | |
|---|---|---|
| κ Buffera) | 0.05 | S/m |
| μ BSA [23] | −1.5 × 10⁻⁸ | m2/V/s |
| μ FMP | 0.95 μ BSA | m2/V/s |
| μ Hb [23] | −3.5 × 10⁻⁹ | m2/V/s |
| ρ Bufferb) [24] | 999.7 | kg/m3 |
| k Bufferb) [20] | 0.580 | W/m/K |
| k Rotorc) | 121 | W/m/K |
| k Delrind) | 0.37 | W/m/K |
| Cp Bufferb) [20] | 4.1921 × 10³ | J/kg/K |
| Tinlet | 5 | °C |
The simulated buffer has the conductivity similar to 10 mM Tris titrated with acetic acid to pH 7.5.
This property of the simulated buffer was assumed to be equivalent to water.
From Saint-Gobain’s product data at http://www.bn.saint-gobain.com/Data/Element/Product/product.asp?ele_ch_id=P0000000000000001635. The value seems to have increased to 130 W/m/K since the modeling work was done.
From DuPont’s Delrin Design Guide, located at http://plastics.dupont.com/myplastics/Mediator?id=35&p=1&locale=en_US.
The first key aspect of DFGF is the electric field, since it provides the gradient force in this EGM. The preparative scale instrument will require an electrode array in electrical contact with a separation chamber. A membrane of some variety, e.g., cellulose-acetate or polysulfone, will need to divide the separation chamber from the electrode array in order to keep proteins in the separation chamber. The membrane should have a molecular weight cut off approximately 1/10 of the size of the proteins to be retained. The resistance to the passage of current through the membrane needs to be minimal for DFGF so that the electric field gradient’s strength in the separation chamber does not degrade substantially.
Power requirements lead to the second key scaling criterion: heat removal. Passing current through a resistive material produces Joule heating. The heat produced in the preparative DFGF device will increase proportionally with the applied electric field strength. Uncontrolled Joule heating leads to an autothermal effect [14] which would eventually boil the buffer [15], and cause arcing in the separation chamber. Heating will also denature proteins [7], robbing them of function. Designing forced, liquid cooling into the preparative DFGF apparatus will prevent the deleterious effects of Joule heating and allow the device to run on a lab bench, rather than inside a cold room.
The third key to scaling up DFGF comes from Greenlee’s work [8]. Reducing dispersion in his separation chamber significantly improved the results compared to working in free solution. The analytical DFGF instrument uses a packed column for this very reason [2]. Likewise, dispersion will need to be controlled in the preparative scale DFGF instrument. However, a preparative-scale electrophoresis device should not rely on using a chromatographic packing or even a gel because they both have very poor thermal conductivity and make cooling the instrument substantially more difficult [16]. The proposed design will have to control dispersion while performing electrophoresis in free solution. A solution that satisfies this criterion will dictate the rest of the design.
An existing electrophoresis instrument that controls dispersion and Joule heating would make a good starting point for proposing a new instrument design to perform preparative-scale DFGF. The vortex-stabilized electrophoresis apparatus described by Ivory [17] satisfies the key scaling criteria regarding dispersion and heat removal. It controls dispersion in free solution by using a shaped boron nitride rotor turning within a shaped, transparent, acrylic stator to generate a stable fluid flow profile in the separation annulus formed between the rotor and stator. The apparatus controls Joule heat in the separation chamber by circulating chilled silicone oil through the lumen of the high thermal conductivity ceramic rotor. An epoxy filling plugs the pores in the boron nitride ceramic to keep the low viscosity silicone cooling oil out of the separation chamber. Basing the preparative DFGF design on the vortex-stabilized electrophoresis chamber satisfied the second and third scaling criterion by controlling dispersion and providing a mechanism for cooling. Incorporating an electrode array into the vortex-stabilized chamber to satisfy the first scaling criterion required modifying the chamber first.
The porosity of the boron nitride ceramic rotor led us to add an electrode array to the vortex-stabilized chamber by placing the array in the lumen of the rotor, as shown in Fig. 2. However, this solution would also cause proteins to be drawn into the pores of the rotor, so a membrane should cover the surface of the rotor to keep proteins in the separation annulus. Membrane polarization should not pose a problem because the vortices in the separation annulus should prevent protein build up by sweeping along the surface of the membrane. Cooling buffer could replace the silicone oil that flows in the lumen of the vortex-stabilized chamber’s rotor, although the electrified cooling buffer should not directly run through the chiller because the electrified cooling buffer would corrode and possibly short out the chiller. Instead, the cooling buffer would need to recirculate between the rotor’s lumen and an electrically insulated, e.g., glass or plastic, heat exchanger cooled by silicone oil circulating through the chiller. Samples, up to 20 mL, could be injected by syringe into the base of the 25 mL separation annulus. Larger volumes of dilute protein solution could be fed into the chamber over longer time periods by using the counterflow pump.
Electrophoretic techniques, like DFGF, IEF, SDS-PAGE, and zone electrophoresis, are typically limited by three impediments: heat removal, sample dispersion, and loading considerations [18]. The theoretical, preparative-scale DFGF apparatus overcomes the first two limitations, as described above. Despite this, the device modeled in this paper will probably still have loading limitations. In particular, the nonlinear modeling done by Koegler and Ivory [9] shows that maximum protein concentrations should be limited to 8 mg/mL in order to prevent severe deformation of the electric field profile. That imposes an upper limit of 200 mg of protein in the 25 mL separation annulus described above. Sample complexity presents another possible loading consideration, which would be dealt with in the manner described and modeled by Huang and Ivory [1] for the analytical scale device. Namely, modifying the shape of electric field gradient such that one of the many peaks is resolved from the rest so that it can be removed via the off-take ports, and then modifying the field again to isolate and remove the next protein, and so on.
3 Model development
A set of three linear models in cylindrical coordinates described the electric field (Laplace’s equation), protein transport (Laplace’s equation and mass conservation), and heat transfer (thermal energy equation), respectively, within the virtual, preparative-scale DFGF device. These linear models neglected the interactions between ions, Joule heating, and conductivity, which uncoupled the model equations and allowed each model to be solved individually. These assumptions limited the simulations to only qualitatively predicting the location and width of separated protein peaks, which was sufficient for assessing the scalability of DFGF. The reader interested in modeling other electrochemical systems should consult Newman’s book [11] for guidance in applying the principles of current and mass conservation in their particular system of interest since the constants and assumptions used hereafter do not apply to all systems.
3.1 Electric field model
The derivation of the model for the electric field in simulations 1–7, like Greenlee’s model [8], was based on the equations presented in Newman’s book [11]. This approach ignored the effect of focused proteins on the electric field, and assumed constant velocities and developed flow profiles. However, the model that follows solved for electric potential, rather than solving for current density like Greenlee’s model did [8].
As explained in chapter 11 of Electrochemical Systems, the electric field, φ, in a region of conductivity, κ, obeys Laplace’s equation,
| (1) |
in the absence of concentration gradients in the conducting ions when electroneutrality applies [11]. Equation (1) was solved within the rotor’s lumen, the porous rotor, the separation annulus, and the stator electrode housing. Those regions comprised domain A, shown in Fig. 2 with all regions at proper scale. In this model, electric insulation (see Chapter 18 of Electrochemical Systems),
| (2) |
applied on the external boundaries of domain A, except between h1 = 1.9050, and h2 = 27.1780 cm on the electrode array, where the potential was a function of height defined by
| (3) |
one of three parabolic voltage profiles specified in Table 2. The large, continuous electrode, of length le = h2 − h1, (see Fig. 2), represented an unspecified number of discrete electrodes on the electrode array. The stator electrode used equation 2 as a boundary condition when it was turned off in a simulation and used
Table 2.
Conditions for electric field simulations
| Equation, domain (Fig. 2) | Rotor conductivity (S/m) | Voltage profile on electrode array (V) | Stator electrode | |
|---|---|---|---|---|
| Simulation 1 | 1, A | 0.05 | Φ1 (h) = 5000 (1 − 1((h − h1)/le)2) | Off |
| Simulation 2 | 1, A | 0.05/10 | Φ1 (h) = 5000 (1 − 1((h − h1)/le)2) | Off |
| Simulation 3 | 1, A | 0.05/100 | Φ1 (h) = 5000 (1 − 1((h − h1)/le)2) | Off |
| Simulation 4 | 1, A | 0.05/1000 | Φ1 (h) = 5000 (1 − 1((h − h1)/le)2) | Off |
| Simulation 5 | 1, A | 0.05/100 | Φ1 (h) = 5000 (1 − 1((h − h1)/le)2) | Ground |
| Simulation 6 | 1, A | 0.05/100 | Φ2 (h) = 5000 (1 −0.79((h − h1)/le)2) | Ground |
| Simulation 7 | 1, A | 0.05/100 | Φ3 (h) = −3092 h2 − 17340 h + 5331 | Ground |
| (4) |
when it was set to ground in a simulation. Table 2 lists the status of the stator electrode in each simulation.
The electrical conductivity in domain A for simulations 1–7 was 0.05 S/m (Table 1), approximately the conductivity of a 10 mM Tris buffer titrated to pH 7.5 with acetic acid, except between the rotor’s inner and outer walls. The rotor material itself will not carry electrical current, but its buffer-filled pores will let current pass through the rotor. Thus, the estimated conductivity in the rotor equaled the conductivity of the buffer multiplied by the porosity of the rotor. However, tortuosity and any membrane applied to the surface of the rotor will also reduce the effective conductivity of the rotor. Therefore, simulation 2–4 examined multiple cases assuming 10, 100, and 1000 × reductions in conductivity within the rotor. The 10 × reduction approximated the case where only the 13% porosity of the ceramic rotor hinders current passage, while the 100 and 1000 × reductions simulated additional resistance due to membranes. Simulation 1 also included the case of no added resistance in the rotor for the sake of comparison. Testing the four possible conductivities for the rotor let us establish a maximum acceptable reduction in effective rotor conductivity for use in simulations 5–7.
Simulations 5 and 6 used the remote electrode in the stator as a cathode and changed the voltage profile on the electrode array to provide a stronger, more linear electric field in the separation annulus. An exceptionally shallow electric field gradient required for separating highly similar proteins came from the voltage profile used in simulation 7.
3.2 Protein transport model
The protein transport model, like the electric field model, was based on the equations in Chapter 11 of Electrochemical Systems [11] and neglected the effect of focused proteins on the electric field, and assumed constant velocities and developed flow profiles. The electric field, −∇Φ, coupled with the counter flow, v, and mechanical dispersion create a molar flux vector, Ni, for the ith protein
| (5) |
wherein D represents the axial dispersion coefficient, zi the charge, μi the absolute mobility, and F the Faraday constant. The net charges were held constant because pH did not vary in this simple model. The axial dispersion coefficient replaces the diffusion coefficients because the vortices in the separation annulus keep the proteins mixed radially and dispersed axially due to the counter-rotating nature of the vortices [17]. The absolute mobility, μi, relates to the more familiar electrophoretic mobility, μi, by
| (6) |
The transient material balance for the ith protein becomes
| (7) |
in the absence of chemical reactions that affect the protein. Solving the transient problem let us determine how long runs will take so that they could be designed to finish in an acceptable amount of time, i.e., a few hours, rather than days.
Mass conservation, Eq. (7), only needed to be solved in the separation annulus, domain B in Fig. 2, because the combination of membranes and other solid materials that form the separation annulus’ walls would prevent the proteins from leaving the domain. Therefore, the stator and rotor walls of domain B had no flux boundary conditions,
| (8) |
for each of the focusing proteins. The inlet at the bottom of domain B used fixed concentration boundary conditions,
| (9) |
for each protein, because the counterflow buffer entering there had no protein in it. Instead, 10 mg of each protein was distributed as a Gaussian peak centered at h = 15 cm in the separation annulus to approximate the injection of a protein mixture into the middle of the separation annulus. The initial protein concentration profiles in simulation 5 were given by
| (10) |
The outlet at the top of the separation annulus used convective flux boundary conditions,
| (11) |
which assumed that only the net velocity would push proteins out the top of the separation annulus.
Simulation 8 assumed that the vortices, which stabilize axial dispersion, would radially mix the separation annulus’ contents and make the protein concentration radially uniform. Therefore, Eq. (7) only needed to be solved for the axial motion of the proteins. The axial dispersion introduced by the mixing action of the vortices, on the order of 2 × 10⁻⁸m2/s [17], exceeded the diffusion coefficients of the proteins in the model. Hence, the dispersion coefficient in the chamber replaced the diffusion coefficients of the BSA, bovine hemoglobin (Hb), and fictitious model protein (FMP) used in simulation 8. Setting the electrophoretic mobility of FMP to 95% of BSA’s mobility corresponded to a charge difference of one; the kind of difference expected between isoforms. The Hb separated easily from the other two proteins; so, at 1801 s we reduced the slope of the electric field gradient and decreased the counterflow, as specified in Table 3, to resolve the pair of similar proteins. The electric field gradient in the separation annulus for simulation 8 was governed by the same assumptions, equations, and boundary conditions as described in electric field model simulations 6 and 7. Therefore, the electric field gradients from simulations 6 and 7 could be directly inserted into the protein transport model because domain B was just a subsection of domain A, the boundary conditions had not changed, and the solutions to simulations 6 and 7 were independent of the protein’s behavior.
Table 3.
Conditions for protein transport simulation
| Equation, domain (Fig. 2) | Rotor conductivity (S/m) | Voltage profile electrode array (V) | Stator electrode | Counterflow (mL/min) | |
|---|---|---|---|---|---|
| Simulation 8 | 7, B | 0.05/100 | |||
| t< 1800 s | Φ2(h) = 5000 (1 − 0.79 ((h −h1)/le)2) | Ground | 3.3481 | ||
| t≥1801 s | Φ3 (h) = −3092 h2 − 17340 h + 5331 | Ground | 2.4244 |
3.3 Heat transfer model
The heat transfer model estimated how much power the preparative DFGF instrument could dissipate while keeping the separation chamber at about 25°C. A simple energy balance in terms of temperature, T, estimated the cooling ability of the instrument in simulations 9–11. The steady-state energy balance,
| (12) |
contains terms for convection, conduction, and the power density, q. Density, ρ, heat capacity, Cp, velocity, v,. and thermal conductivity, k, varied throughout the model according to the material composing the various parts of the instrument.
Domain C, shown in Fig. 2 for simulations 9–11, included the lumen of the rotor, the porous rotor, the separation annulus, and the Delrin caps. All external walls on the domain were considered insulated,
| (13) |
except for the fluid inlets and outlets of the separation annulus and the rotor’s lumen. The inlets used a constant temperature boundary condition of 5°C, or, in Kelvin,
| (14) |
while the outlets were set to
| (15) |
because only fluid flow would carry heat out of the preparative DFGF instrument. Table 1 lists the physical constants applicable to simulations 9–11, while Table 4 lists the parameters that varied between simulations 9–11. Interconversion between mechanical and thermal energy was neglected in the heat transfer model.
Table 4.
Conditions for heat transfer simulations
| Equation, domain (Fig. 2) | Flow rate (L/min) |
Pressure drop (psi) | Power (W) | ||
|---|---|---|---|---|---|
| Counter flow | Cooling buffer | ||||
| Simulation 9 | 12, C | 2.4 × 10⁻³ | 5 | 0.2895 | 650 |
| Simulation 10 | 12, C | 2.4 × 10⁻³ | 15 | 1.9112 | 875 |
| Simulation 11 | 12, C | 2.4 × 10⁻³ | 25 | 4.6567 | 1000 |
A turbulent flow profile in the rotor’s lumen would promote good mixing and heat transfer throughout the cooling buffer, which would enhance heat transfer from the separation annulus. Work by Gu and Fahidy [19] shows that mass transfer in an annulus with axial flow and a rotating outer wall is governed by the turbulent axial flow for Re >2300. This applied to heat transfer in our system by way of the heat and mass transfer correlation [20]. The flow rate in the rotor’s lumen had to stay above 5 L/min in order to maintain a turbulent flow profile, as calculated according to Bird and Meter [21]. However, the flow rate was limited to 25 L/min because the pressure required for higher flow rates (Table 4) would likely cause the rotor to leak. Therefore, simulations 9–11 tested flow rates of 5, 15, and 25 L/min, respectively.
The thermal conductivity of the buffer in the rotor’s lumen was multiplied by 1000 to remove the buffer’s resistance to heat transfer, which simulated the turbulent mixing within the rotor. The resistance to heat transfer between the buffer in the rotor’s lumen and the inner wall of the ceramic was assumed to occur in a thin film at the interface between the buffer and the rotor [22). The film had a thickness, δ, equal to the thermal conductivity of the buffer divided by the heat transfer coefficient [22] and extended the length of the rotor’s inner wall between the Delrin end caps (see Fig. 2). The Dittus-Boelter correlation served as a first approximation for finding the convection coefficient in the fully developed turbulent flow within the rotor’s lumen [20].
Simulations 9–11 also included the effects of convective heat transfer along the rotor’s outer wall. Ivory [17] has previously shown that the radial heat transfer in a vortex-stabilized chamber exceeds that of a laminar flow in a thin annular gap by 3–4 ×. Therefore, we multiplied the thermal conductivity of water in the separation annulus by 3 to account for the enhanced heat transfer. The counterflow rate in the separation annulus for simulations 9–11 was 2.4 mL/min, the same flow rate used to separate BSA from FMP in simulation 8.
Finding the maximum power that the design could dissipate while keeping the separation annulus at 25°C required iteration. The first step involved distributing 100 W of Joule heat uniformly over the fluid volume of the domain, since Joule heating would occur in the buffer, and then solving the model. The temperature profile in the separation annulus was less than 25°C along most of the outer wall, so the amount of Joule heat was increased and the model solved again. Eventually, the temperature profile reached 25°C along most of the outer wall after multiple iterations. Table 4 shows the maximum amount of Joule heat the design could dissipate at cooling buffer flow rates of 5, 15, and 25 L/min, corresponding to simulations 9, 10, and 11, respectively.
4 Results and discussion
Solving the models on the complicated 2-D domains shown in Fig. 2 required numerical methods. FlexPDE 5 (PDE Solutions, Spokane, WA), a scripted finite element builder and solver, solved the models specified earlier. The electric field model was solved for multiple conductivities and voltage profiles in simulations 1–7. Simulation 8 described protein transport, and simulations 9–11 showed the heat transfer for three different cooling buffer flow rates.
4.1 Electric field modeling
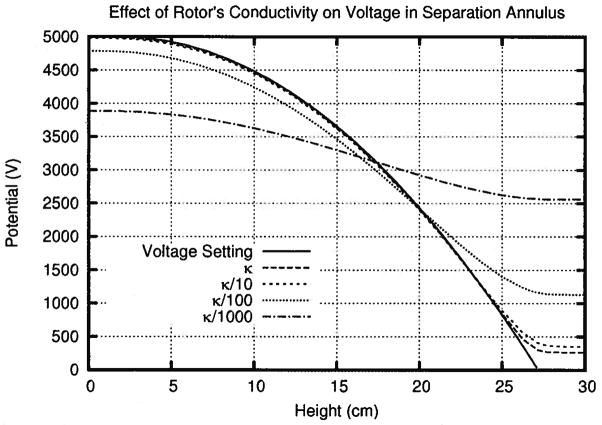
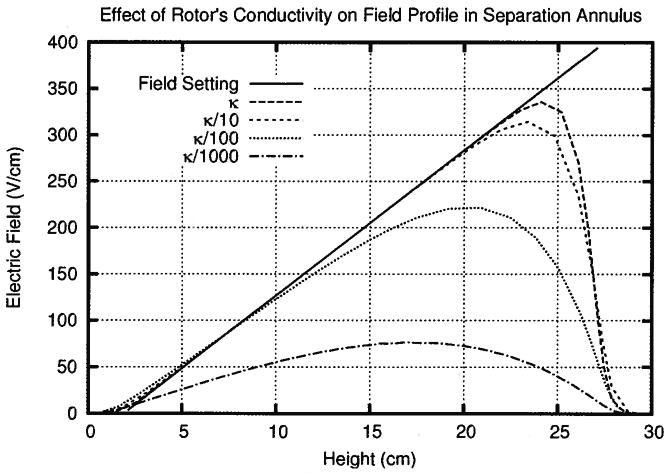
Simulations 1–7 solved for the electric field in the preparative DFGF instrument design to assess whether the electrode array within the rotor’s lumen generated a linear electric field gradient in the separation annulus. Simulations 1–4 were a parametric study of the effect of the rotor’s conductivity on the electric field gradient in the separation annulus. Figures 3 and 4 show the voltage and electric field, respectively, in the separation annulus compared to the setting on the electrode array. The figures show that decreasing the effective conductivity of the porous rotor adversely affected the potential (Fig. 3) and the shape of the electric field gradient (Fig. 4) in the separation annulus when the effective conductivity of the rotor was less than 10% of the buffer’s conductivity.
Figure 3.
This plot, using the solutions from simulations 1–4, shows how decreasing the conductivity of the rotor decreases the peak voltage in the separation annulus. More than 20% of the voltage will be lost if the rotor is 1000 × less conductive than the buffer.
Figure 4.
In simulations 1–4, the linearity and slope of the electric field gradient in the separation annulus decrease with the conductivity in the rotor. The electric field also decreases towards the end of the chamber creating a region where proteins rapidly defocus.
More specifically, the κ/10 line in Fig. 3, which approximated the reduction in conductivity in the rotor due to porosity, shows that the porosity of the rotor had a minimal impact on the peak voltage in the chamber. Any membrane applied to the surface of the rotor would further reduce the effective conductivity of the rotor down to κ/100 or κ/1000. A 99% drop in conductivity only decreased the peak voltage by 5%. However, a 99.9% drop in conductivity cut the peak voltage in the separation annulus by more than 20%. This suggested that an acceptable rotor, like a thin dialysis membrane on a porous support, should decrease conductivity by no more than a factor of 100. Therefore, simulations 5–7 used κ/100 as the effective conductivity of the rotor.
Figure 4 shows that the electric field in the separation annulus had a defocusing zone, which existed independent of the rotor’s resistance. The electric field decreases in a defocusing zone, which allows the counterflow to smear the focused proteins. As shown in Fig. 4, this region began just before 25 cm in the case of no resistance through the rotor and extended to 30 cm, the end of the separation annulus. Decreasing the conductivity in the rotor caused the defocusing zone to begin lower down the chamber, costing valuable height where proteins could be focused. At a conductivity of κ/100, the defocusing zone occupied nearly 1/3 of the separation chamber, decreasing the peak capacity of the device.
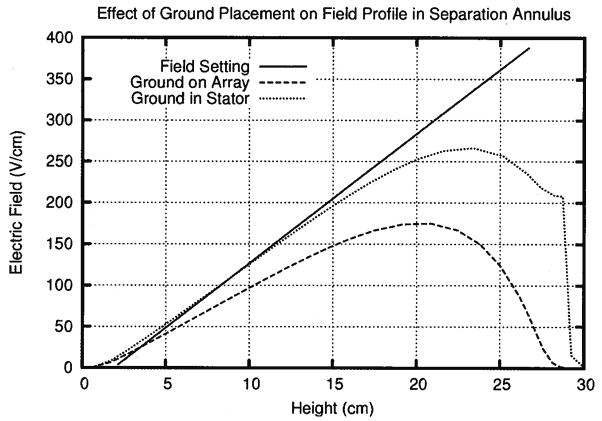
The defocusing zone resulted from the current in the separation annulus going to ground at the top of the electrode array in the rotor’s lumen. Thus, simulation 5 explored whether adding a ground electrode to the stator, in addition to the one on the electrode array, could decrease the length of the defocusing zone by offering a path of lower resistance for the current to travel. Figure 5 shows that a ground electrode placed in the stator produced the desired effect by reducing the size of the defocusing zone from 10 to 7 cm and improving the slope of the electric field gradient in the separation annulus.
Figure 5.
Adding a ground electrode in the stator improved the slope of the electric field gradient and decreased the defocusing zone in simulation 5.
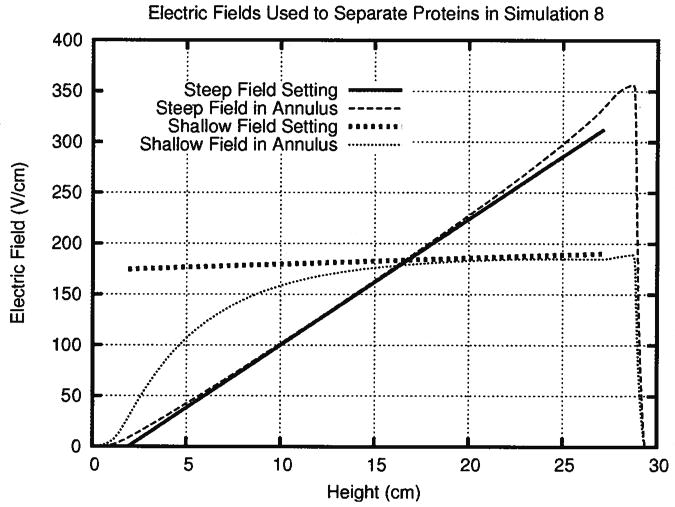
Adding the ground electrode to the stator reduced the defocusing zone by 30%, but did not completely remove it. In simulation 6, the voltage at the top of the electrode array was increased so that ground existed only in the stator. This decreased the slope of the electric field somewhat and made the field more linear on the whole, minimizing the defocusing zone. Figure 6 shows that altering the voltage profile on the electrode array produced a nearly linear electric field in the separation annulus that very closely matched the field setting. Increasing the voltage at the top of the electrode array further decreased the size of the defocusing zone from 7 cm in simulation 2 to 1.3 cm in simulation 6.
Figure 6.
Moving ground into the stator and adjusting the electric field in simulation 6 minimized the defocusing zone and produced a steep electric field equivalent to the one set on the array. The rotor distorts the bottom half of the shallow electric field gradient in simulation 7. The upper half of the chamber remains useful for separating similar proteins.
As mentioned earlier, simulation 7 provided an exceptionally shallow electric field gradient for separating highly similar proteins. The slope of the electric field gradient could have been altered by dropping the top end of the gradient, raising the bottom end, or by doing a little of both. Decreasing only the peak value of the field would have led to very low field strengths and unacceptably long separation times. On the other hand, raising only the bottom of the field would have required increasing the electric potential beyond 5000 V, producing more Joule heat than the device could probably dissipate. So, flattening the electric field gradient for simulation 7 by raising the bottom somewhat and dropping the peak provided a very shallow field gradient with the most power the preparative scale DFGF could probably handle. Figure 6 shows that the defocusing zone of this shallow electric field gradient occupied the last 1.4 cm of the separation annulus, similar to simulation 6. However, the field between 0 and 15 cm in the separation annulus did not resemble the field set on the electrode array. Increasing the conductivity through the rotor somewhat alleviated the deformation of the field in the bottom of the separation annulus. Therefore, high resolution separations should be done above 15 cm in the chamber where the field gradient stayed shallow and linear.
The linear model of the electric field revealed several useful things. First, it showed that the current should go to ground in the stator, not on the electrode array. The preparative DFGF would have suffered from a defocusing zone occupying 33% of the separation chamber had ground been located on the electrode array, as it is in the analytical-scale DFGF device. Second, the linear model showed that an acceptable rotor should not reduce conductivity by more than 100 ×. This constraint revealed the need to test whether a given ceramic and membrane combination will make a suitable rotor. Third, modeling the electric field demonstrated that any separation which uses extremely shallow gradients will need to be done between 15 and 30 cm in the separation annulus.
4.2 Protein separation model
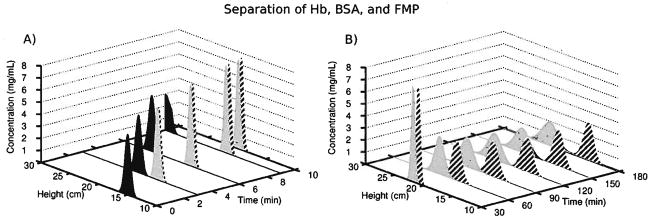
Simulation 8 predicted whether the electric fields from simulations 6 and 7 could separate proteins in a reasonable amount of time, say, less than an 8-h work day. The model proteins, BSA and Hb, separated quickly and easily due to the large difference in their mobilities (see Table 1). However, separating BSA and FMP, which differed in mobility by only 5%, or 1 charge, required more time and a much shallower gradient. The left side of Fig. 7 shows the first 10 min of the simulated separation. It took only 3 min to baseline separate 10 mg of Hb (black peak) from 10 mg each of BSA (striped peak) and FMP (gray peak). The Hb eluted out the top of the chamber 10 min into the run. The remaining proteins reached their focal points at 21 and 22 cm in the separation annulus 20 min later, as shown at the 30 min mark on the right of Fig. 7. Setting the electric field to the shallow gradient in simulation 7 (Fig. 6) separated the two similar proteins in the upper 15 cm of the chamber after another 2.5 h. The BSA and FMP peaks occupied half the separation annulus by the end of the separation, rather than the 4 cm they occupied in the steep electric field. This demonstrates the inverse relationship between resolution and peak capacity seen in the preparative DFGF instrument and other techniques, like IEF and gradient elution chromatography.
Figure 7.
Panel (A) shows that in simulation 8 the black Hb peak easily separated from the striped BSA and gray FMP peaks during the first 10 min of the separation. Each peak represented 10 mg of protein. Panel (B) shows BSA (striped peak) and FMP (gray peak) reached their focal points at 21 and 22 cm within 30 min, using the steep electric field gradient from simulation 6. Changing the electric field gradient to the shallow slope of simulation 7, and decreasing the counter flow, resolved these proteins that differed only by 1 charge.
The results from simulation 8 suggested that a tentative preparative DFGF design should readily concentrate and purify tens of milligrams of proteins in less than a half work day. Also, the device should separate proteins whose mobilities differ by as little as 5%. The broad peaks engendered by the shallow electric field will limit the device to resolving complex mixtures of similar proteins in a serial fashion by stacking peaks in the steep gradient at the bottom of the chamber and then moving them one at a time to the shallow part of the gradient. Then the purified proteins in the shallow gradient could be removed through one or more of the 24 off-take ports that span the height of the separation annulus.
4.3 Heat transfer modeling
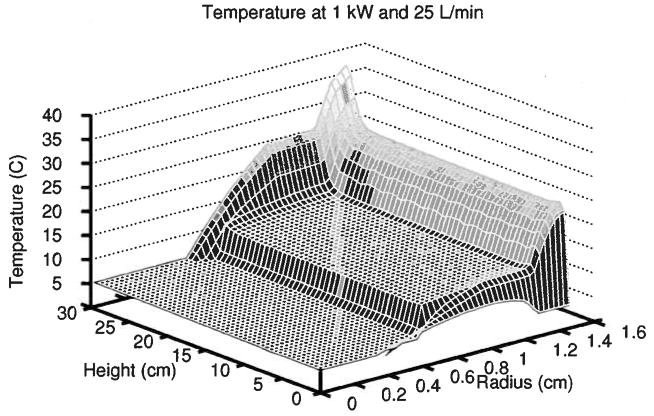
Simulations 9–11 estimated the cooling capacity of the preparative DFGF design to make sure that the separation annulus stayed at 25°C or colder to avoid denaturing proteins during separations. The rotor should handle pressures up to 5 psi, so simulations 9–11 used flow rates in the lumen of the rotor that required less than 5 psi (see Table 4). The temperature profiles from each model closely resembled Fig. 8, which shows the results of simulation 11. The sudden increase in temperature over the last 4 cm of the separation annulus arose from the Delrin end cap’s poor thermal conductivity. The preparative DFGF dissipated 650, 875, and 1000 W of Joule heat at cooling buffer flow rates of 5,15, and 25 L/min, respectively, while maintaining 87% of the separation annulus at 25°C or cooler.
Figure 8.
Temperature profile in the preparative DFGF due to 1 kW of Joule heat in simulation 11. Cooling buffer chilled to 5°C flowed through the lumen of the rotor at 25 L/min. The greatest rise in temperature occurred in the separation annulus.
The electric fields from simulations 6 and 7 produced 1292 and 971 W, respectively, assuming Ohmic heating:
| (16) |
This suggested that the current design should not have trouble cooling the high-resolution/low field strength runs. However, it would not adequately cool high-field strength runs with buffers having κ ≥ 0.05 S/m. Possible solutions to this problem could not involve higher flow rates due to the aforementioned pressure limitations. A different electrically nonconductive rotor material with a thermal conductivity greater than that of boron nitride could help to dissipate more Joule heat, but it would have marginal effect because the greatest resistance to heat transfer was not within the rotor. Figure 8 shows that the greatest resistance to heat transfer, which occurred where the rise in temperature was largest, was in the separation annulus. A better approach would be to produce less heat in the first place.
The Joule heating could be reduced by decreasing the conductivity of the cooling and counterflow buffers because the heat produced is proportional to the buffer conductivity, as shown in Eq. (16). Cutting the conductivity in half by using 5 mM, rather than 10 mM Tris buffer would reduce the heating by half, or one could simply raise the pH of the 10 mM Tris buffer from 7.5 to 8.3 and achieve the same effect. Alternately, one could prepare a lower conductivity buffer by titrating the Tris with an acid whose anion has a mobility less than acetate’s mobility. For example, a 25 mM Tris buffer titrated with boric acid to pH 8.7 would have half the conductivity of the 10 mM Tris buffer titrated with acetic acid to pH 7.5 and produce half the resulting Joule heat. The actual buffer chosen will not matter so long as there is less heat generated than can be removed.
Past incarnations of the vortex-stabilized electrophoresis chamber solve the heating issue by using jacketed stators, but the jacketing severely complicates sample recovery [17]. That flaw relegated jacketing the stator to a last resort in the current design. However, four or six discreet cooling tubes embedded axially in the stator could chill the stator and, thereby, the outer wall of the separation annulus. Analyzing the effect of such tubes would require a more complicated 3-D model; and should the tubes prove useful, they would require a vastly more complex fabrication process. Decreasing the buffer conductivity makes the most sense at this stage of device design because it will sufficiently reduce Joule heating with the least complication.
5 Concluding remarks
Assessing the preparative scale DFGF design by means of a linear model revealed design flaws and constraints prior to fabricating the equipment. The model of the electric field helped us to optimize the location of the ground electrode and electric field settings, thereby maximizing the useful height of the separation annulus. In addition, modeling the electric field identified some constraints in the design. In particular, the rotor should not reduce conductivity by more than 100 ×, which will require carefully testing potential rotor and membrane combinations. Modeling the heat transfer in the design demonstrated the necessity of using low-conductivity buffers, with conductivities of 0.035 S/m or less, in order to work at elevated field strengths and keep the separation annulus near 25°C, or cooler. Simulating the separations of 10 mg each of Hb, BSA, and FMP found that the design could separate dissimilar proteins in about 10 min, but would take 3 h to fully resolve proteins with only a 5% difference in their mobilities. The model also showed that baseline resolution of highly similar proteins should be performed in the upper half of the separation annulus. DFGF should successfully scale by 1000 × from microgram loads of protein to tens of milligram loads using the design proposed in this paper.
The approach taken in this paper applies generally to other techniques and systems, although the specific assumptions, constants, and results presented were unique to the proposed preparative-scale DFGF instrument. First, one identifies the controlling elements, or key scaling criteria, of the experiment or device: the electric field, Joule heating, and dispersion in this case. Then conceive a design that satisfies those criteria. In this paper, an existing piece of equipment inspired a new design that could satisfy the key scaling criteria. Next, qualitatively model the design to see whether it satisfies the scaling criteria. As explained in the introduction, qualitatively correct modeling will probably suffice for prototype design. Finally, expect the simulations to identify design problems, constraints, and even suggest how experiments should be run, as they did in this case.
Acknowledgments
We thank the Washington State University National Institutes of Health Protein Biotechnology Training Program, grant T32GM08336, and the National Science Foundation, grant BES 9970972, and Berlex Laboratories (now a part of Bayer Health-Care) for funding. Any opinions, findings, and conclusions or recommendations expressed in this material are those of the authors and do not necessarily reflect the views of the National Science Foundation.
Abbreviations
- DFGF
dynamic field gradient focusing
- EGM
equilibrium gradient method
- Hb
hemoglobin
Nomenclature
- c
Concentration, mol/m3
- Cp
Heat capacity, J/kg/K
- D
Dispersion coefficient, m2/s
- qgen
Ohmic heating, W/m3
- F
Faraday constant, C/mol
- i
Subscript for the ith protein
- k
Thermal conductivity, W/m/K
- , n
Normal vector
- N
Molar flux vector, mol/m2/s
- T
Temperature, K
- u
Absolute mobility, mol s/kg, v, Velocity vector, m/s
- z
Net molecular charge
Greek Letters
- κ
Conductivity, S/m
- ρ
Density, kg/m3
- φ
Electric potential, V
References
- 1.Huang Z, Ivory CF. Anal Chem. 1999;71:1628–1632. [Google Scholar]
- 2.Myers P, Bartle KD. J Chromatogr A. 2004;1044:253–258. doi: 10.1016/j.chroma.2004.04.069. [DOI] [PubMed] [Google Scholar]
- 3.Giddings JC, Dahlgren K. Sep Sci. 1971;6:345–356. [Google Scholar]
- 4.Ivory CF. Sep Sci Technol. 2000;35:1777–1793. [Google Scholar]
- 5.Kelly RT, Woolley AT. J Sep Sci. 2005;28:1985–1993. doi: 10.1002/jssc.200500228. [DOI] [PubMed] [Google Scholar]
- 6.Ivory CF. Electrophoresis. 2007;28:15–25. doi: 10.1002/elps.200600623. [DOI] [PubMed] [Google Scholar]
- 7.Voet D, Voet JG. Biochemistry. 2. John Wiley & Sons; New York: 1995. [Google Scholar]
- 8.Greenlee RD, Ivory CF. Biotechnol Prog. 1998;14:300–309. doi: 10.1021/bp970113v. [DOI] [PubMed] [Google Scholar]
- 9.Koegler WS, Ivory CF. Biotechnol prog. 1996;12:822–836. [Google Scholar]
- 10.Humble PH, Harb JN, Tolley HD, Woolley AT, Farnsworth PB, Lee ML. J Chromatogr A. 2007;1160:311–319. doi: 10.1016/j.chroma.2007.04.013. [DOI] [PubMed] [Google Scholar]
- 11.Newman JS. Electrochemical Systems. Prentice-Hall, Inc; Engel-wood Cliffs, NJ: 1991. [Google Scholar]
- 12.Mosher RA, Saville DA, Thormann W. The Dynamics of Electrophoresis. VCH; New York: 1991. [Google Scholar]
- 13.Wang Q, Tolley HD, LeFebre DA, Lee ML. Anal Bioanal Chem. 2002;373:125–135. doi: 10.1007/s00216-002-1286-y. [DOI] [PubMed] [Google Scholar]
- 14.Lynch E, Saville DA. Chem Eng Commun. 1981;9:201–211. [Google Scholar]
- 15.Gobie WA, Ivory CF. J Chromatogr. 1990;516:191–210. [Google Scholar]
- 16.Ivory CF. In: Bioprocess Technology: Fermentation, Biocatalysis. Flickinger MC, Drew SW, editors. John Wiley & Sons; New York: 1999. pp. 910–929. [Google Scholar]
- 17.Ivory CF. Electrophoresis. 2004;25:360–374. doi: 10.1002/elps.200305753. [DOI] [PubMed] [Google Scholar]
- 18.Ivory CF. Sep Sci Technol. 1988;23:875–912. [Google Scholar]
- 19.Gu ZH, Fahidy TZ. J Appl Electrochem. 1982;12:659–667. [Google Scholar]
- 20.Incropera FP, DeWitt DP. Fundamentals of Heat and Mass Transfer. John Wiley & Sons; New York: 1996. [Google Scholar]
- 21.Bird RB, Meter DM. AIChEJ. 1961;7:41–45. [Google Scholar]
- 22.Thomson WJ. Introduction to Transport Phenomena. Prentice Hall PTR; Upper Saddle River, NJ: 2000. [Google Scholar]
- 23.Douglas NG, Humffray AA, Pratt RC, Stevens GW. Chem Eng Sci. 1995;50:743–754. [Google Scholar]
- 24.Potter MC, Wiggert DC. Mechanics of Fluids. 2. Prentice Hall; Upper Saddle River, NJ: 1997. [Google Scholar]


