Abstract
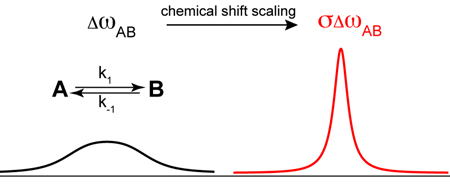
Broadening of spectral lines is a signature of chemical exchange phenomena on µs-ms time scales, but has deleterious effects on spectral resolution and sensitivity. A multi-pulse method based on chemical shift scaling is described that reduces chemical exchange broadening during frequency-encoding periods of liquid-state multidimensional NMR experiments. The proposed scheme utilizes low-power radiofrequency pulses, which offer the advantages of short cycle times and minimal sample heating. The method is suitable for biological macromolecules, because relaxation not resulting from chemical exchange is reduced by placing magnetization along the z-axis for part of the evolution trajectory. The resolution and sensitivity enhancement for resonances broadened by chemical exchange is demonstrated on the protein ribonuclease A. The work demonstrates the feasibility of applying coherent averaging techniques, original developed in solid-state NMR, to biological NMR in liquid state for resolution enhancement and facilitates the detection of resonances that are severely broadened by chemical exchange processes.
NMR techniques for characterizing chemical exchange phenomena have found widespread use in studies of protein and nucleic acid dynamics, which are closely linked to biological functions, including enzyme catalysis, ligand binding, and allosteric regulation.1,2 However, chemical exchange on µs-ms time scales broadens spectral lines with deleterious effects on resolution and sensitivity. We present a multi-pulse method to reduce chemical exchange broadening during the frequency-encoding periods of liquid-state multidimensional NMR experiments. Enhanced resolution and sensitivity are demonstrated for exchange-broadened 15N resonances of the protein ribonuclease A (RNase A).
Transverse relaxation induced by chemical exchange depends on the kinetic rate constants of the chemical process and on the differences in resonance frequencies for nuclear spins in the interconverting molecular species. Kinetic rate constants are intrinsic physicochemical properties of a biological or chemical system and manipulation of these properties is either difficult or undesirable. In contrast, isotropic chemical shifts can be partially refocused by radiofrequency (RF) pulse trains, as first demonstrated by Ellett and Waugh.3 This technique has been named “chemical shift scaling” (CSS) and mainly used in solid-state NMR spectroscopy. Fluctuations in isotropic chemical shifts caused by chemical exchange also are reduced by CSS. If the kinetic process is in the fast-exchange limit and the cycle time of the RF pulses is much shorter than the kinetic time scale, then transverse relaxation is scaled by a factor σ2, in which the CSS scaling factor is 0<σ<1.4 The effective gain in resolution is 1/σ if loss from the scaled precession frequencies is taken into account and other relaxation mechanisms are not considered. If the kinetic process approaches the intermediate-to-slow exchange limits, then transverse relaxation is scaled by a factor that is larger than σ2 and that eventually reaches unity.
Zhuravleva and Orekhov5 recently applied a CSS scheme, called “divided evolution”, in liquid-state NMR. This scheme alternates a free-precession period and a hard π-pulse train consisting of either 8 or 16 pulses applied with XY8 or XY16 phase cycles.6 Magnetization evolves in the transverse plane for nearly the entire divided evolution trajectory. Therefore, the apparent transverse relaxation resulting from mechanisms other than chemical exchange is inflated by a factor of 1/σ and can contribute significantly to total linewidths, especially for large proteins. Practical use of the scheme also is hampered by the narrow spectral width that can be sampled without aliasing unless σ is very small, because a minimum spacing between hard pulses is required to avoid excessive heating.
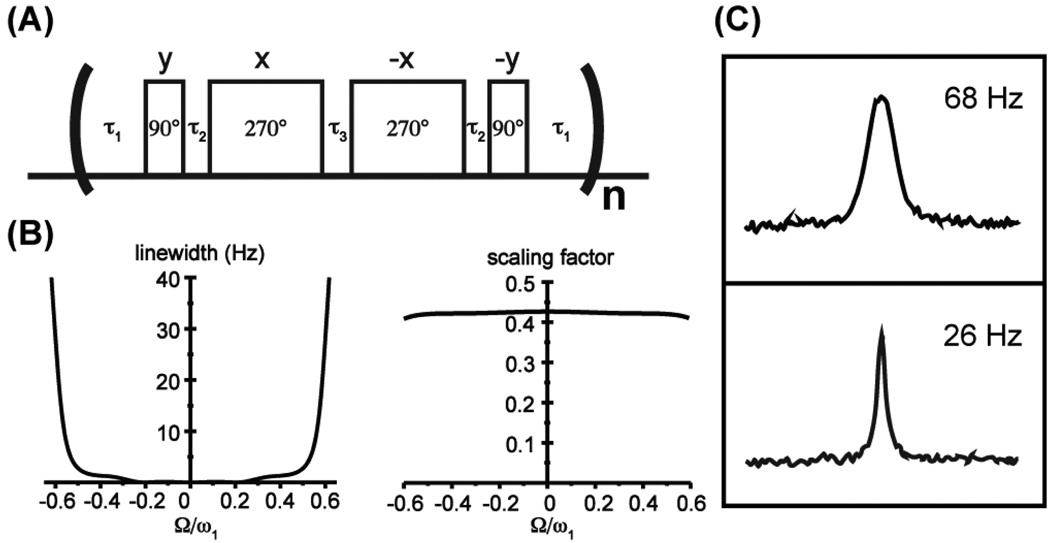
To address these problems, we implement a four-pulse scheme based on the classical WAHUHA7 and magic echo8,9 sequences for homonuclear dipolar decoupling in solid-state NMR. Figure 1A shows the RF cycle of the proposed sequence with pulse phases and a set of optimal pulse flip angles. The four pulses are executed at low RF power to significantly shorten the RF cycle and therefore allow faster sampling rates. Isotropic chemical shifts are scaled down by factors determined by flip angles of the low-power pulses and the length of flanking free-precession periods. To achieve high degree of compensation to RF inhomogeneity required for high-resolution solution NMR applications, pulse flip angles and delays are optimized by numerical simulations performed with SPINEVOLUTION.10 Figure 1B shows the simulated line broadening as a function of resonance offsets for a Gaussian distribution of B1 fields with a full-width-at-half-height (FWHH) of 10%. Good compensation to RF inhomogeneity, as well as uniform scaling factors can be achieved within an effective bandwidth of approximately ω1 with the chosen set of parameters (τ1 = 2 τ90, τ2 = 0.03 τ90, τ3 = 0.5 τ90), which gives σ = 0.42. Parameters for other scaling factors are included in the Supporting Information.
Figure 1.
(A) The RF cycle of the four-pulse scheme for chemical shift scaling. (B) Simulated line broadening by RF inhomogeneity and scaling factor as functions of the ratio of resonance offsets (Ω) to the B1 field (ω1), when τ1 = 2τ90, τ2 = 0.03τ90, τ3 = 0.5τ90, and τ90 is the 90° pulse length. Line broadening is represented as the FWHH and is proportional to B1. A B1 field of 2.5 kHz is used to produce the plot. (C) The 13C lineshapes of [13C2-methyl] DMTCA in the direct (top) and indirect (bottom) dimensions of a 13C-13C 2D spectrum with CSS applied to the t1 evolution period. Both lineshapes were extracted from a single diagonal peak. Parameters used for chemical shift scaling are τ90 = 60 µs, τ1 = 111 µs, τ2 = 10 µs, τ3 = 38.4 µs and the scaling factor σ is 0.40.
The proposed sequence has more favorable relaxation properties than the divided-evolution scheme because magnetization is placed along z-axis for part of the evolution trajectory, as previously demonstrated for TOCSY experiments.11 During the four pulses, if executed without any inter-pulse delays, the effective relaxation rate is for x-magnetization and for y-magnetization, where represents the transverse relaxation rate constant for interactions other than chemical exchange and R1 is the longitudinal relaxation rate constant. Relaxation during the entire RF cycle is further reduced by the shorter free precession period needed to achieve a desired scaling factor because chemical shifts are not completely refocused during the low-power RF pulses. As a practical advantage, sample heating also is reduced, because heating from RF pulses, when flip angles are the same, is proportional to the B1 field.
Line narrowing effects of the proposed scheme were confirmed by applying CSS during the t1 evolution period of a 13C-13C 2D experiment on a small molecule [13C2-methyl] N, N-dimethyltrichloroacetamide (DMTCA), which contains two methyl groups in chemical exchange. For easy comparison of resolution, the spectral width of the indirect 13C dimension is scaled by 1/σ to produce the same chemical shifts as the direct dimension. With a B1 field much larger than the kinetic rate constant (~200 s−1), the 13C linewidth is reduced from 68 Hz to 26 Hz (Figure 1C), consistent with the scaling factor σ = 0.40.
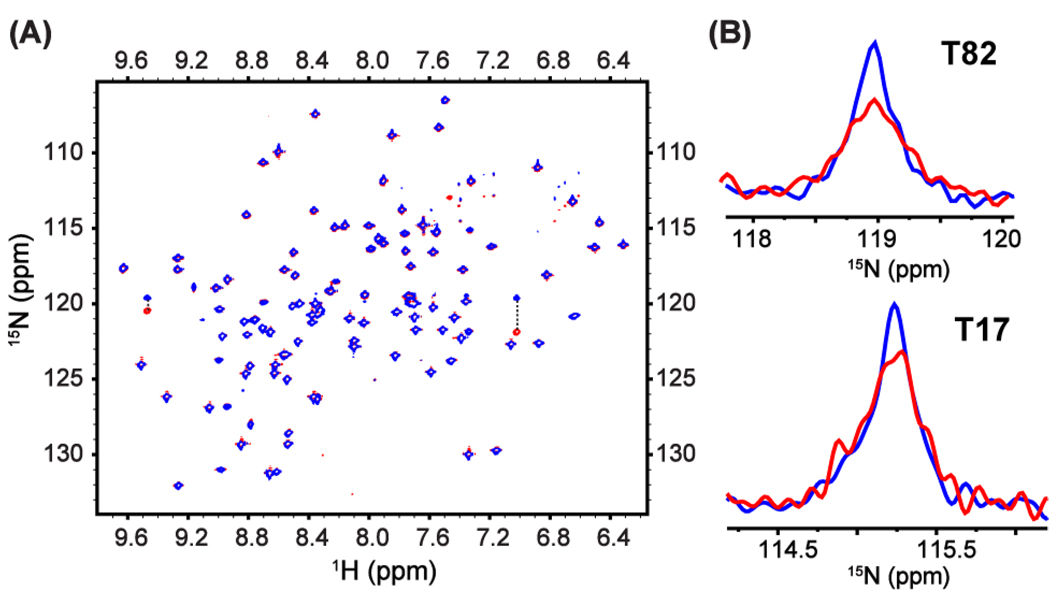
The proposed scheme also was validated using the protein [U-2H, U-15N] RNase A, which has been characterized previously by relaxation dispersion experiments.12 CSS with σ = 0.42 was applied during t1 evolution period of a gradient-selected 15N-1H TROSY sequence using a B1 field of 2.5 kHz, which results in a RF cycle time of ~1.3 ms; 202 complex points were collected in the t1 dimension. A normal TROSY spectrum was acquired with the same effective sampling rate and digital resolution for comparison. Figure 2A shows the overlay of the two spectra, illustrating uniform scaling factors across the entire spectral region. Six residues, whose original linewidths range from 10 Hz to 30 Hz, show narrower lines under CSS. Figure 2B shows the 15N lineshapes for residues T82 and T17. T82 shows the most dramatic narrowing effects with linewidth reduced from 30 to 19 Hz and signal-to-noise ratio enhanced to 165% of the original. Resonances corresponding to residues not undergoing chemical exchange are broadened slightly. The average 15N linewidth for all residues is 7.0 Hz in the normal TROSY and 9.0 Hz in the TROSY with CSS, consistent with good compensation to RF inhomogeneity. When chemical exchange broadening contributes to a larger fraction of total linewidth than for RNase A, the experiment will benefit from choosing smaller scaling factors. TROSY experiments incorporating the divided evolution scheme were performed with the same σ = 0.42 and with σ = 0.24, nearly identical to that used by Zhuravleva and Orekhov.5 No reductions in linewidth were observed for any resonance in either experiment, owing to the less favorable relaxation properties and longer RF cycle and therefore slower averaging of chemical shifts.
Figure 2.
(A) Overlay of spectra for normal TROSY (red) and TROSY with CSS (blue) during the t1 evolution period. Data were acquired for [U-2H, U-15N] RNase A at 293 K on a Bruker DRX500 spectrometer equipped with a triple-resonance gradient probe. The parameters used for chemical shift scaling are τ90 = 100 µs, τ1 = 200 µs, τ2 = 3 µs, τ3 = 50 µs, and σ = 0.42. Data were processed without apodization in indirect dimensions. Crosspeaks connected by dotted lines belong to same residues and are outside the effective bandwidth and also aliased. (B) The 15N lineshapes of residues T82 and T17 in normal TROSY (red) and TROSY with CSS (blue).
In summary, we have presented a method based on chemical shift scaling for narrowing spectral lines severely broadened by chemical exchange. The favorable relaxation properties of the proposed scheme are especially suitable for proteins of high molecular weight. The method can be applied using RF powers available from current solution NMR probes, although higher powers will increase the effective bandwidth and the range of exchange rates for which the technique is effective. CSS enhances the sensitivity of the most severely broadened lines and potentially allows detection of weak peaks that are below normal detection limits. CSS also can be combined with methods, such as CPMG-INEPT13,14 or cross-polarization, 15 that reduce losses from chemical exchange during magnetization transfer periods. Coherent averaging techniques, originally developed in solid-state NMR, are used widely for decoupling and isotropic mixing in liquid-state NMR. The present work demonstrates additional applications for resolution enhancement in biological NMR spectroscopy.
Supplementary Material
Acknowledgment
This work was supported by National Institutes of Health grant GM59273 (A. G. P.). We thank Eric Watt and J. Patrick Loria (Yale Univ.) for providing the sample of RNase A. We thank Mark Rance (Univ. Cincinnati) for helpful discussions.
Footnotes
Supporting Information Available: Details of numerical optimization, a table containing pulse flip angles and delays for a range of σ values, additional experimental details, experimental data on ubiquitin, resonance offset dependence of σ, orientation of the effective magnetic field, effective relaxation rate, and dependence of transverse relaxation rate from chemical exchange on B1 field or pulsing rate. This material is available free of charge via the Internet at http://pubs.acs.org.
REFERENCES
- 1.Boehr DD, Dyson HJ, Wright PE. Chem. Rev. 2006;106:3055–3079. doi: 10.1021/cr050312q. [DOI] [PubMed] [Google Scholar]
- 2.Kern D, Zuiderweg ER. Curr. Opin. Struct. Biol. 2003;13:748–757. doi: 10.1016/j.sbi.2003.10.008. [DOI] [PubMed] [Google Scholar]
- 3.Ellett JD, Waugh JS. J. Chem. Phys. 1969;51:2851–2857. [Google Scholar]
- 4.Vega AJ, English AD, Mahler W. J. Magn. Reson. 1980;37:107–128. [Google Scholar]
- 5.Zhuravleva A, Orekhov VY. J. Am. Chem. Soc. 2008;130:3260–3261. doi: 10.1021/ja710056t. [DOI] [PubMed] [Google Scholar]
- 6.Gullion T, Baker DB, Conradi MS. J. Magn. Reson. 1990;89:479–484. [Google Scholar]
- 7.Waugh JS, Huber LM, Haeberle U. Phys. Rev. Lett. 1968;20:180–182. [Google Scholar]
- 8.Takegoshi K, Mcdowell CA. Chem. Phys. Lett. 1985;116:100–104. [Google Scholar]
- 9.Boutis GS, Cappellaro P, Cho H, Ramanathan C, Cory DG. J. Magn. Reson. 2003;161:132–137. doi: 10.1016/s1090-7807(03)00010-7. [DOI] [PubMed] [Google Scholar]
- 10.Veshtort M, Griffin RG. J. Magn. Reson. 2006;178:248–282. doi: 10.1016/j.jmr.2005.07.018. [DOI] [PubMed] [Google Scholar]
- 11.Bax A, Davis DG. J. Magn. Reson. 1985;65:355–360. [Google Scholar]
- 12.Cole R, Loria JP. Biochemistry. 2002;41:6072–6081. doi: 10.1021/bi025655m. [DOI] [PubMed] [Google Scholar]
- 13.Mueller L, Legault P, Pardi A. J. Am. Chem. Soc. 1995;117:11043–11048. [Google Scholar]
- 14.Mulder FAA, Spronk CAEM, Slijper M, Kaptein R, Boelens R. J. Biomol. NMR. 1996;8:223–228. doi: 10.1007/BF00211169. [DOI] [PubMed] [Google Scholar]
- 15.Krishnan VV, Rance M. J. Magn. Reson. A. 1995;116:97–106. [Google Scholar]
Associated Data
This section collects any data citations, data availability statements, or supplementary materials included in this article.


