Abstract
Fluorescence tomography has become increasingly popular for detecting molecular targets for imaging gene expression and other cellular processes in vivo in small animal studies. In this imaging modality, multiple sets of data are acquired by illuminating the animal surface with different excitation patterns, each of which produces a distinct spatial pattern of fluorescence. This work addresses one of the most intriguing, yet unsolved, problems of fluorescence tomography, which is to determine how to optimally illuminate the animal surface so as to maximize the information content in the acquired data. The key idea of this work is to parameterize the illumination pattern and to maximize the information content in the data by improving the conditioning of the Fisher information matrix. We formulate our problem as a constrained optimization problem. We compare the performance of different geometric illumination schemes with those generated by this optimization approach using the Digimouse atlas.
Index Terms: Fluorescence tomography, optimal illumination, spatial patterns, near-infrared, molecular imaging
1. Introduction
Optical procedures have been effectively and popularly employed for imaging molecular targets inside tissues for many years. The extension of these methods to 3D imaging [1] is confounded by the high degrees of absorption and scattering of photons propagating through tissue. Yet recent years have seen exciting breakthroughs in probe development, mathematical modeling, and instrumentation [2] that have collectively established diffuse optical tomography (DOT), fluorescence molecular tomography (FMT), and bioluminescence tomography (BLT) as promising imaging techniques for a wide range of applications, including preclinical oncological studies in small animals and clinical usage for mammography.
The focus of this paper is on optimal illumination schemes for FMT. The use of multiple spatial patterns for illumination in FMT allows us an extra degree of freedom which could be exploited to significantly improve the conditioning of the forward model matrix. Today's fluorescence imaging setups commonly use laser sources with focusing or diffuser lenses to generate point or distributed patch patterns [3, 4]. However the prospect of using digital light projectors, which give us very precise control over the spatial intensity distribution, makes it feasible for us to generate spatial illumination patterns of our choice. This paper seeks to formalize these concepts and compute the set of illumination patterns that maximize the information content in the data by improving the conditioning of the Fisher information matrix. We first establish a framework for evaluating the performance of different spatial patterns for illumination. We then formulate our problem as a constrained optimization problem that minimizes a cost function derived from the Fisher information matrix and computes the parameterized set of optimal spatial patterns.
A description of the FMT problem can be found in section 2. Section 3 establishes the metrics used for assessing and comparing illumination patterns. In section 4, these metrics are used to compare some standard patterns commonly used in practice. Section 5 describes the optimization problem that generates the optimal set of patterns. In section 6, the optimal result is presented and its performance is assessed. Finally, a discussion of the results is presented in section 7.
2. The Fluorescence Tomographic Problem
The FMT technique seeks to compute the 3D distribution of a photon source inside an animal volume from the photon density detected on the surface of the animal. For highly scattering media, the FMT forward problem can be modeled by applying a diffusion approximation to the radiative transport equation [5]. For nd detector nodes on the animal surface and ns point sources distributed inside the volume, the excitation forward model at a wavelength λex and the emission forward model at a wavelength λem can be expressed as matrices Aex ∈ ℝns × nd and Aem ∈ ℝnd × ns respectively. The forward matrix for the kth illumination pattern can be obtained by diagonally scaling the emission forward matrix by the excitation intensities at each internal point:
| (1) |
Here is a diagonal matrix that scales the surface response due to each internal point source by the excitation strength at that point generated by the kth illumination pattern, wk ∈ ℝnd, and is given by:
| (2) |
where is the ith component of vector dk computed from:
| (3) |
The complete forward model is obtained by concatenating the individual forward model matrices for a set of p different illumination patterns:
| (4) |
Thus, for a given set, b, of fluorescence data corresponding to different illumination patterns, we can determine the source distribution, x ∈ ℝns, by solving the linear system of equations:
| (5) |
This inverse problem is ill-posed owing to the ill-conditioned nature of the system matrix, A. However, we can exploit the dependence of the system matrix on the parameterized illumination patterns, wk, to improve its conditioning.
3. Metrics for Comparing Patterns
As a figure-of-merit for comparing illumination patterns, we will first look at the singular value distribution which throws light on the conditioning of the forward problem. Although the condition number is a good indicator, the quality of the actual reconstruction results depends on the singular vectors as well. So this metric, although informative, is not sufficient. Therefore, we also look at bias-variance curves which allow us to examine the behavior of the inverse solution.
Bias-variance trade-off is an established approach for assessing estimators [6]. We would like to examine the bias and variance properties of the reconstruction results for each possible point source location inside the animal volume. The estimated 3D source distribution obtained using the regularized pseudoinverse, with a regularization parameter α, is given by:
| (6) |
Given the singular value decomposition A = UΣV′ of the system matrix, we can compute the bias and covariance of the estimator as follows:
| (7) |
| (8) |
We assume an additive white Gaussian noise model with covariance . Using these equations, the bias norm and the variance can be computed for each possible point source location inside the volume for different degrees of regularization. Our approach is to average each of these two quantities over all possible source locations and plot them against each other for different values of the regularization parameter to obtain a single bias-variance curve characterizing the system generated by a certain set of illumination patterns.
4. Comparison of Standard Patterns
We looked at some standard patterns that are commonly used in FMT In practice, the most feasible illumination patterns (in terms of ease of implementation) are laser dots, lines, and distributed patches. We ran simulation experiments on the Digimouse atlas [7] to compare these patterns using the described metrics. The finite element method (FEM) with volume tessellation was used to solve the diffusion equation [8] to generate forward models Aex and Aem. The tessellated atlas volume consisted of 306,773 tetrahedrons and 58,244 nodes, and optical properties were assigned organ-wise based on published results [9]. The excitation and emission wavelengths were assumed to be 650 nm and 730 nm respectively.
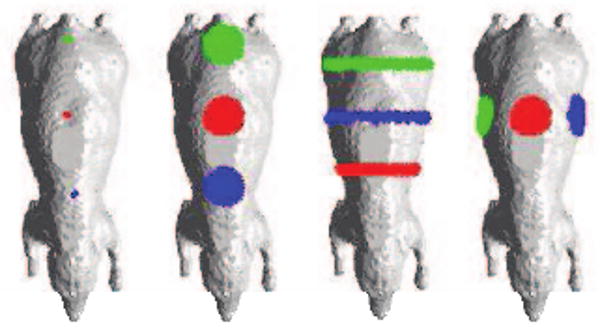
Four different illumination schemes were compared as shown in Fig. 1. Each of the schemes used three patterns (p = 3). The number of patterns was fixed to ensure similar data acquisition times for all the cases. Power was normalized for each pattern so that the integrated illumination intensity remained constant to ensure a fair comparison.
Fig. 1.

Comparison of four illumination patterns for the Digimouse atlas. Each consists of three sets of spatial patterns, differentiated by colors: red, blue, and green.
The singular value distributions for the four cases are compared in Fig. 2(a). The singular values were normalized by setting the largest singular value to 1. The condition number for the scheme that projects distributed patch patterns on the top of the mouse was the smallest. Fig. 2(b) shows the plot of the average standard deviation against the average bias norm. For low variance, line illumination on the top gave the smallest bias, whereas, for high variance, distributed patch patterns on the top performed best. This second observation is in agreement with our conclusion from the singular value decomposition.
Fig. 2.
Performance comparison of four illumination schemes as revealed by (a) their singular value distributions and (b) bias vs. variance curves.
5. The Optimization Problem
There are infinitely many spatial patterns that could be compared using the framework above. We now develop an optimization framework that attempts to find the best illumination pattern with respect to an appropriate metric. Our approach is to use the Fisher information matrix, which provides a measure of information content in the data and has been widely used as the basis for establishing performance bounds in estimation theory through the Cramer-Rao inequality [10].
5.1. Formulation
We assume an additive white Gaussian noise model with unit variance without loss of generality. The Fisher information matrix for this system is given by:
| (9) |
We can rewrite this matrix as a function of the parameterized illumination patterns:
| (10) |
Here ∘ denotes Hadamard (entrywise) matrix multiplication, and the set of illumination patterns is denoted by W = [w1 w2…wp] where W ∈ ℝnd × p. For the system matrix, A = UΣV′, to have a perfect condition number of 1, the singular value matrix, Σ, should equal the identity matrix times a constant scaling factor. Since F is a function of W, we absorb the effects of this factor into W and obtain:
| (11) |
Thus, our objective is to make F approach the identity matrix. This must be done using only a fixed number of patterns. Also, we must ensure nonnegativity of the optimal result. We use as our cost function the Frobenius norm of the difference between the Fisher information matrix and the identity matrix and minimize it under a nonnegativity constraint. Thus the optimal result can be obtained by solving the following constrained optimization problem:
| (12) |
5.2. Dimensionality reduction
The problem described in (12) tends to yield solutions representing illumination patterns that are not smooth and are of a distributed nature. Further, for a large number of surface nodes, solving this problem is computationally quite intensive. To take care of these issues, we introduce a set of m basis functions representing spatially smooth patterns on the atlas surface. The transformation from the basis function domain to the spatial illumination domain is given by:
| (13) |
Here, the columns of L ∈ ℝnd × m represent the basis functions while the elements of Y ∈ ℝm × p are the linear coefficients. The Fisher information matrix in terms of this transformation may be expressed as:
| (14) |
In the new domain, the nonnegativity constraint in (12) is transformed into a general linear inequality constraint. The modified optimization problem in this domain is given by:
| (15) |
The optimal set of patterns can be obtained from:
| (16) |
5.3. Implementation
The forward problem is first solved as described in Section 4 to precompute Aex and Aem. As before, the excitation and emission wavelengths were assumed to be 650 nm and 730 nm respectively. For dimensionality reduction, we define basis functions on the atlas surface treating it as a smooth 2D manifold. We use eigenfunctions (corresponding to the m = 20 smallest eigenvalues) of the Laplace-Beltrami operator as our basis functions [11]. These basis functions enforce smoothness. Their orthonormality allows efficient representation of the solution.
The fourth-order cost function in (15) is minimized using the gradient projection algorithm with an Armijo line search. The linear inequality constraint is enforced within the gradient projection routine by orthogonal projection onto the constraint space. The MATLAB inbuilt function fmincon is used to solve the secondary constrained optimization problem for orthogonal projection at each iteration.
We limit the number of patterns to three to maintain parity with our studies on standard patterns. The nonconvex constrained fourth-order cost function can have several local minima. Therefore the solution obtained depends on the initialization. For initialization and comparison, we use a set of reference patterns representing uniform illumination from three different radial directions separated by 120°.
6. Results
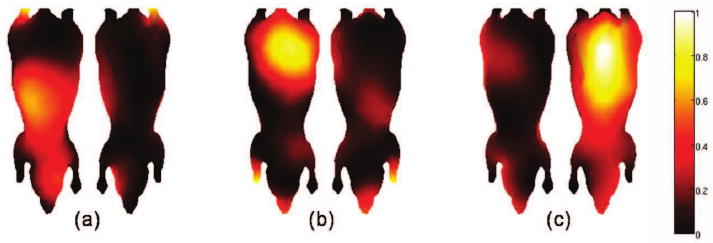
We obtained a set of three optimal spatial illumination patterns for the Digimouse atlas using the formulation in (15) and (16). The reference set of patterns was normalized to match the intensity of the optimal set. Top and bottom views of the mouse atlas with the optimal set of patterns displayed on it are shown in Fig. 3. Owing to the use of spatially smooth basis functions, the optimal patterns look smooth.
Fig. 3.

Optimal set of illumination patterns displayed on the Digimouse atlas. From left to right, we have: (a) top and bottom views of the first pattern, (b) top and bottom views of the second pattern, and (c) top and bottom views of the third pattern.
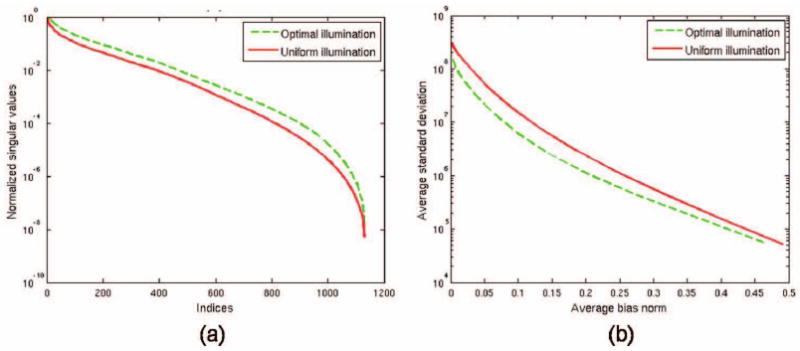
The performance of the optimal scheme was compared with that of the three-view uniform illumination scheme by plotting singular values and bias-variance curves (Fig. 4). Both comparisons highlight merits of the optimal illumination scheme over uniform illumination. A comparative look at the bias-variance curves in Figs. 2(b) and 4(b) indicates that the uniform and optimal illumination schemes (which are more distributed in nature) significantly outperform the localized standard patterns tested in Section 4.
Fig. 4.

Performance comparison of optimal illumination with uniform illumination as revealed by (a) the singular value distributions and (b) bias vs. variance analysis.
7. Discussion
We have developed an optimization framework for generating optimal spatial illumination patterns for FMT. The problem of optimal illumination has been formulated as a constrained optimization problem which tunes the Fisher information matrix to maximize the information content in the data. The dimensionality of the optimization problem was reduced using a set of geometrical basis functions defined on the mouse manifold. Spatial patterns for optimally illuminating the mouse atlas were computed using this method. These have been shown to perform better than a uniform illumination scheme on the basis of condition number and bias-variance curves. However, owing to the fourth-order cost function used, the optimal result obtained represents a local optimum and is highly dependent on initialization.
The obtained patterns look smooth and are geometrically intuitive, in the sense that together the three patterns seem to illuminate almost all parts of the mouse surface. Our results here assume only three illumination patterns in each set. Since typical FMT experimental setups use a larger number (say > 10) of illumination patterns, we intend to explore the feasibility of computing larger sets of patterns using our approach. Also, since in an experimental setting, it may not be feasible to illuminate the entire mouse surface at one go, we could enforce spatial constraints on the illumination patterns.
It must be noted that our framework assumes knowledge of mouse surface topography and internal optical properties, and the forward problem must be solved prior to the optimization procedure. It might not be practical to repeat the optimization procedure for each animal in between the surface profiling and fluorescence data acquisition steps of an experiment. A feasible solution to this might be to use the atlas as a surrogate and to warp the optimal patterns onto the surface of each animal.
Acknowledgments
This work was supported by the National Cancer Institute under grants R01CA121783 and R44CA138243.
References
- 1.Weissleder R, Ntziachristos V. Shedding light onto live molecular targets. Nature Med. 2003;9:123–128. doi: 10.1038/nm0103-123. [DOI] [PubMed] [Google Scholar]
- 2.Gibson AP, Hebden JC, Arridge SR. Recent advances in diffuse optical imaging. Phys Med Biol. 2005 doi: 10.1088/0031-9155/50/4/r01. [DOI] [PubMed] [Google Scholar]
- 3.Graves EE, Ripoll J, Weissleder R, Ntziachristos V. A submillimeter resolution fluorescence molecular imaging system for small animal imaging. Medical Physics. 2003;30(no. 5):901–911. doi: 10.1118/1.1568977. [DOI] [PubMed] [Google Scholar]
- 4.Joshi A, Bangerth W, Sevick-Muraca EM. Non-contact fluorescence optical tomography with scanning patterned illumination. Opt Express. 2006;14(no. 14):6516–6534. doi: 10.1364/oe.14.006516. [DOI] [PubMed] [Google Scholar]
- 5.Arridge S. Optical tomography in medical imaging. Inv Problems. 1999;15(no. 2):41–93. [Google Scholar]
- 6.Hero AO, III, Fessler JA, Usman M. Exploring estimator bias-variance tradeoffs using the uniform CR bound. IEEE Trans Signal Processing. 1996;44(no. 8):2026–2041. [Google Scholar]
- 7.Dogdas B, Stout D, Chatziioannou A, Leahy RM. Digimouse: A 3D whole body mouse atlas from CT and cryosection data. Phys Med Biol. 2007;52:577–587. doi: 10.1088/0031-9155/52/3/003. [DOI] [PMC free article] [PubMed] [Google Scholar]
- 8.Arridge SR, Schweiger M, Hiroaka M, Delpy DT. A finite element approach for modeling photon transport in tissue. Med Phys. 1993;20(no. 2):299–309. doi: 10.1118/1.597069. [DOI] [PubMed] [Google Scholar]
- 9.Cheong WF, Prahl SA, Welch AJ. A review of the optical properties of biological tissues. IEEE J Quantum Electron. 1990;26:2166–2185. [Google Scholar]
- 10.Kay SM. Fundamentals of Statistical Signal Processing: Estimation Theory. Prentice Hall; Englewood Cliffs, NJ: 1993. [Google Scholar]
- 11.Qiu A, Bitouk D, Miller MI. Smooth functional and structural maps on the neocortex via orthonormal bases of the Laplace-Beltrami operator. IEEE Trans Medical Imaging. 2006;25(no. 10):1296–1306. doi: 10.1109/tmi.2006.882143. [DOI] [PubMed] [Google Scholar]


