Abstract
Purpose: Digital tomosynthesis (DTS) recently gained extensive research interests in both diagnostic and radiation therapy fields. Conventional DTS images are generated by scanning an x-ray source and flat-panel detector pair on opposite sides of an object, with the scanning trajectory on a one-dimensional curve. A novel tomosynthesis method named solid-angle tomosynthesis (SAT) is proposed, where the x-ray source scans on an arbitrary shaped two-dimensional surface.
Methods: An iterative algorithm in the form of total variation regulated expectation maximization is developed for SAT image reconstruction. The feasibility and effectiveness of SAT is corroborated by computer simulation studies using three-dimensional (3D) numerical phantoms including a 3D Shepp–Logan phantom and a volumetric CT image set of a human breast.
Results: SAT is able to cover more space in Fourier domain more uniformly than conventional DTS. Greater coverage and more isotropy in the frequency domain translate to fewer artifacts and more accurately restored features in the in-plane reconstruction.
Conclusions: Comparing with conventional DTS, SAT allows cone-shaped x-ray beams to project from more solid angles, thus provides more coverage in the spatial-frequency domain, resulting in better quality of reconstructed image.
Keywords: DTS, tomosynthesis, IGRT
INTRODUCTION
Conventional DTS
Digital tomosynthesis (DTS) is a pseudo-3D x-ray imaging modality that has been extensively investigated for diagnostic imaging1, 2, 3, 4, 5 and image guided radiotherapy (IGRT).6, 7, 8, 9 DTS provides tomographiclike images with modest quality in slices that are parallel to and close to the in-focus plane. It is well-known that for cone-beam computed tomography (CBCT) to reconstruct accurate tomographic images, it requires a minimum 180° plus fan-angle scanning range. In comparison, DTS only needs to scan in a smaller (usually much smaller) angular range. Hence, compared to CBCT, DTS requires (1) less restrictive hardware accessibility and (2) less number of projections (assuming the same angular interval between projections), thus less acquisition time and imaging dose.10, 11, 12
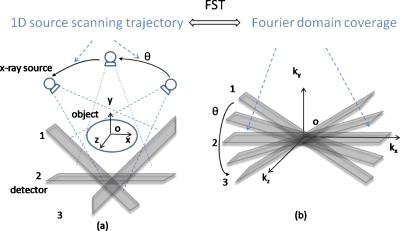
There are different scanning geometries of DTS depending on how the x-ray source moves its position relative to the detector during data acquisition. Those include: Linear DTS, where the source and the detector both move parallel to the focus plane in relative opposing directions;13, 14, 15, 16 partial isocentric scanning DTS, where the detector stays in one plane while the source rotates around the isocenter;2, 3, 4, 5 and circular DTS, where the source rotates around a fixed axis that passes through the object with the detector either rotating17 or fixed.18 With the prevalence of large flat panel detector (FPD), such as used in the gantry mounted on-board imaging (OBI) system, the DTS geometry described by Fig. 1a is being widely studied. In this isocentric rotating imaging setup, both the x-ray source and the detector rotate around the isocenter in synchrony.
Figure 1.
Schematic illustration of conventional DTS technique using OBI system. According to the FST, the data collected in the image domain in (a) correspond to the shaded area enclosed by plane1 and plane3 in the Fourier domain in (b).
Investigation on image artifacts of DTS
According to the Fourier slice theorem (FST), data collected by DTS in the image domain in Fig. 1a correspond to the shaded area enclosed by plane1 and plane3 in the three-dimensional (3D) Fourier domain in Fig. 1b (FST is strictly accurate only for parallel beams and approximately accurate for cone beams with small x-ray diverging angles). The unsampled Fourier domain, i.e., the unshaded area in Fig. 1b, manifests in the image domain as cluttering artifact emanating from out-of-plane structures and poor resolution in the depth dimension.17, 19, 20 Another well-known DTS artifact is the appearance of radial streaks in the plane-to-plane direction or stair-steps in the in-plane direction, when an overly sparse angular sampling scheme is employed.
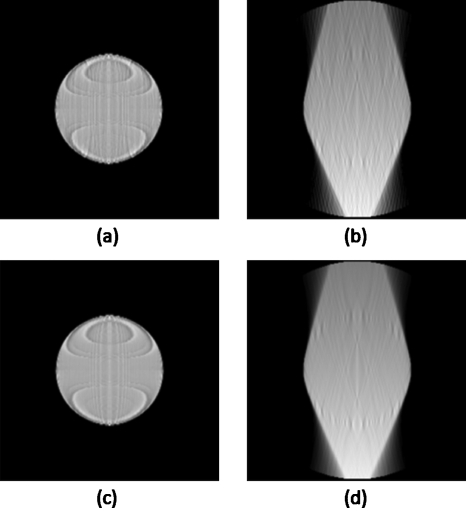
Figures 2a, 2b show the in-plane and cross-plane, respectively, of the example DTS images of a spherical object, where 20 projections are evenly spaced in a 40° range (2° angular spacing between adjacent projections). Results of a “denser” DTS scanning scheme are shown in Figs. 2c, 2d, where 80 projections are evenly spaced in the 40° range (0.5° spacing). The images shown in Fig. 2 are reconstructed using standard FDK algorithm. The ringing artifact seen on the in-plane images of Fig. 2 is believed to be due to the discretization effects in the numerical simulation7, 21 and will not be further investigated in this work. The in-plane and cross-plane images from dense scanning are visually identical to those using 2° angular spacing, which illustrates the image characteristics and artifacts of DTS are caused by the limited Fourier coverage instead of angular undersampling (too few projections). It suggests that above a relative relaxed threshold (several degrees), denser angular sampling does not warrant further-improved DTS image quality. This is also consistent with the results from quantitative analysis performed by Sechopoulos and Ghetti.11 In light of this observation, efforts to improve DTS image quality should be naturally diverted to expanding the Fourier coverage to the maximally allowed.
Figure 2.
Example DTS images of a spherical object. Displayed are the in-plane reconstruction slices on the left and the cross-plane slices on the right. All results are from DTS simulations using angular scanning range of 40°, where projections are evenly spaced at a sparser interval (2°, top row) and a denser interval (0.5°, bottom row), respectively.
METHODS
In the spirit of covering more Fourier domain than conventional DTS, a novel method is proposed where the source (or source∕detector pair) is allowed to scan on a two-dimensional (2D) aperture utilizing the source and FPD apparatus as used in Fig. 1a. The new scanning method is named solid-angle tomosynthesis (SAT) to emphasize its solid-angle scanning coverage and to distinguish it from the plane-angle scanning in conventional one-dimensional (1D) DTS.
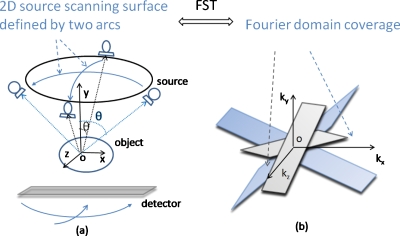
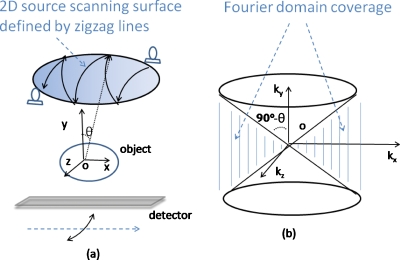
Two examples of SAT are shown in Figs. 3a, 4a, where the x-ray sources scan on 2D spherical surfaces. The first is called two-arc SAT whose scanning surface in Fig. 3a is formed by two orthogonal arcs. The second SAT scheme is based on scanning surface formed by the zigzag lines in Fig. 4a. In Fig. 1b, the sampled Fourier region is the shaded revolving-door shape enclosed by plane1 and plane3. In Fig. 3b, it is two such perpendicular shapes. In Fig. 4b, the whole Fourier space subtracts the two cones as pointed by the arrows. By comparing the shaded regions of Figs. 134, it can be found that the SAT scheme covers greater space in Fourier domain with more isotropy compared to DTS. These aspects will translate to better resolution and fewer artifacts in reconstructed images.
Figure 3.
One example of SAT scheme, where the scanning surface in (a) is formed by two orthogonal arcs. Sampled Fourier region consists of two shaded revolving-door shapes, as pointed by arrows in (b).
Figure 4.
Another SAT example where the scanning trajectory (defined by the zigzag lines) covers a patch of a spherical surface in (a). Sampled Fourier region corresponds to the whole space minus the two cones (upper and bottom), as pointed by arrows in (b), which is a bigger region and more isotropic than that of DTS shown in Fig. 1.
Reconstruction algorithm
An iterative reconstruction algorithm is developed to produce tomosynthesis images for SAT. The algorithm is based on expectation maximization (EM) framework22 and includes a total variation (TV) regularization function that preserves edges of images.23 The TV-EM algorithm is applicable to arbitrary scanning geometry, a desirable feature suited for SAT reconstruction. Computer simulation studies are performed to test the results of SAT with different scanning schemes using numerical phantoms, including a 3D Shepp–Logan phantom and a volumetric CT image set of a human breast, acquired at Department of Radiology, University of California Davis by using a dedicated prone breast CBCT system. SAT images are compared to those reconstructed from conventional DTS.
Conventional DTS image reconstruction algorithms include analytical ones such as shift-and-add2, 3 and filtered back-projection,7, 17 iterative methods such as maximum likelihood,4, 5 and algebraic methods such as algebraic reconstruction techniques4, 15 and matrix inversion.16 There is no existing analytic formula for solid-angle tomosynthesis image reconstruction and it may be difficult to develop a closed-form one because the scanning geometry of SAT is not canonical. Therefore, we adopt the iterative reconstruction algorithm for circular CBCT using EM.22 This EM algorithm also includes a TV regularization function that not only suppresses noises but also effectively preserves edges in piecewise constant object.23 The TV-EM algorithm is given by Eq. 1
| (1) |
In the equation, fk is the kth iteration of the reconstructed image, g is the projection data acquired on the detector plane when the source is at any specific solid angle θ, and g0 is the unity projection data for generating mask image. P and B are x-ray forward-projection and back-projection operators at angle θ, respectively. β is the regularization parameter that controls the trade-off between noise and resolution in reconstructed image. U(f) is the total variation of function f and is evaluated by
| (2) |
where ε is a small positive number to ensure U is differentiable with respect to f. The TV norm measures the “intensity” of discontinuities of the image and the introduction of this TV term in the EM iterative formula helps to suppress random noises without blurring structural edges in the image. This TV-EM algorithm were previously developed and implemented for CT and SPECT image reconstruction.23 In this work, it is extended to the reconstruction problems of proposed solid-angle tomosynthesis.
Computer simulations
Shepp–Logan phantom
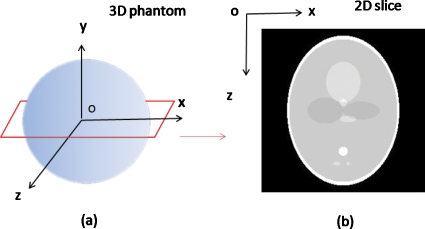
A numerical 3D Shepp–Logan phantom is used which contains ten ellipsoidal structures within 2563 cubical voxels. The ellipsoids are with different sizes, orientations, and x-ray attenuation coefficients. To facilitate the evaluation of the slices near the center of tomosynthesis reconstruction, most of the structures are placed close to the center of the phantom. The x∕y∕z coordinate system is shown in Fig. 5a, in which the 3D phantom is defined, and the central x-z slice of the phantom is shown in Fig. 5b.
Figure 5.
3D Shepp–Logan phantom used for the computer simulations (a) and central x-z slice of the phantom (b).
The forward x-ray projection data (line integrals) are generated by simple ray-tracing method, neglecting the scattering, beam hardening, and detector response effects. At each source angle, the attenuation coefficients map of the phantom is projected onto a virtual FPD containing 256×256 pixels. The detector is always perpendicular to the source-isocenter axis. The source-to-isocenter distance is five times the radius of the phantom.
Conventional single-arc DTS, two-arc SAT, and zigzag SAT are simulated. In DTS, the source∕detector pair rotates about Z-axis for a single arc of 20° length. In the two-arc scheme shown by Fig. 3a, the source∕detector pair first rotates for a 20° arc about Z-axis and then another 20° arc about X-axis. In the SAT illustrated by Fig. 4a, the x-ray source trajectory consists of ten 20° arcs in zigzag pattern. Tomosynthesis images that are of the same dimension and size as the original phantom are reconstructed using the TV-EM algorithm described in Sec. 2A. Comparison is made under the condition that total number of projections is the same (120) for each method.
Digital breast phantom
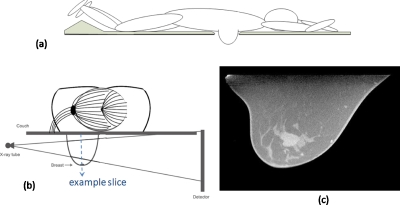
A CBCT reconstruction of a human breast is used as digital phantom. The CT images are acquired with CT contrast using the dedicated 80 kVp breast CT scanner developed at UC Davis.24 The breast phantom is represented by a 512×512×300 matrix. The first two dimensions of the matrix define slices parallel to the couch on which the patient lies prone, each slice containing 512×512 of (∼0.4mm)2 pixels. There are 300 such slices stacking along the breast base-apex axis with slice thickness ∼0.47 mm. Figure 6c is one example slice (512×300 matrix) parallel to the detector plane marked by the dashed line in Fig. 6b. A tumor in the center is clearly visible. Numerical projection data are simulated as line integrals of the breast phantom similarly as in the Shepp–Logan phantom study. The FPD plane contains 480×330 of (0.56 mm)2 detector elements. The source is 50 cm away from the center of rotation.
Figure 6.
(a) The side-view of a hypothetical prone-position breast imaging system and (b) its head-on view. (c) shows a slice of a digital breast phantom, parallel to the detector plane marked by the dashed line in (b). The digital breast phantom is the CT image acquired with CT contrast, using the dedicated breast CT scanner developed at UC Davis
A hypothetical x-ray breast imaging system is depicted by side-view Fig. 6a and head-on view Fig. 6b. It is desired that the x-ray source be placed at the same level as the couch (beyond the couch edge) as shown in Fig. 6b. This way, parallel x-ray beams can pass breast tissues near the bottom surface of the couch and reach the detector, and therefore expand the image region toward the chest wall region. However, this limits the x-ray source rotation in the horizontal plane within an angular range smaller than 180° on one side of the couch, in the avoidance of collision between the bulky tube and long couch. The maximal scanning range in the horizontal plane is calculated to be 120° for the hypothetical device. The range of the source translation∕rotation in the vertical dimension is virtually unlimited below the couch level.
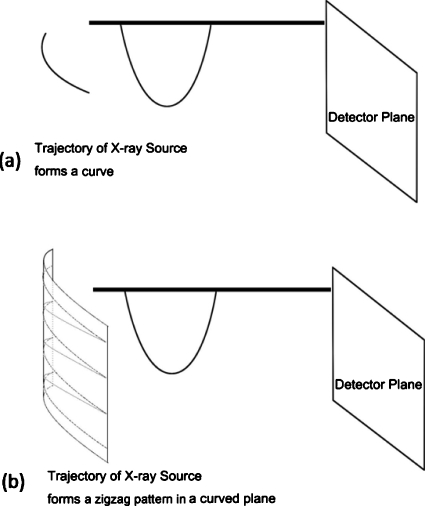
First simulated are DTS∕SAT scanning schemes that fully utilize mechanical accessibility described above. This scenario is relevant when the image quality is the primary task and imaging dose is of less concern; such is the case in image guidance for breast radiotherapy. A DTS method is simulated shown in Fig. 7a, where the x-ray source rotates around the breast base-apex axis on a 120° arc of the same level as the couch. The projection data are sampled every 1°. In Fig. 7b, the SAT scheme is simulated where the x-ray source moves in zigzag pattern relative to the breast. The x-ray source trajectory consists of five 120° zigzag arcs on the cylindrical surface, with the first arc starting parallel with the couch level. The source translates from the level of couch surface down to the level of nipple while it rotates, thus opens up approximately 15° zenith angle (relative to the isocenter) while scanning back and forth azimuthally.
Figure 7.
(a) illustrates conventional DTS scan using the breast imaging system depicted by Fig. 6. The x-ray source rotates around the breast on an arc at the couch level. (b) illustrates the SAT scheme where the x-ray source moves in zigzag pattern relative to the breast. The source trajectory consists of the several arcs on the cylindrical surface, with the first arc starting from the couch level.
Lower-exposure scanning schemes are simulated to be more relevant to diagnostic applications where imaging dose is a limiting factor. In a conventional DTS system modified from a regular mammography unit, the angular range is usually much smaller than the previously used 120° and the total number of projections is also much smaller. This scenario is simulated by reducing the azimuth angular range from 120° to 30° in the last simulation study while keeping other scanning parameters the same.
In both scenarios, to compare image quality under the same patient exposure, SAT projections on each arc are spaced five times more sparsely than DTS projections, which results in the same total number of projections as DTS in each scenario. The total number of projections is 120 for both SAT and DTS in the wide angle scenario (IGRT) and 30 in the narrow angle scenario (diagnostic). Images are reconstructed with TV-EM algorithm and have the same dimension and size as the original breast phantom.
RESULTS
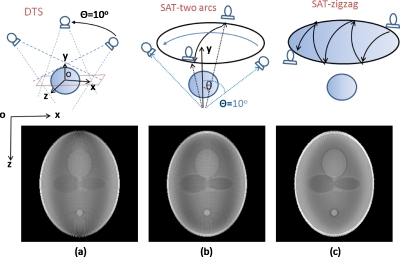
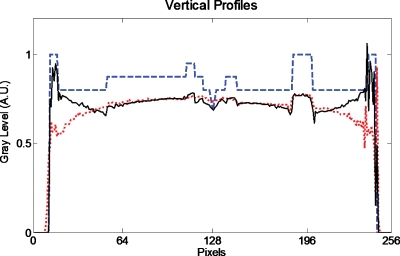
Figure 8 shows reconstructed central in-plane slices of the Shepp–Logan phantom. Figures 8a, 8b, 8c correspond to conventional DTS, two-arc SAT, and zigzag SAT scanning schemes, illustrated on the top row, respectively. All reconstructed images are displayed with the same window∕level for fair comparison. Figure 9 shows the vertical (along Z-axis) profiles of the true object (dashed blue line), conventional DTS image (dotted red line), and zigzag SAT image (solid black line).
Figure 8.
Reconstructed slices of the Shepp–Logan phantom by using (a) conventional DTS, (b) two-arc SAT, and (c) zigzag SAT scanning schemes, respectively, as illustrated on the top row. The total number of projections is the same for each method.
Figure 9.
Vertical profile through the center of the true object [Fig. 5b] (dashed line), the conventional DTS image [Fig. 8a] (dotted line), and the zigzag SAT image [Fig. 8c] (solid line).
In the DTS image [Fig. 8a], the shapes of the ellipsoid structures are slightly distorted due to out-of-plane cluttering, a common feature in a typical DTS (or limited angle tomography) reconstruction. Another feature of the DTS image is that the boundaries∕edges perpendicular to Z-axis are not fully recovered, while the edges perpendicular to X-axis are relatively well-preserved. These artifacts can be explained using FST described by Fig. 1. The off-plane blurring artifacts are due to anisotropic filling patterns of the Fourier domain, especially in the Kz-Kx plane; and the blurred Z-axis crossing edges are caused by missing high Kz components, which can also be seen in the vertical profile Fig. 9.
The two-arc SAT samples the Fourier domain in two revolving-door regions, with the door shafts (Kz∕Kx) perpendicular to each other as shown in Fig. 3b. This doubles the coverage of DTS and provides the high Kz components missed by the DTS. The two-arc SAT also provides slightly better isotropy than single-arc DTS because the Fourier domain is filled along two orthogonal directions instead of one. As a result, the reconstructed slice of two-arc SAT [Fig. 8b] shows less severe out-of-plane cluttering artifacts and better-preserved Z-axis crossing edges. As shown in Fig. 4b, the Fourier coverage for zigzag SAT is not only larger but also more rotational symmetric in the Kz-Kx plane. Consequently, the ZX-plane of the reconstruction [Fig. 8c] more accurately displays the true shapes of inside structures of the phantom and is isotropic in all in-plane directions. As shown in Fig. 9, the vertical profile of the zigzag SAT (solid line) shows more accurately the restoration of the attenuation coefficients compared to DTS (dotted line), especially in the peripheral region. It can also be seen that the boundaries in the displayed profiles are sharper in SAT than in DTS. Also, notice that the two smallest ellipsoids with low contrast near the bottom of the phantom [see Fig. 5b] are completely absent in the DTS reconstruction slice but clearly visible in zigzag SAT.
On the other hand, image quality improvements in the depth dimension (along Y-axis) are not visually observed, which is similar to the cross-plane characteristics of conventional DTS. The cross-plane slices of SAT have poor image quality and provide no diagnostic values. This result is also expected because the SAT schemes in Figs. 34 extend the Fourier coverage mainly in the Kx and Kz dimensions, but do not provide much more Ky components than DTS does.
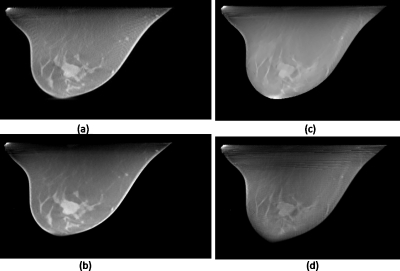
Figure 10 shows reconstructed breast images using DTS method [Figs. 10a, 10c] and zigzag SAT method [Figs. 10b, 10d]. Images are displayed at the same window∕level when comparing SAT with DTS. In this case, the DTS scans (top row) are sample at 1° angular density and the zigzag SAT scans are (bottom row) sampled at a much sparser (5°) density, no longer “sufficiently” dense. Therefore, the radial streaking artifact due to sparse angular sampling is prominent on the SAT images. On the other hand, because the SAT covers a greater Fourier space than the DTS (solid-angle vs plane-angle coverage), the out-of-plane cluttering artifact is stronger on the DTS images, especially in the peripherals regions of the breast. In such cases when sufficiently dense sampling is unavailable, the trade-off between angular density and Fourier coverage should be carefully balanced and optimized based on objective measures such as task-based image assessments.
Figure 10.
Reconstructed breast images using DTS method (top row) and SAT method (bottom row), as described by Figs. 7a, 7b, respectively. The left column corresponds to scanning conditions of 120° arc(s) and 120 total number of projections, for both (a) DTS and (b) SAT; and the right column corresponds to 30° arc(s) and 30 projections for both (c) DTS and (d) SAT.
DISCUSSIONS
The rationale for SAT is that better results will be achieved by using less constrained scanning trajectories. The scanning trajectory of SAT is not confined to 1D as it is in conventional DTS; rather, it forms a 2D scanning surface. SAT imaging system offers one more dimension of flexibility in data acquisition by allowing more general-shaped x-ray source scanning trajectories. According to FST of computed tomography, SAT is able to cover greater space in Fourier domain more uniformly than conventional DTS. Greater coverage and more isotropy in the frequency domain translate to less artifacts and better resolution in the space domain.
Computer simulations are performed using digital phantoms and simulation data for proof-of-principle. Although lack of clinical presentation, the use of all-computer simulation has the advantage of excluding the effects of data inconsistency due to nonideal physical factors such as scattering, beam hardening, detector response, etc. This significantly simplifies the task of comparing the image quality differences due to different x-ray scanning schemes.
Currently, the two proposed SAT schemes cannot be conveniently implemented on imaging apparatuses available at ordinary clinics. The two-arc SAT implementation would be straightforward if the imaging system had two orthogonal rotation axes. With existing OBI that has only one rotation axis, two-arc SAT could be implemented by performing one arc with couch angle at 0° and the other at 90°. This may be clinically impractical since it requires excessive setup and scanning time and may possibly cause collision between couch and imaging apparatus. The zigzag SAT could be implemented using existing OBI by simultaneous translating the imaging couch while scanning the x-ray source back and forth, if automatic gantry∕couch synchronized motion is allowed. Although proposed SAT methods are impractical or inconvenient using current clinically available apparatus, it is reasonable to believe their practicality when specific device is developed in the future.
When the imaging dose is of less concern, e.g., in IGRT with current OBI system, CBCT is the preferred choice of scanning method since it offers (almost) complete Fourier coverage hence great image quality. However, sometimes the 180° plus fan-angle scanning range required by CBCT reconstruction is not achievable, due to limited mechanical clearance. Such is the case for our hypothetical breast imaging device described in Sec. 2B2, where the maximal allowed range is less than 120°. In such cases, SAT is obviously more capable than DTS in that it provides better image quality by scanning a larger portion in the mechanically accessible region.
SAT concept can also find applications in diagnostic or screening imaging tasks where short acquisition time and low imaging dose are necessary. In these applications, SAT is able to provide superior image quality compared to DTS using the same total number of projections (or total exposure), as shown by the simulation studies.
The comparison results of simulation studies are consistent with previous Fourier analysis. As the conclusions on artifacts can be reasonably drawn from visual inspection, the image quality improvements of SAT over DTS are hard to measure. In this work, profiles of reconstructed images are used to demonstrate the results quantitatively. More comprehensive and objective image assessment using sophisticated tools such as receiver operating characteristic analysis is beyond the scope of this paper and would be an interesting topic for future research.
CONCLUSIONS
One common feature of conventional DTS methods is that they involve scanning the x-ray source on a 1D curve. In this paper, a SAT scanning scheme is proposed and a TV-EM iterative algorithm dedicated for SAT image reconstruction is implemented. SAT covers greater space in Fourier domain more isotropically than conventional DTS. Computer simulation studies demonstrate that SAT provides image quality superior to conventional DTS by restoring more anatomical features and reducing artifacts.
ACKNOWLEDGMENTS
The authors thank Professor John Boone of the University of California Davis Medical Center for providing the digital breast phantom. The authors also thank the anonymous Associate Editor, whose extraordinary efforts greatly help improve the quality of this work through iterations.
References
- J. T.DobbinsIII and Godfrey D. J., “Digital x-ray tomosynthesis: Current state of the art and clinical potential,” Phys. Med. Biol. 48(19), R65–R106 (2003). 10.1088/0031-9155/48/19/R01 [DOI] [PubMed] [Google Scholar]
- Niklason L. T. et al. , “Digital tomosynthesis in breast imaging,” Radiology 205(2), 399–406 (1997). [DOI] [PubMed] [Google Scholar]
- Suryanarayanan S., Karellas A., Vedantham S., Glick S. J., D’Orsi C. J., Baker S. P., and Webber R. L., “Comparison of tomosynthesis methods used with digital mammography,” Acad. Radiol. 7(12), 1085–1097 (2000). 10.1016/S1076-6332(00)80061-6 [DOI] [PubMed] [Google Scholar]
- Zhang Y., Chan H. P., Sahiner B., Wei J., Goodsitt M. M., Hadjiiski L. M., Ge J., and Zhou C., “A comparative study of limited-angle cone-beam reconstruction methods for breast tomosynthesis,” Med. Phys. 33(10), 3781–3795 (2006). 10.1118/1.2237543 [DOI] [PMC free article] [PubMed] [Google Scholar]
- Wu T., Stewart A., Stanton M., McCauley T., Phillips W., Kopans D. B., Moore R. H., Eberhard J. W., Opsahl-Ong B., Niklason L., and Williams M. B., “Tomographic mammography using a limited number of low-dose cone-beam projection images,” Med. Phys. 30(3), 365–380 (2003). 10.1118/1.1543934 [DOI] [PubMed] [Google Scholar]
- Wu Q. J., Godfrey D. J., Wang Z., Zhang J., Zhou S., Yoo S., Brizel D. M., and Yin F. F., “On-board patient positioning for head-and-neck IMRT: Comparing digital tomosynthesis to kilovoltage radiography and cone-beam computed tomography,” Int. J. Radiat. Oncol., Biol., Phys. 69(2), 598–606 (2007). 10.1016/j.ijrobp.2007.05.045 [DOI] [PubMed] [Google Scholar]
- Godfrey D. J., Yin F. F., Oldham M., Yoo S., and Willett C., “Digital tomosynthesis with an on-board kilovoltage imaging device,” Int. J. Radiat. Oncol., Biol., Phys. 65(1), 8–15 (2006). 10.1016/j.ijrobp.2006.01.025 [DOI] [PubMed] [Google Scholar]
- Yoo S., Wu Q. J., Godfrey D., Yan H., Ren L., Das S., Lee W. R., and Yin F. F., “Clinical evaluation of positioning verification using digital tomosynthesis and bony anatomy and soft tissues for prostate image-guided radiotherapy,” Int. J. Radiat. Oncol., Biol., Phys. 73(1), 296–305 (2009). 10.1016/j.ijrobp.2008.09.006 [DOI] [PMC free article] [PubMed] [Google Scholar]
- Mestrovic A., Nichol A., Clark B. G., and Otto K., “Integration of on-line imaging, plan adaptation and radiation delivery: Proof of concept using digital tomosynthesis,” Phys. Med. Biol. 54(12), 3803–3819 (2009). 10.1088/0031-9155/54/12/013 [DOI] [PubMed] [Google Scholar]
- Winey B., Zygmanski P., and Lyatskaya Y., “Evaluation of radiation dose delivered by cone beam CT and tomosynthesis employed for setup of external breast irradiation,” Med. Phys. 36(1), 164–173 (2009). 10.1118/1.3036113 [DOI] [PubMed] [Google Scholar]
- Sechopoulos I. and Ghetti C., “Optimization of the acquisition geometry in digital tomosynthesis of the breast,” Med. Phys. 36(4), 1199–1207 (2009). 10.1118/1.3090889 [DOI] [PubMed] [Google Scholar]
- Das M., Gifford H. C., O’Connor J. M., and Glick S. J., “Evaluation of a variable dose acquisition technique for microcalcification and mass detection in digital breast tomosynthesis,” Med. Phys. 36(6), 1976–1984 (2009). 10.1118/1.3116902 [DOI] [PMC free article] [PubMed] [Google Scholar]
- Zhao B. and Zhao W., “Three-dimensional linear system analysis for breast tomosynthesis,” Med. Phys. 35(12), 5219–5232 (2008). 10.1118/1.2996014 [DOI] [PMC free article] [PubMed] [Google Scholar]
- Zhao B., Zhou J., Hu Y. H., Mertelmeier T., Ludwig J., and Zhao W., “Experimental validation of a three-dimensional linear system model for breast tomosynthesis,” Med. Phys. 36(1), 240–251 (2009). 10.1118/1.3040178 [DOI] [PMC free article] [PubMed] [Google Scholar]
- Bleuet P., Guillemaud R., Desbat L., and Magnin I., “An adapted fan volume sampling scheme for 3-D algebraic reconstruction in linear tomosynthesis,” IEEE Trans. Nucl. Med. 49(5), 2366–2372 (2002). 10.1109/TNS.2002.803683 [DOI] [Google Scholar]
- Godfrey D. J., McAdams H. P., and J. T.DobbinsIII, “Optimization of the matrix inversion tomosynthesis (MITS) impulse response and modulation transfer function characteristics for chest imaging,” Med. Phys. 33(3), 655–667 (2006). 10.1118/1.2170398 [DOI] [PubMed] [Google Scholar]
- Stevens G. M., Fahrig R., and Pelc N. J., “Filtered backprojection for modifying the impulse response of circular tomosynthesis,” Med. Phys. 28(3), 372–380 (2001). 10.1118/1.1350588 [DOI] [PubMed] [Google Scholar]
- Maltz J. S., Sprenger F., Fuerst J., Paidi A., Fadler F., and Bani-Hashemi A. R., “Fixed gantry tomosynthesis system for radiation therapy image guidance based on a multiple source x-ray tube with carbon nanotube cathodes,” Med. Phys. 36(5), 1624–1636 (2009). 10.1118/1.3110067 [DOI] [PubMed] [Google Scholar]
- Hu Y. H., Zhao B., and Zhao W., “Image artifacts in digital breast tomosynthesis: Investigation of the effects of system geometry and reconstruction parameters using a linear system approach,” Med. Phys. 35(12), 5242–5252 (2008). 10.1118/1.2996110 [DOI] [PMC free article] [PubMed] [Google Scholar]
- Kak A. C. and Slaney M., Principles of Computerized Tomographic Imaging (Society for Industrial Mathematics, Philadelphia, 2001). [Google Scholar]
- Yu H., Zhao S., and Wang G., “A differentiable Shepp-Logan phantom and its applications in exact cone-beam CT,” Phys. Med. Biol. 50(23), 5583–5595 (2005). 10.1088/0031-9155/50/23/012 [DOI] [PubMed] [Google Scholar]
- Zhang J., Shi D., Anastasio M. A., Sillanpaa J., and Chang J., “Weighted expectation maximization reconstruction algorithms with application to gated megavoltage tomography,” Phys. Med. Biol. 50(21), N299–307 (2005). 10.1088/0031-9155/50/21/N02 [DOI] [PubMed] [Google Scholar]
- Panin V. Y., Zeng G. L., and Gullberg G. T., “Total variation regulated EM algorithm,” IEEE Trans. Nucl. Sci. 46(6), 2202–2210 (1999). 10.1109/23.819305 [DOI] [Google Scholar]
- Boone J. M., Nelson T. R., Lindfors K. K., and Seibert J. A., “Dedicated breast CT: Radiation dose and image quality evaluation,” Radiology 221(3), 657–667 (2001). 10.1148/radiol.2213010334 [DOI] [PubMed] [Google Scholar]


