Abstract
Purpose: Breast density measurement has the potential to play an important role in individualized breast cancer risk assessment and prevention decisions. Routine evaluation of breast density will require the availability of a low-cost, nonionizing, three-dimensional (3-D) tomographic imaging modality that exploits a strong properties contrast between dense fibroglandular tissue and less dense adipose tissue. The purpose of this computational study is to investigate the performance of 3-D tomography using low-power microwaves to reconstruct the spatial distribution of breast tissue dielectric properties and to evaluate the modality for application to breast density characterization.
Methods: State-of-the-art 3-D numerical breast phantoms that are realistic in both structural and dielectric properties are employed. The test phantoms include one sample from each of four classes of mammographic breast density. Since the properties of these phantoms are known exactly, these testbeds serve as a rigorous benchmark for the imaging results. The distorted Born iterative imaging method is applied to simulated array measurements of the numerical phantoms. The forward solver in the imaging algorithm employs the finite-difference time-domain method of solving the time-domain Maxwell’s equations, and the dielectric profiles are estimated using an integral equation form of the Helmholtz wave equation. A multiple-frequency, bound-constrained, vector field inverse scattering solution is implemented that enables practical inversion of the large-scale 3-D problem. Knowledge of the frequency-dependent characteristic of breast tissues at microwave frequencies is exploited to obtain a parametric reconstruction of the dispersive dielectric profile of the interior of the breast. Imaging is performed on a high-resolution voxel basis and the solution is bounded by a known range of dielectric properties of the constituent breast tissues. The imaging method is validated using a breast phantom with a single, high-contrast interior scattering target in an otherwise homogeneous interior. The method is then used to image a set of realistic numerical breast phantoms of varied fibroglandular tissue density.
Results: Imaging results are presented for each numerical phantom and show robustness of the method relative to tissue density. In each case, the distribution of fibroglandular tissues is well represented in the resulting images. The resolution of the images at the frequencies employed is wider than the feature dimensions of the normal tissue structures, resulting in a smearing of their reconstruction.
Conclusions: The results of this study support the utility of 3-D microwave tomography for imaging the distribution of normal tissues in the breast, specifically, dense fibroglandular tissue versus less dense adipose tissue, and suggest that further investigation of its use for volumetric evaluation of breast density is warranted.
Keywords: microwaves, phantoms, tomography, breast, parametric imaging
INTRODUCTION
Illumination of the human breast at microwave frequencies has been proposed for several medical imaging applications relevant to breast cancer. Microwave technology offers the potential for a low-cost, noninvasive modality in a nonionizing range of the frequency spectrum. The dielectric properties contrast between the constituent breast tissues provides the physical basis for microwave imaging. To date, the primary motivation for developing microwave systems has been the need for improved detection of malignant breast tumors. However, the characterization of the relative density of tissue in a healthy breast is another compelling potential application for microwaves. Density characterization is a valuable component in an overall assessment of an individual’s risk of breast cancer.1 Dense breast tissue results from a large percentage of epithelial and connective tissue, collectively referred to as fibroglandular tissue. The large microwave-frequency dielectric properties contrast between the dense fibroglandular tissue and less dense adipose tissue2 offers a very tractable mechanism for density characterization. This application of microwave imaging is less sensitive to resolution performance than early stage tumor detection. Furthermore, the capability of microwave imaging to identify the spatial features and dielectric properties of the networks of normal fibroglandular tissue structures is an important baseline for the development of tumor imaging methods.
High breast density is one of the strongest predictors of breast cancer risk3 and is fairly common. Approximately half of all women aged 40–49 and a quarter of all women aged 70–79 have breasts that are at least 50% dense, as measured by mammography.4 Women with high breast density have a fourfold to sixfold greater cancer risk than women with less dense tissue.5 The relative risk of dense breast tissue is greater than many traditional risk factors1 and the prevalence of this risk factor is greater than that of most others.6 An increase in breast density over time has been linked to an increase in breast cancer risk, while a decrease in density is associated with decreased risk.3 These study findings point to the importance of breast density evaluation and monitoring and their potential role in individualized risk assessment.
The most common clinical approach to evaluating breast density involves a qualitative visual interpretation of a mammographic image using the Breast Imaging Reporting and Data System (BI-RADS)7 that was established to describe the effect of density on diagnostic accuracy.1 Quantitative measurement has been made possible with computer-aided algorithms.8, 9, 10 However, the accuracy of these techniques is fundamentally limited by the fact that the mammographic image is a 2-D projection of a three-dimensional (3-D) phenomenon. Mammographic density is also sensitive to projection angle, level of compression, and x-ray intensity, which limit the use of mammography for monitoring changes in density.1 Breast density can be accurately measured from 3-D magnetic resonance images (MRI) using quantitative methods.11 However, there are substantial concerns about high costs and limited access to high-quality MRI services. Furthermore, breast MRI is time-consuming, problematic for claustrophobic12 or very obese patients, and prohibited for women with pacemakers. Thus, neither mammography nor MRI is ideally suited for evaluating and monitoring breast density. Three-dimensional tomographic microwave images may therefore offer advantages in volumetric density measurement for risk assessment and the monitoring of density over time.
In this study, we investigate the performance of microwave tomography in imaging normal fibroglandular and adipose breast tissues and thereby evaluate the potential for breast density classification. Our investigation focuses on resolving, locating, and estimating the dielectric properties of healthy fibroglandular and adipose tissue distributions. We employ a method of 3-D microwave tomography for imaging the varied and complex dielectric spatial profiles of realistic breast tissue structures. The imaging method is applied to multifrequency data synthesized from computational electromagnetics simulations of anatomically realistic 3-D numerical breast phantoms. The high-fidelity phantoms13 contain MRI-derived distributions of normal adipose and fibroglandular tissues having dielectric properties based on large-scale dielectric spectroscopy studies.2, 14 Our imaging technique is based on a multiple-frequency inverse scattering method for reconstructing the 3-D profiles of the parameters of a dispersive dielectric model. In our inverse scattering approach the forward solutions are obtained from Maxwell’s equations in the time-domain by the finite-difference time-domain (FDTD) method. A set of integral Helmholtz equations describing the electromagnetic scattering are inverted to estimate the unknown dielectric profiles. We implement both the forward and inverse solutions on a grid of voxels of much smaller dimension than the wavelength of illumination so the resolution available to the implementation is not inhibited by the size of the voxels. The electromagnetic simulations and large-scale inverse solutions required by the imaging method are computationally costly on the voxel grid. Computation of the electromagnetic simulations is accelerated using graphics processing unit (GPU) hardware, while the computational challenge presented by the large-scale inverse problem is met with an efficient regularization and inversion scheme. In addition, we constrain the inversion algorithm based on a priori knowledge by restricting the inverse solution to lie within the known physical range of dielectric properties of the constituent breast tissues. We have implemented a vector field formulation of the inverse scattering problem in order to evaluate the validity of the scalar field approximation in this 3-D application. The effect of measurement noise on the imaging performance of the system is also studied.
In addition to changing the focus of the investigation from tumor detection to the imaging of normal tissue profiles, this work is distinct in several respects from prior microwave breast imaging studies such as those involving synthetic-aperture-radar-based methods,15, 16, 17, 18, 19 time-reversal techniques,20 and tomographic approaches to inverse scattering.21, 22, 23, 24, 25, 26, 27 Namely, the testbeds employed in this work are state-of-the-art 3-D numerical breast phantoms13 that are realistic in both dielectric properties and tissue configurations, and for which the known actual properties distributions serve as a rigorous benchmark for the imaging results. Recent large-scale dielectric spectroscopy studies of freshly excised healthy and diseased breast tissue2, 14 suggest that much of the prior microwave breast imaging research assumed too large of a dielectric contrast between cancerous and healthy glandular tissues and too small of a contrast between normal glandular tissue and fat. Also, existing studies of 3-D microwave tomography of the breast have often focused on piecewise homogeneous object domains,22, 23, 28 which do not effectively capture the spatial complexity of the small features and continuously varying properties distribution of the constitutive tissues. Without the presence of a complex fibroglandular network adjacent to malignant tissue, the resulting phantoms overly simplify the tumor detection problem by creating unrealistically high dielectric contrast and low level of signal clutter from background scattering. This work also differs from our earlier work with realistic numerical breast phantoms29 wherein the 3-D image was formed on a limited-resolution spatial basis and the phantoms included simple tumor models. Hence, the effect of the tumor could not be conclusively distinguished from the normal fibroglandular breast tissue in the reconstructed images.
We proceed in Sec. 2 with a discussion of the test phantoms and the acquisition of simulated array measurements. Section 3 briefly summarizes the theoretical background for electromagnetic inverse scattering and gives the details of our imaging method. Imaging results for each test phantom are given in Sec. 4, along with evaluations of the scalar field approximation, noise performance, and effects of modeling error. We make concluding remarks in Sec. 5.
NUMERICAL BREAST PHANTOMS
Clinical studies provide the most faithful test domain for microwave breast imaging, but present a challenge in the interpretation and registration of the results because the actual dielectric properties of the breast interior are unknown. Although some initial clinical results of microwave breast imaging have been reported,19, 30, 31 clinical studies do not readily lend themselves to rigorous validations of imaging performance. Both numerical and experimental laboratory testbeds permit relatively straightforward performance evaluations since the dielectric properties distributions are known exactly or approximately. Experimental phantoms may be constructed from synthetic materials that accurately mimic tissue dielectric properties,32 but the diverse and complex structural distributions of the breast are difficult to mimic in an experimental phantom. Accordingly, many prior experimental laboratory studies have been restricted to models consisting of arrangements of homogeneous cylindrical24, 26, 33 or spherical17, 18, 34 targets which do not accurately mimic the complexity of the breast. Numerical phantoms offer more flexibility in capturing the structural realism of breast tissue. The dimensionality and complexity of numerical breast models have been limited in the past15, 22, 23, 26, 28, 35, 36, 37 by practical computing constraints and the lack of availability of 3-D anatomically realistic models. However, such limitations have been overcome with parallel computing strategies and the recent development of realistic MRI-derived numerical breast phantoms.13
The 3-D numerical breast phantoms that serve as testbeds in this study are adapted from phantoms in the online repository developed and maintained by the University of Wisconsin Computational Electromagnetics Laboratory (UWCEM).13, 38 The repository phantoms are derived from MRIs of healthy breasts, and thus convey the realistic shape and internal adipose (fatty) and fibroglandular tissue structure of the pendant breast. The range of dielectric properties assigned to each tissue type (adipose, transitional, or fibroglandular) are derived from large-scale dielectric spectroscopy studies of freshly excised breast tissue specimens.2, 14 The repository phantoms are defined on a uniform 0.5 mm voxel grid and include a homogeneous skin layer and a chest wall. In this section, we describe the modifications made to a subset of repository phantoms to adapt them for this study. We also describe the method of acquiring simulated scattered signals from the customized 3-D numerical breast phantoms.
Test phantoms
The dielectric properties assumed in the UWCEM numerical breast phantoms vary over the full range spanning the lower and upper bounds of all reported specimens in a study of ex vivo tissues.2 Cole–Cole curves reported13 for those bounds as well as for the 25th, 50th, and 75th percentile values of adipose and fibroglandular tissues are used to generate a continuum of Cole–Cole curves that model a full range of dispersion properties of tissue in the breast. Over the frequency range of interest here, 0.5–3.5 GHz, a single-pole Debye model sufficiently models the frequency dependence of the complex permittivity of the tissues.
| (1) |
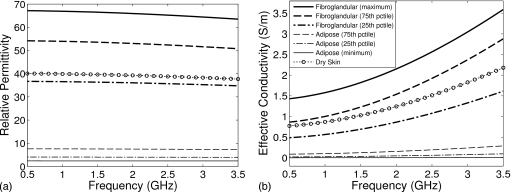
The Debye parameters ε∞, Δε, and σs of the phantom profiles are chosen to fit the single-pole Debye model to the Cole–Cole model over the 0.5–3.5 GHz frequency range. The resulting Debye models for representative tissues are plotted in Fig. 1 and their parametric values are given in Table 1. The assumed dielectric properties of the skin layer39 and the coupling medium (similar to vegetable oil) are also provided in Table 1. The relaxation time constant of the single pole τ is set to 15 ps for all materials and is assumed to be spatially invariant to simplify our electromagnetic simulation code. The quality of the fit of Eq. 1 to the Cole–Cole models is negligibly affected by this assumption.
Figure 1.
Frequency dependence of the single-pole Debye models for representative tissues used in the numerical breast phantoms. (a) Relative permittivity εr and (b) effective conductivity σeff.
Table 1.
Debye parameters (infinite and delta relative permittivity ε∞ and Δε, and static conductivity σs) of the materials modeled in the numerical phantoms (valid from 0.5 to 3.5 GHz).
| Materiala (percentile) | ε∞ | Δε | σs (S∕m) |
|---|---|---|---|
| Adipose tissue (minimum) | 2.28 | 0.141 | 0.0023 |
| Adipose tissue (25th) | 2.74 | 1.33 | 0.0207 |
| Adipose tissue (50th) | 3.11 | 1.70 | 0.0367 |
| Adipose tissue (75th) | 4.09 | 3.54 | 0.0842 |
| Fibroglandular tissue (25th) | 16.8 | 19.9 | 0.461 |
| Fibroglandular tissue (50th) | 17.5 | 31.6 | 0.720 |
| Fibroglandular tissue (75th) | 18.6 | 35.6 | 0.817 |
| Fibroglandular tissue (maximum) | 29.1 | 38.1 | 1.38 |
| Skin tissue | 15.3 | 24.8 | 0.741 |
| Coupling medium | 2.6 | 0.0 | 0.0 |
τ=15 ps for all tissues.
Additional modifications are made to the selected repository phantoms to reduce the computational burden of the imaging procedure. The 1.5 mm thick homogeneous skin layer of each phantom is replaced with a 2.0 mm thick homogeneous layer so that it can be better modeled on the 2.0 mm grid used in the imaging algorithm. In addition, we remove the slab regions of the chest wall model from the phantoms. Finally, the dimensions of the computational domain are adjusted to accommodate the phantom and a surrounding antenna array.
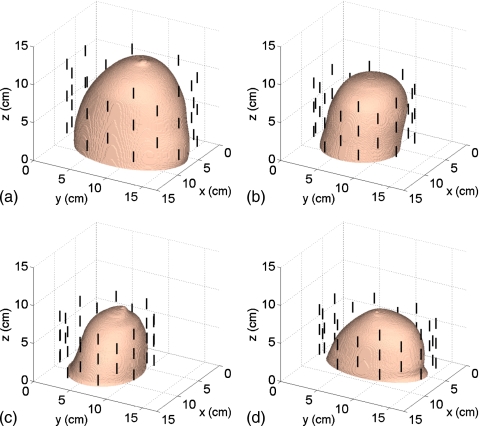
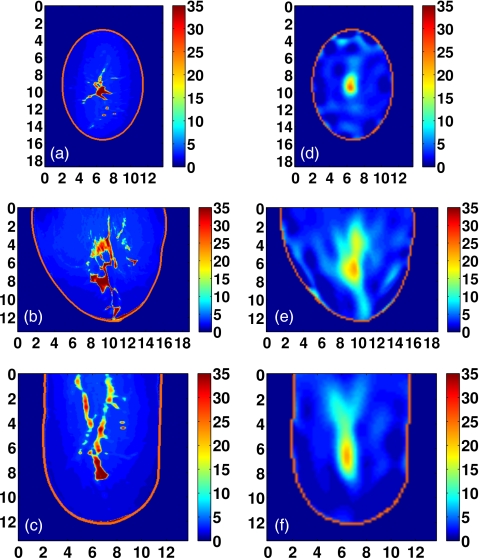
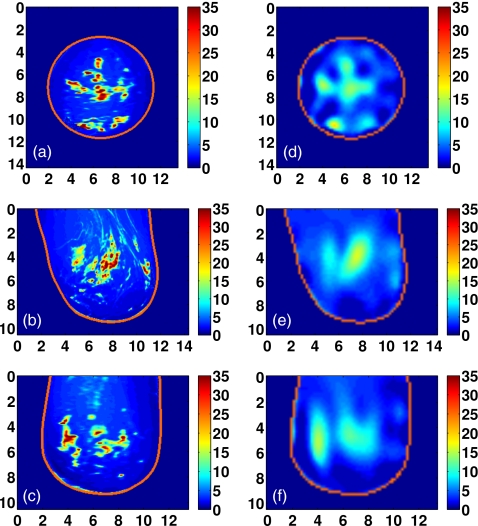
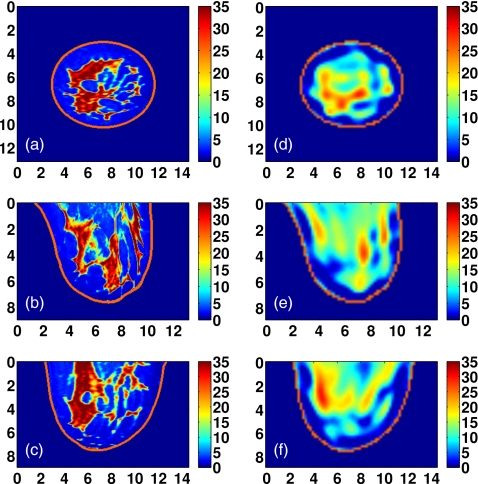
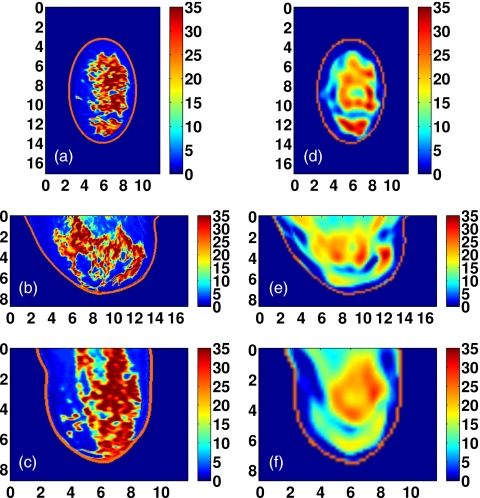
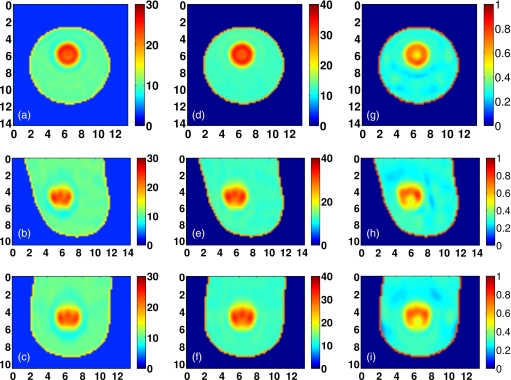
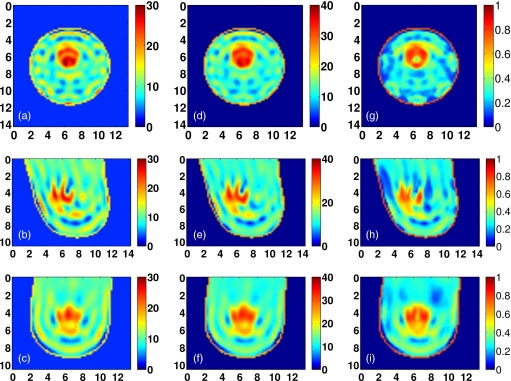
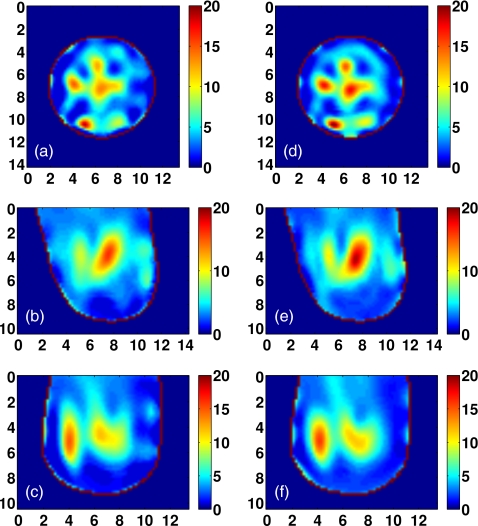
The American College of Radiology (ACR) defines four classes of breast composition based on mammographic breast density: mostly fatty, scattered fibroglandular, heterogeneously dense, and extremely dense.7 We will henceforth refer to these as Class 1, Class 2, Class 3, and Class 4, respectively. We select one representative phantom of each of the four ACR classes from the repository. The repository ID numbers of the selected phantoms are 071904, 010204, 062204, and 012304. The exterior surface of the 3-D model of each phantom is depicted in Fig. 2. Orthogonal 2-D cross-sections of the Δε profile of the interior of each phantom are shown in Sec. 4 (see Figs. 9101112). The ε∞ and σs Debye parameter profiles are similarly distributed, taking on the ranges of values given in Table 1.
Figure 2.
3-D numerical breast phantoms and dipole antenna arrays. (a) Class 1, (b) Class 2, (c) Class 3, and (d) Class 4.
Figure 9.
Class 1 phantom: [(a)–(c)] Exact and [(d)–(f)] reconstructed profiles of Δε shown in coronal (x−y, top row), sagittal (y−z, middle row), and axial (x−z, bottom row) cross-sections. Axes in cm.
Figure 10.
Class 2 phantom: [(a)–(c)] Exact and [(d)–(f)] reconstructed profiles of Δε shown in coronal (x−y, top row), sagittal (y−z, middle row), and axial (x−z, bottom row) cross-sections. Axes in cm.
Figure 11.
Class 3 phantom: [(a)–(c)] Exact and [(d)–(f)] reconstructed profiles of Δε shown in coronal (x−y, top row), sagittal (y−z, middle row), and axial (x−z, bottom row) cross-sections. Axes in cm.
Figure 12.
Class 4 phantom: [(a)–(c)] Exact and [(d)–(f)] reconstructed profiles of Δε shown in coronal (x−y, top row), sagittal (y−z, middle row), and axial (x−z, bottom row) cross-sections. Axes in cm.
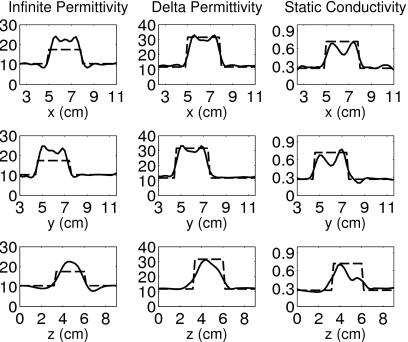
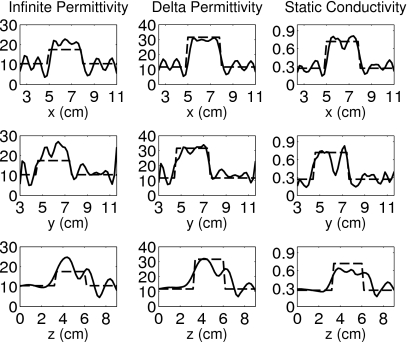
In addition to the four phantoms with realistic heterogeneous interiors, our testbeds include a simpler phantom with a single spherical inclusion in an otherwise homogeneous interior. This phantom is employed to validate the method and gain insight into the performance and limitations of the imaging system. The phantom is constructed by replacing the interior region of the Class 2 test phantom with a homogeneous medium having the mean properties of transitional tissue. Tissue is categorized as transitional when its dielectric properties fall between the 75th percentile for adipose tissue and the 25th percentile for fibroglandular tissue (see Table 1). A 3 cm diameter, homogeneous sphere having the 50th percentile properties of normal fibroglandular tissue is added to the interior of the phantom to provide a simple, high-contrast scattering target. Transections of this phantom are shown in Sec. 4 (see Figs. 67).
Figure 6.
Orthogonal transections of the inverse crime reconstruction of the simple phantom with spherical inclusion. The dashed line is the transection of the phantom and the solid line is the transection of the reconstruction. The transections are taken through the center of the true position of the inclusion x=6.6 cm, y=6.0 cm, and z=4.8 cm.
Figure 7.
Orthogonal transections of the reconstruction of the simple phantom with spherical inclusion. The dashed line is the transection of the phantom and the solid line is the transection of the reconstruction. The transections are taken through the center of the true position of the inclusion x=6.6 cm, y=6.0 cm, and z=4.8 cm.
Scattered-field data acquisition
Each test phantom is surrounded by a cylindrical array of 40 electrically short dipole antennas, as shown in Fig. 2. Each dipole arm is 6 mm long and the excitation gap is 2 mm. The cross-section of each antenna is 2×2 mm2. The antennas are evenly distributed on five elliptical rings of eight antennas each, with adjacent rings rotated by 22.5°. The dimensions of the array are customized to fit each test phantom. The five rings are evenly spaced between the posterior and anterior coronal planes of each phantom. The dimensions of the major and minor axes of the array’s elliptical cross-section are chosen such that the array conforms to the phantom with a minimum spacing of 1 cm between each antenna element and the skin surface.
We use the FDTD numerical method40 to simulate array measurements of the numerical breast phantoms. In each simulation, one antenna in the array is sourced by exciting the electric field in the gap between the dipole arms. The source function is a modulated Gaussian pulse having a 3 dB bandwidth from 0.87 to 3.75 GHz. The 3-D computational domain is composed of 0.5 mm cubic grid cells and is terminated with uniaxial perfectly matched layer boundary conditions for dispersive media.40 The antenna measurements are observations of the copolarized field component in the source gap. The time-domain scattered fields recorded at every antenna in the array are converted to phasors at the frequencies of interest by discrete Fourier transform. The four frequencies used in our reconstructions are 1.0, 1.5, 2.0, and 2.5 GHz.
In addition, we simulate measurements on the simple phantom and Class 2 phantom after down-sampling them to a uniform 2.0 mm grid. The down-sampled grid matches the resolution of the grid used by the imaging algorithm described in Sec. 3. Imaging the down-sampled phantoms allows us to remove, and thereby identify, the effects of modeling error on the imaging results. Acquiring simulated measurements in the same computational domain as is used by the inverse scattering algorithm is often referred to as an “inverse crime.”
The difference in resolution between the 0.5 mm data-acquisition grid and the 2.0 mm imaging grid leads to antenna modeling mismatch and simulation artifacts such as increased numerical dispersion. We reduce the mismatch error using a calibration step.21, 29 Array measurements are made in a homogeneous immersion medium in both the data acquisition and imaging domains. Ratios of the array-only phasor measurements through each transmit-receive channel are applied as complex correction factors to the acquired data. In this study, the calibration measurements of the data-acquisition grid and the imaging grid nominally agree within about 5%.
IMAGING METHOD
Multiple scattering interactions in a heterogeneous target region result in nonlinearity of the electromagnetic scattering. Thus, an iterative method of nonlinear optimization is used to estimate the dielectric profile based on the measured scattered fields. Each iteration of the algorithm consists of a set of electromagnetic simulations and an inversion of a linear approximation to a system of scattering equations. The unknown dielectric properties are estimated simultaneously at multiple frequencies using a parametric model of the complex permittivity over frequency. This section describes electromagnetic scattering from a heterogeneous dielectric target, the nonlinear optimization method used to image the dielectric profile, the details of the implementation, and a discussion of the key assumptions made in our solution.
Electromagnetic inverse scattering and the distorted Born iterative method
Electromagnetic inverse scattering methods operate on a set of field measurements of a penetrable, unknown target region V. A known source illuminates the region and the resulting field is measured at one or more observation points outside of V. An estimate of the unknown dielectric profile ε(r) in V is reconstructed based on a relationship between the fields scattered from the region and the dielectric profile within that region. For a measurement at location r at a given frequency ω, this relationship can be expressed by an integral equation41
| (2) |
where Es is the scattered electric field, Et is the total field, Ei is the incident field in the presence of the background permittivity εb(r), and is the dyadic Green’s function for the background. The profile of the dielectric contrast over V is formed by the difference between the dielectric profile of the unknown region ε(r) and the background profile εb(r).
A set of field measurements of a target space thus presents a system of equations of the form of Eq. 2 in which the unknown quantity of interest is the dielectric contrast ε(r)−εb(r). However, there are several well-known complications in obtaining a solution to the system. The number of unknowns in V is often much greater than the number of measurements, yielding an underdetermined system without a unique solution. The Green’s function may not be available analytically when the background is not a canonical region such a homogeneous space or a half space. Furthermore, the total field within V is unknown and is a function of ε(r), making the system nonlinear in the unknown contrast function.
We employ the distorted Born iterative method41 (DBIM) to obtain a solution to the nonlinear problem. At each iteration of the DBIM, the total field within the actual profile is approximated by the field in an estimated heterogeneous background profile. The fields within this background profile Eb replace Et in Eq. 2. The approach requires computation of the fields at the antennas and inside V for each iterate of the background profile. These field computations are collectively referred to as the forward solution. The DBIM is equivalent to a Gauss–Newton approach42 to nonlinear least-squares optimization problems.43 At each iteration, a system of scattering equations is constructed from the forward solution and the measurement data. The system is then inverted to find an approximate solution to the contrast between the current estimate of the background profile and the true phantom profile. This part of the algorithm determines the update to the background profile and will be referred to as the inverse solution. The DBIM algorithm alternates between forward and inverse solutions, updating the background profile εb(r) at each iteration until convergence is reached in the minimization of the residual scattering.
Forward solution
We use the FDTD method in the forward solution to obtain 3-D, full-wave field solutions for an estimated background profile. FDTD is a useful method for the simultaneous acquisition of multifrequency vector field data over the full bandwidth of interest. The sample spacing of the forward solution grid must be dense enough to limit numerical dispersion in the FDTD simulation, but sparse enough to limit the computational cost of the simulations. We select a uniform 2.0 mm sample spacing for the forward FDTD solutions to balance this trade-off. Since multiple FDTD simulations of the numerical phantoms are still computationally costly on a 2.0 mm grid, we run the simulations on a GPU-based hardware accelerator to achieve a feasible imaging time. Alternative numerical techniques for reducing the computation time of the forward solution have been presented elsewhere.44, 45, 46
An independent simulation is performed for each antenna in the array. The time-domain background field Eb is recorded at all other antennas and at every voxel within the reconstruction region, V. The measurements are then converted to the phasor domain by discrete Fourier transform. The background fields are the fields associated with the current estimate of the unknown profile which is used as the background profile at each iteration of the DBIM. Although the fields observed in the FDTD forward solution are total field quantities, we refer to them in the inverse scattering context as background fields to distinguish them from the unknown total field Et that existed in the actual profile during measurement.
As there are no analytical Green’s functions available for the heterogeneous background profiles estimated at each iteration of the DBIM, the Green’s functions must be computed. For a unit source at a given antenna feed point r in V, the Green’s function defines the field received at a particular antenna at rm. This quantity can be found using the principle of reciprocity47 and the background field measurements already obtained by the forward solution. A particular advantage of computing the Green’s function from the existing forward solution is that the exact radiative behavior of the antennas, including the mutual coupling, is built into the Green’s functions and therefore, no correction factors are necessary, with the exception of the calibration for antenna modeling error described in Sec. 2. The background Green’s functions can be calculated from the source current and the incident field measurements Ei based on a simple relationship.48 Here, only the z-directed tensor elements of the background Green’s functions are computed since the dipole antennas are z-polarized. For a z-directed source current Iz of length L at the mth transmitting antenna the effective Green’s function tensor is calculated at each r∊V as
| (3) |
The first two rows of the tensor are zeroed since no x-directed or y-directed sources are used. Equation 3 is used in the vector field formulation of the integral in Eq. 2. When the scalar field approximation22, 29, 49 is used, cross-polarization scattering effects are assumed to be negligible. Thus, and are set to zero in Eq. 3, reducing the Green’s function tensor to a single element. This approximation is employed to reduce the computational requirements of the inverse solution and reduce the memory required to store the forward solution. We note, however, that there is no scalar approximation employed in our full-wave 3-D FDTD computation of the forward solution itself; we use the approximation only in the construction of the inverse system.
Frequency-dependent model of unknown dielectric properties
The imaging algorithm seeks to estimate the complex permittivity profile of the unknown region over a set of discrete frequencies. Rather than reconstruct the profile independently at each frequency, it is advantageous to enforce an assumed frequency dependence of the tissue properties. This approach can reduce the number of degrees of freedom in the system, thereby restricting the size of the solution space and easing the computational burden of the imaging algorithm. In prior studies, a general dispersive formulation has been presented24 along with sample solutions using linear and logarithmic two-parameter dispersion relations. A single-pole Debye model of dielectric dispersion has also been employed.29
If the chosen model does not adequately capture the actual frequency dependence of the tissues, the model error will corrupt the resulting image. Except over narrowband ranges, an assumption of frequency independent dielectric properties is demonstrably inaccurate.2, 14, 39, 50 A linear dependence does not capture the dispersive effects at microwave frequencies due to the water content in biological tissues. Instead, dielectric models which include the relaxation behavior explicitly, such as the Debye and Cole–Cole relations, are naturally adept at capturing this frequency dependence.
We elect to use the single-pole Debye model as it employs one less parameter than the Cole–Cole model, it can be incorporated into FDTD in a straightforward manner, and it fits the dispersive behavior of breast tissues well over the frequency range of interest.51 Furthermore, the single-pole Debye model uses the same number of parameters as would be needed to model both permittivity and conductivity with first-order models of frequency dependence. We assume the relaxation time constant parameter τ to be invariant to reduce the number of unknowns and to keep the dispersion model linear with respect to the unknown parameters. The time constant is fixed in the inverse solution to the same value used by the data-acquisition simulations and the forward solution.
Linear system of scattering equations
The first-order Born approximation to Eq. 2 is linear in the unknown contrast function ε(r)−εb(r). We will denote the contrast function over r∊V more compactly as δ{ε(r)}. To achieve a simultaneous solution of the multiple-frequency system, the complex permittivity variables in Eq. 2 are replaced by the frequency-dependent Debye model of Eq. 1 with known time constant τ. The relationship between the field and the contrast function is then linear in the remaining three parameters of the Debye model: ε∞, Δε, and σs. The contrast functions of these three parameters δ{ε∞(r)}, δ{Δε(r)}, and δ{σs(r)} are the new unknowns over r∊V. Since these parameters are all real-valued, Eq. 2 is split into a pair of real and imaginary equations so that the solution space is limited to real values.
For an array of N antennas, there are N2F total frequency-domain measurements, where F is the number of discrete frequencies to be included in the solution. We discard redundant data from reciprocal channels to retain a single unique measurement for each transmit-receive antenna pair. We also discard monostatic data since these observations include the source field. Each of the remaining MF measurements, where M=N(N−1)∕2, yields a pair of real and imaginary vector equations.
The resulting set of 2MF equations is then discretized by a Riemann sum over the reconstruction region V. We assume knowledge of the location and properties of the skin region and restrict V to the interior breast volume. The region is discretized using the same uniform 2 mm voxel basis used in the forward solution. The set of K voxels within V is vectorized so that the unknown contrast function for each Debye parameter forms a K×1 vector. These three vectors are collected into a single 3K×1 vector x. For each equation, the remaining elements of the summand form a row of a 2MF×3K matrix A. The differences between the measured fields and the fields computed by the forward solution are collected into a vector of residual scattered fields b. The resulting linear system Ax=b is then structured as follows for each channel d between a transmitter at rm and a receiver at rn:
| (4) |
where the R{ } and I{ } operators denote the real and imaginary parts of the complex argument. In Eq. 4,
where , c∞(ω)=1, cΔ(ω)=(1+jωτ)−1, and cσ(ω)=(jωεo)−1.
Inverse solution
The linear model of the scattering system in Eq. 4 is ill-posed. It is also highly underdetermined on the selected voxel basis since 2MF⪡3K. Our inversion strategy uses a conjugate gradient method to find a regularized, approximate solution to the system of normal equations
| (5) |
Inexact Newton step
As previously noted, the DBIM is equivalent to a Gauss–Newton method of optimization. An approximation to the inverse of Eq. 5 is then an inexact Newton step used to update the estimate of the background profile εb(r) over r∊V. We use the conjugate gradient for least-squares (CGLS) algorithm to find an approximate inverse of Eq. 5. The CGLS minimizes the residual norm of the system ‖Ax−b‖2 over the Krylov subpace52 span{ATb,(ATA)ATb,…,(ATA)3K−1ATb}.
The CGLS algorithm eases the memory requirements of the inverse solution considerably. Since only two matrix-vector products of A need to be computed per iteration, the complete normal matrix ATA never needs to be constructed and stored in memory. However, the matrix A on the 2.0 mm voxel basis often cannot be accommodated in memory either, in which case the matrix-vector products must be computed in blocks, with each block of A having to be recomputed twice per CGLS iteration.
Regularization
In prior work,29 a Tikhonov regularization method was applied to a conjugate gradient inversion algorithm, using a series of trial solutions to determine the regularization parameter.53 This approach is reasonable for such reduced dimensionality approaches,29 but is far too computationally costly for large-scale linear systems.
We avoid the need for any trial solutions by executing the CGLS algorithm without applying any regularization term to Eq. 5 and terminating the algorithm prior to convergence.26 The early termination method takes advantage of the self-regularizing properties of the CGLS.53 This strategy is indispensable in light of the memory restrictions and resulting computational inefficiency faced by the CGLS algorithm.
Constraints
Unconstrained methods of optimization will operate over the full R3K solution space. However, at minimum, we know that any nonphysical solution (ε<εo and σ<0) is invalid. We can take further advantage of data on the bounds of breast tissue properties2, 14 and the observation that Δε>0 in biological tissues. Applying these simple bound constraints to reduce the span of the solution space can aid in the solution of an underdetermined, ill-posed system.
In addition, we observe that the parameters ε∞, Δε, and σs of the Debye models of breast tissues are roughly proportional in the sense that they are all at the low end of their range in adipose tissue and at the high end in fibroglandular tissue. We propose that bound constraints on these spatially correlated parameters can therefore be made interdependent. Specifically, we bound ε∞ by its full range (see Table 1) but restrict the bounds on Δε and σs based on the largest and smallest ratios between the values of these two parameters and those of ε∞ over the adipose and fibroglandular entries in Table 1. At each DBIM iteration, current estimates of ε∞ are multiplied by these ratios to obtain new bounds for Δε and σs at each voxel of V. The tightened bounds on Δε and σs are intended to promote the spatial correlation of the Debye parameters that would be expected of accurately reconstructed profiles.
Often, bound constraints are enforced after completion of the optimization algorithm by simply projecting the inverse solution onto the allowed solution space. This approach can undermine the optimality of the inverse solution in a nonsparse system where the elements of the solution have non-negligible interdependencies. A nonlinear transform to enforce the bounds within the contrast update has been proposed elsewhere.54 In this work, we accomplish the constraint within the optimization routine using a projected-restarted method.55 In this approach, the inverse solution is projected onto the allowed solution space after the initial CGLS algorithm terminates. The CGLS algorithm is then restarted using the projected solution as the initial guess. The new solution is then projected and CGLS algorithm is run again. The projecting and restarting is performed a predetermined number of times during each inverse solution and results in a bounded solution of improved optimality.
Termination
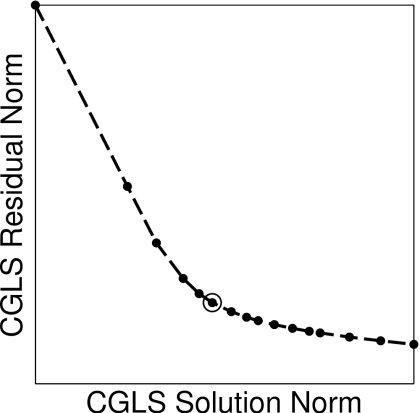
Terminating the CGLS algorithm too early over-regularizes the solution and reduces the spatial resolution. Terminating too late under-regularizes the solution and allows the magnification of noise errors to corrupt the solution. We use an L-curve method to determine an appropriate termination condition for the algorithm. For ill-posed systems, a plot of the solution norm ‖xj‖2 versus the residual norm ‖Axj−b‖2 over the CGLS iterations j=1,2,3… will depict an “L” shape as the step length of the contrast update begins to grow faster than the scattering residual is reduced. Our criterion for choosing a solution is the iteration at which the plot has maximum curvature. This selection achieves a reduction in the residual while preventing small singular values from erroneously growing the solution. The method is illustrated by a sample L-curve in Fig. 3. We observe that for our numerical phantoms this heuristic generally selects the fourth or fifth CGLS iteration at every DBIM iteration. We fix the projected-restarted constraint method to three restarts of the CGLS algorithm.
Figure 3.
At a sample DBIM iteration, the norm of the CGLS solution is plotted versus the norm of the CGLS residual at each iteration of the algorithm. The knee of the L-curve (indicated by the “○” marker) locates the iteration at which to terminate the CGLS algorithm.
Background update
The estimates of the contrast functions found by the inverse solution , , and are combined into an estimate of the complex permittivity contrast , according to Eq. 1. The contrast estimate is added to the K sample points of the ith background profile to create the new background for the next DBIM iteration
| (6) |
The next iteration commences with the forward solution of the new background profile.
Assumptions and initial conditions
Imaging performance is quite sensitive to the termination heuristics and regularization techniques employed by the optimization algorithm. Allowing the DBIM to run for too many iterations can allow noise and other errors to corrupt the image. Too few DBIM iterations restricts the ability of the method to overcome the nonlinearity of the problem. In this work, we determine convergence of the DBIM algorithm based on the norm of the residual scattering ‖b‖2, computed after each forward solution. This quantity is a measure of the similarity between the fields scattered by the test object and the fields scattered by the reconstructed object. We define convergence to be the ith iteration at which ‖bi−1‖2−‖bi‖2 is less than 1% of ‖b1‖2. The selection of this threshold is based on our observations of marginal improvement in image quality for additional iterations at the expense of increased influence of noise and model error.
The initial guess provided to the DBIM routine is also crucial to the imaging performance of the DBIM. While convergence behavior can be relatively insensitive to initial conditions, the fidelity of the reconstruction can be quite sensitive to the initial guess. A reasonable choice for a homogeneous initial guess is to use the dielectric values of the often predominant adipose tissue. An initial reconstruction step can also be used29, 56 to find an improved homogeneous initial guess or to find a coarse heterogeneous initial guess. In the contrast-source method back-propagation of received fields can be used to obtain an initial estimate of the incident fields in the reconstruction region.57 Such a profile of field magnitudes could be used to generate an initial profile of dielectric properties for the DBIM. In this work, we have made use of a priori knowledge of the true average dielectric properties of the interior of the test phantoms and use the volumetric average of the Debye parameter profiles as a homogeneous initial guess. The average Debye properties of each phantom are given in Table 2. Methods of estimating the average properties of the imaging volume have been reported.29, 58
Table 2.
Debye parameters (infinite and delta relative permittivity ε∞ and Δε, and static conductivity σs) of the homogeneous initial profile assumed by the DBIM algorithm for each realistic phantom.
| Phantoma | ε∞ | Δε | σs (S∕m) |
|---|---|---|---|
| Class 1 | 3.62 | 2.66 | 0.0586 |
| Class 2 | 3.97 | 3.12 | 0.0697 |
| Class 3 | 7.42 | 9.58 | 0.219 |
| Class 4 | 7.88 | 10.3 | 0.236 |
τ=15 ps for all tissues.
The scattering from the skin region and chest wall represent a primary source of interference in microwave breast imaging methods. There exist techniques for the cancellation of the skin response16 and for imposing known boundary conditions at the chest wall.59 Several approaches have been proposed for identifying the location and thickness of the skin layer.60, 61 The dielectric properties of the skin have been extensively documented39 and there is potential for direct measurement in a clinical setting via dielectric spectroscopy.62 These approaches to estimating the skin region may be superior to the inclusion of the skin region in the reconstruction region of an inverse scattering technique, since its thickness and distinct surfaces are poorly reconstructed by the frequencies typically used in microwave tomography. We therefore assume in this work that the skin surface, thickness, and properties are known a priori, are included in the background profile, and are unchanged at each iteration of the DBIM. Despite this assumption, there remains a substantial difference between the fields scattered from the 0.5 mm resolution skin region in the data-acquisition model and the down-sampled 2.0 mm resolution skin region of the forward solution models. This error arises from both the stair-stepping of the down-sampled skin region and the additional numerical dispersion of the larger FDTD grid cells.
RESULTS AND DISCUSSION
We apply the DBIM algorithm to the data acquired from the set of numerical breast phantoms described in Sec. 2. We empirically validate the imaging method using a piecewise homogeneous breast model with a single spherical inclusion. In addition, we investigate the imaging performance in realistic phantoms with respect to a number of important issues. Namely, we characterize the imaging artifacts arising from numerical and discretization errors in the forward model, examine the validity of the scalar field approximation, and evaluate the sensitivity of the imaging system to noise.
Each data set contains multistatic channel measurements from the 40-element array, excluding nonreciprocal and monostatic channels, at each of four frequencies (1.0, 1.5, 2.0, and 2.5 GHz). The frequency list is chosen to satisfy several trade-offs. The highest frequency is the primary design parameter in determining system resolution and must be balanced against the increase in the computation cost of the FDTD forward solution with frequency as well as the decrease in the stability of the inverse solution due to decreasing tissue penetration depth. Inclusion of lower frequencies help stabilize the inverse solution and increases the amount of scattering information at the expense of increasing the size of the linear system. In general, the selection of frequencies for practical imaging systems will be a function of considerations such as signal-to-noise ratio (SNR), immersion medium, array population and element size, and the conditioning of the inverse system.
Reconstructions of dielectric profiles are often presented as the complex permittivity at a particular frequency. Since we enforce the frequency dependence of the Debye model and solve for the contrast function parametrically, we elect to display the Debye parameters (ε∞, Δε, and σs) directly. The resulting images provide complete multiple-frequency information of the reconstruction. The diagnostic potential of dispersion profiles has previously been noted.24
Presenting 3-D images of complex, heterogeneous objects in 2-D cross-sections is a challenge, particularly when the reconstruction blurs detailed structures into adjacent 2-D layers. Simple and often-used 1-D transections of the reconstructions are even more limited in demonstrating the agreement between complicated 3-D profiles. Hence, we begin by imaging the simple case of a large, high-contrast, spherical scatterer placed within a homogeneous breast interior. The resulting reconstruction is presented in both 1-D and 2-D cuts to validate the imaging method. We then illustrate our 3-D reconstructions of realistic tissue distributions using three orthogonal 2-D cross-sections through the parametric reconstructions. These 2-D cross-sections are selected to bisect the extent of the breast phantom along the Cartesian axes in the coronal, sagittal, and axial planes.
We introduce two scalar metrics in support of quantitative comparisons between reconstructions. The first metric is an error measure based on the normalized root mean square. It is designed to represent the error relative to the actual profiles of all three Debye parameter estimates with a single metric. The proposed error metric is given as
| (7) |
where K, the total number of voxels in V, is the length of each parameter vector. The hat notation, e.g., , denotes an estimated quantity. The second metric is intended as measure of the qualitative similarity of two spatial profiles and is insensitive to the scaling of the profiles. The two 3-D profiles to be compared are vectorized and the metric is computed as the cosine of the angle between the vectors. Let ϕ be the angle between two Debye parameter profiles represented by vectors p1 and p2. Then the similarity measure is
| (8) |
When a reconstruction is referenced against an exact profile, the exact profile is obtained by down-sampling the phantom to the 2.0 mm grid so the dimensions of the phantom match the dimensions of the reconstruction. This case will be denoted by subscripted angle ϕe. The case of one reconstruction compared against another reconstruction will be denoted by subscripted angle ϕr. The similarity measure of Eq. 8 can be evaluated for a particular Debye parameter, e.g., p=Δε, or each of the parameter profiles can be vectorized and concatenated as to evaluate the similarity of the complete frequency-dependent complex permittivity profiles.
Simple phantom
The data used in the reconstruction of the simple phantom are noiseless and the DBIM algorithm employs the scalar field approximation. We reconstruct images from two data sets: The first is obtained from the phantom of 0.5 mm resolution and the second is obtained from the down-sampled phantom of 2.0 mm resolution. The latter is the inverse crime case, in which the forward model grid is identical to the data-acquisition grid.
The 3-D reconstructions of the 2.0 and 0.5 mm resolution cases are illustrated by the 2-D cross-sections of Figs. 45, and the similarity metrics with respect to the exact phantom are cos(ϕe)=0.995 and cos(ϕe)=0.967, respectively. Substantial imaging artifacts caused by the modeling error of the coarser resolution grid used in the forward solver are clearly observed in Fig. 5.
Figure 4.
3-D inverse crime reconstruction of the simple phantom with spherical inclusion, shown in coronal (x−y, top row), sagittal (y−z, middle row), and axial (x−z, bottom row) cross-sections of the reconstructed Debye parameters. [(a)–(c)] ε∞, [(d)–(f)] Δε, and [(g)–(i)] σs (S∕m). Axes in cm.
Figure 5.
3-D reconstruction of the simple phantom with spherical inclusion, shown in coronal (x−y, top row), sagittal (y−z, middle row), and axial (x−z, bottom row) cross-sections of the reconstructed Debye parameters. [(a)–(c)] ε∞, [(d)–(f)] Δε, and [(g)–(i)] σs (S∕m). Axes in cm.
Figures 67 show 1-D transections of the exact phantom and the corresponding reconstructions taken through the true center of the spherical inclusion. These plots confirm the accurate location and dimension of the reconstructed inclusion. The transections of Fig. 7 illustrate the reduced fidelity of the reconstruction caused by numerical and modeling mismatch, while those of Fig. 6 show the overestimation of the infinite permittivity ε∞, as well as some artifacts in the static conductivity σs, even when numerical and modeling errors are suppressed.
Realistic phantoms
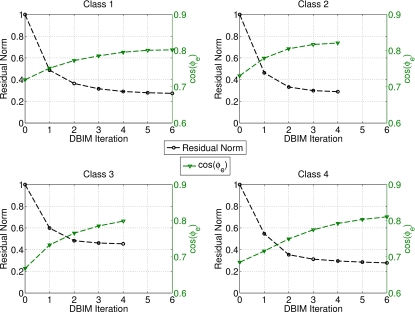
Noiseless data from the simulation of the four MRI-derived phantoms on the 0.5 mm resolution grid are used to reconstruct each of the phantoms using the DBIM algorithm with the scalar field approximation. The convergence of the norm of the residual scattering fields is shown in Fig. 8 for each phantom. The convergence condition described in Sec. 3F requires between four and six iterations, as shown the figure. In addition, Fig. 8 plots the similarity metric cos(ϕe) between the reconstructed and exact profiles versus DBIM iteration. This metric is seen to increase convergently as the residual scattering decreases. A positive slope of the cos(ϕe) curve at termination suggests that the reconstruction could be further improved with additional iterations.
Figure 8.
Convergence of the DBIM algorithm for the four heterogeneous phantoms. Left-hand y-axes: Normalized convergence of the residual scattering norm. Right-hand y-axes: Similarity metrics between the reconstruction at each iteration and the actual phantom profile. Here, the cos(ϕe) metric is computed for the concatenation of all three Debye parameters.
Visual agreement between the exact phantom profiles and the 3-D reconstructed profiles is evident in the cross-sectional images of Figs. 9101112. (Only Δε is presented in these figures since the three reconstructed Debye parameter profiles are noted to be highly correlated in each phantom, as in the simple phantom images of Figs. 45.) These results demonstrate the ability of the imaging method to accurately locate areas of dense tissue in all four phantoms.
There is a deficit of resolution available from the microwave illumination relative to the smallest dimensions of the fibroglandular features within the breast. The resolution is limited by the bandwidth of the data used in the imaging algorithm, effectively resulting in a spatially averaged reconstruction of the actual distribution. The images show that reconstructions of dense areas of tissue are smeared and that the smallest features of the tissue structures are not reconstructed. The resolution deficiency also contributes to the underestimation of the absolute dielectric properties observed in some areas of fibroglandular tissues. The abrupt transition between tissue types in the phantom profiles is reconstructed as a more gradual change in contrast, and this behavior tends to broaden and underestimate the reconstruction of the fine details of fibroglandular tissue structures. In addition, the cylindrical array geometry does not fully illuminate the anterior and posterior of the breast volume, further smearing the features of the reconstructed profile along the array axis. Finally, the effective resolution may also be limited by over-regularization of the inverse solution.
Other performance considerations
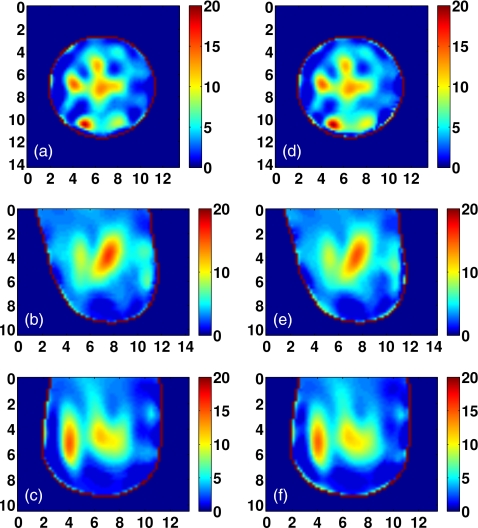
The effect of the forward model error on the realistic phantoms is investigated by reconstructing the inverse crime case using simulated measurements of the down-sampled Class 2 phantom. The reconstructed Δε profiles from the 0.5 and 2.0 mm phantoms are compared in Fig. 13. The similarity measure between the two reconstructions is cos(ϕr)=0.970. Artifacts in the Class 2 reconstruction due to modeling error are minimal in comparison to the artifacts in the case of the simple phantom (see Fig. 5). The severity of the artifacts in the simple phantom and the comparative absence of such artifacts in the Class 2 phantom suggest that our fixed-iteration CGLS termination heuristic may under-regularize the reconstruction in the case of the simple scattering target.
Figure 13.
Coronal, sagittal, and axial cross-sections of Class 2 phantom reconstructions: [(a)–(c)] Scalar field approximation and [(d)–(f)] inverse crime with scalar field approximation. Cross-sections are taken from the reconstructed profiles of Δε, and are shown in coronal (x−y, top row), sagittal (y−z, middle row), and axial (x−z, bottom row) cross-sections. Axes in cm.
The benefit of the bounding and constraint method described in Sec. 3 is evaluated by comparing the similarity metric for reconstructions with and without the constraints. The similarity measures in both cases are shown for each Debye parameter in Fig. 14. These results show that for each of the four realistic phantoms, the quality of the reconstruction is improved when the bounding and constraint techniques are employed. Figure 14 clearly indicates that the static conductivity profile is the least successfully reconstructed of the Debye parameters in this multifrequency solution. This observation helps explain the benefit of the bounding method, which restricts the range of values of σs based on the estimated profile of a better reconstructed parameter ε∞. Since the bounds on both Δε and σs are tightened considerably at each iteration based on ε∞, the projected-restarted constraint technique aids in the optimization of the inverse solutions within those bounds. The improvement in the σs profile is illustrated in Fig. 15 by comparing the constrained and unconstrained reconstructions of the Class 2 phantom.
Figure 14.
The similarity metric cos(ϕe) between the actual and reconstructed Debye parameter profiles of each of the four realistic phantoms. The metrics for the ε∞, Δε, and σs profiles are denoted by “ ×,” “△,” and “○,” respectively. The left-hand side markers for each phantom are the results for unbounded, unconstrained reconstructions. The right-hand side markers for each phantom, enclosed by “◻” markers, are the results for bounded, constrained reconstructions. Here, the cos(ϕe) metrics are the results for the individual vectorizations of each Debye parameter.
Figure 15.
Effect of bounding and constraint techniques on the reconstruction of static conductivity. Coronal cross-sections of static conductivity , in (S∕m), of the Class 2 reconstruction: (a) Exact profile, (b) constrained reconstruction, and (c) unconstrained reconstruction. Axes in cm.
The fidelity of the scalar field approximation in 3-D imaging is investigated by imaging the Class 2 phantom using the vector field formulation of Eq. 2. The contribution of the additional information available to the vector formulation is revealed by comparing the reconstructions of the vector and scalar formulations. The Δε profiles reconstructed in each case are shown in Fig. 16. There is little difference between the solutions obtained by the two formulations. The peak values of the dense areas of the reconstruction in the vector case are only a few percent higher than those in the scalar case. The similarity measure between the two reconstructions is cos(ϕr)=0.989, confirming the visual agreement.
Figure 16.
Coronal, sagittal, and axial cross-sections of Class 2 phantom reconstructions: [(a)–(c)] Scalar field approximation and [(d)–(f)] vector field formulation. Cross-sections are taken from the reconstructed profiles of Δε, and are shown in coronal (x−y, top row), sagittal (y−z, middle row), and axial (x−z, bottom row) cross-sections. Axes in cm.
Strictly speaking, we have not implemented a full vector formulation, since the polarization of the dipole antennas restricts the system to scalar sourcing and observation of z-directed fields. We also note that the scalar field approximation is referred to in this work in the context of the inverse solution. There is no need for the scalar approximation in the forward solution or simulated data acquisition, since 3-D FDTD is a full-wave numerical method. The scalar approximation is employed in this study due to insufficient memory resources for applying the method to the vector formulation of the large Class 1 phantom.
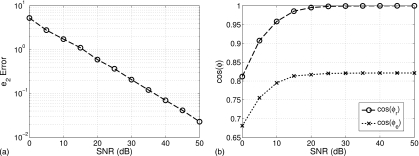
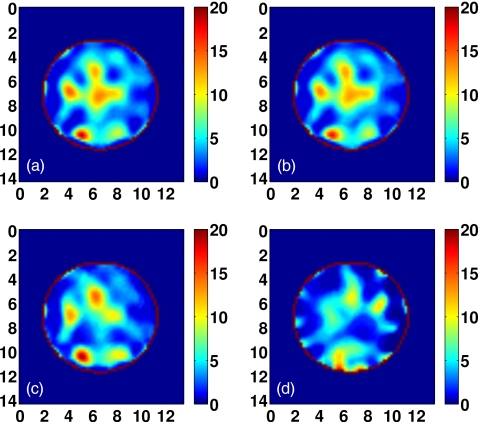
We evaluate imaging performance in the presence of noise by adding increasing levels of white Gaussian noise to the measurement data acquired from the Class 2 phantom. The profile reconstructed at each noise level is quantitatively compared to the profile reconstructed for the noiseless case. The error between the noiseless and noisy reconstructed profiles is plotted in Fig. 17 by the metrics e2, cos(ϕe), and cos(ϕr) versus SNR. Figure 17a depicts the classical log-log relationship between estimation error and additive white Gaussian noise. The slope of this line depends in part on the regularization and termination techniques used in the imaging algorithm. Representative cross-sections of the reconstructions over a range of SNR are shown in Fig. 18. Corruption of the images due to noise is apparent, as the accurately located areas of fibroglandular density in the noiseless reconstruction begin to shift and disappear at SNR levels below about 20 dB. The decay of the similarity metrics with decreasing SNR, shown in Fig. 17b, confirms this threshold. We note that the reference signal level of the SNR is defined here as the mean of the measured total fields at each frequency over all multistatic measurements of the phantom.
Figure 17.
Reconstruction error versus signal to noise ratio. (a) e2 error metric, referenced to noiseless reconstruction; (b) similarity metrics: cos(ϕe) and cos(ϕr) are referenced to exact profile and noiseless reconstruction, respectively (both are computed for the concatenation of all three Debye parameters).
Figure 18.
Comparison of coronal cross-sections of the Δε reconstruction of the Class 2 phantom for (a) noiseless data, (b) 20 dB SNR, (c) 10 dB SNR, and (d) 0 dB SNR. Axes in cm.
The forward solution is executed on a 128-core GPU using Acceleware’s FDTD library (Acceleware, Calgary, Alberta, Canada), while the inverse solution is executed on a four-core CPU using MATLAB code. The 40 antenna simulations of the forward solution are run in serial on the GPU, each taking about 30 s. The inverse solution requires about 5 min on a memory-limited system, for a total time per iteration of about 25 min. Parallelization of the forward simulations, implementation of the inverse solution on the GPU, and advances in GPU performance is expected to reduce the time per DBIM iteration by about a factor of 10.63
CONCLUSION
We have presented 3-D imaging results for microwave tomography of realistic numerical breast phantoms of varying fibroglandular tissue density. The inverse scattering method employs a constrained solution that is shown to be robust across the full range of ACR density classifications. The successful reconstruction of the fibroglandular tissue distributions suggest the utility of the method to density characterization and related risk assessments. As the ACR classifications are based on the percentage of fibroglandular tissue in a 2-D mammographic projection, 3-D density assessments may offer improved or complementary information. Microwave imaging thus has the potential to play a role in an individualized risk assessment which includes an estimate of cancer risk based on breast density characterization.
Our implementation of a 3-D microwave inverse scattering method also serves as a reference point for more computationally efficient techniques. The use of the scalar field approximation in the complex 3-D scattering environment is supported by the strong similarity of the imaging results to those of the full vector formulation. Solution of the inverse problem on a high resolution voxel basis provides a benchmark for methods that seek to exploit the lower resolution of the microwaves by using lower-dimensionality spatial bases to reduce computational cost. Our solution of the large-scale inverse problem is obtained by the use of an efficient regularization and constrained inversion technique.
Applying microwave inverse scattering techniques to data simulated from realistic numerical models offers valuable insight into the performance and challenges that can be expected in experimental laboratory and clinical investigations. Using simulated data allows for the selective treatment or idealization of practical issues whose effect on imaging performance is otherwise difficult to attribute. In this way we can analyze a complicated system in an incremental manner. Conversely, there are practical challenges which cannot be faithfully represented by a computational model and the associated simplifying assumptions. Though several practical issues are demanding of further study, the presented imaging results underscore the feasibility of microwave inverse scattering techniques in application to 3-D breast imaging.
Future work in system development and tumor detection is motivated by the performance of the microwave imaging system in reconstructing the dielectric properties and spatial profile of realistic distributions of normal breast tissue. The expectation of low contrast between malignant and normal glandular tissue increases the importance of spatial resolution and estimation accuracy to enable direct visual diagnosis from the morphology of an invasive malignant growth. The resolution of the images presented in this paper suggests that direct visual diagnosis is challenging without further resolution improvements, for example, by adding higher frequency data or by adopting edge-preserving regularization techniques. Alternatively, different approaches to microwave tumor detection, such as the use of differential imaging with exogenous contrast agents to enhance the relative contrast of malignant tissue,64, 65 may be considered.
ACKNOWLEDGMENTS
This work was supported by the National Institutes of Health under Grant No. R01 CA112398 awarded by the National Cancer Institute.
References
- Harvey J. A. and Bovbjerg V. E., “Quantitative assessment of mammographic breast density: Relationship with breast cancer risk,” Radiology 230, 29–41 (2004). 10.1148/radiol.2301020870 [DOI] [PubMed] [Google Scholar]
- Lazebnik M., McCartney L., Popovic D., Watkins C. B., Lindstrom M. J., Harter J., Sewall S., Magliocco A., Booske J. H., Okoniewski M., and Hagness S. C., “A large-scale study of the ultrawideband microwave dielectric properties of normal breast tissue obtained from reduction surgeries,” Phys. Med. Biol. 52, 2637–2656 (2007). 10.1088/0031-9155/52/10/001 [DOI] [PubMed] [Google Scholar]
- Kerlikowske K., Ichikawa L., Miglioretti D. L., Buist D. S. M., Vacek P. M., Smith-Bindman R., Yankaskas B., Carney P. A., and Ballard-Barbash R., “Longitudinal measurement of clinical mammographic breast density to improve estimation of breast cancer risk,” J. Natl. Cancer Inst. 99, 386–395 (2007). 10.1093/jnci/djk066 [DOI] [PubMed] [Google Scholar]
- Stomper P. C., D’Souza D. J., DiNitto P. A., and Arredondo M. A., “Analysis of parenchymal density on mammograms in 1353 women 25–79 years old,” AJR, Am. J. Roentgenol. 167, 1261–1265 (1996). [DOI] [PubMed] [Google Scholar]
- Boyd N. F., Guo H., Martin L. J., Sun L., Stone J., Fishell E., Jong R. A., Hislop G., Chiarelli A., Minkin S., and Yaffe M. J., “Mammographic density and the risk and detection of breast cancer,” N. Engl. J. Med. 356, 227–236 (2007). 10.1056/NEJMoa062790 [DOI] [PubMed] [Google Scholar]
- Colditz G. A., Willett W. A., Hunter D. J., Stampfer M. J., Manson J. E., Hennekens C. H., Rosner B. A., and Speizer F. E., “Family history, age, and risk of breast-cancer—Prospective data from the nurses health study,” JAMA, J. Am. Med. Assoc. 270, 338–343 (1993). 10.1001/jama.270.3.338 [DOI] [PubMed] [Google Scholar]
- D’Orsi C. J., Bassett L. W., and Berg W. A., Breast Imaging Reporting and Data System: ACR BI-RADS-Mammography, 4th ed. (American College of Radiology, Reston, 2003). [Google Scholar]
- Martin K. E., Helvie M. A., Zhou C., Roubidoux M. A., Bailey J. E., Paramagul C., Blane C. E., Klein K. A., Sonnad S. S., and Chan H., “Mammographic density measured with quantitative computer-aided method: Comparison with radiologists’ estimates and BI-RADS categories,” Radiology 240, 656–665 (2006). 10.1148/radiol.2402041947 [DOI] [PubMed] [Google Scholar]
- van Engeland S., Snoeren P. R., Huisman H., Boetes C., and Karssemeijer N., “Volumetric breast density estimation from full-field digital mammograms,” IEEE Trans. Med. Imaging 25, 273–282 (2006). 10.1109/TMI.2005.862741 [DOI] [PubMed] [Google Scholar]
- Glide-Hurst C. K., Duric N., and Littrup P., “A new method for quantitative analysis of mammographic density,” Med. Phys. 34, 4491–4498 (2007). 10.1118/1.2789407 [DOI] [PubMed] [Google Scholar]
- Nie K., Chen J., Chan S., Chau M. I., Yu H. J., Bahri S., Tseng T., Nalcioglu O., and Su M., “Development of a quantitative method for analysis of breast density based on three-dimensional breast MRI,” Med. Phys. 35, 5253–5262 (2008). 10.1118/1.3002306 [DOI] [PMC free article] [PubMed] [Google Scholar]
- Berg W. A., Blume J. D., Adams A. M., Jong R. A., Barr R. G., Lehrer D. E., Pisano E. D., Evans W. P., Mahoney M. C., Hovanessian Larsen L., Gabrielli G. J., and Mendelson E. B., “Reasons women at elevated risk of breast cancer refuse breast MR imaging screening: ACRIN 66661,” Radiology 254, 79–87 (2010). 10.1148/radiol.2541090953 [DOI] [PMC free article] [PubMed] [Google Scholar]
- Zastrow E., Davis S. K., Lazebnik M., Kelcz F., Van Veen B. D., and Hagness S. C., “Development of anatomically realistic numerical breast phantoms with accurate dielectric properties for modeling microwave interactions with the human breast,” IEEE Trans. Biomed. Eng. 55, 2792–2800 (2008). 10.1109/TBME.2008.2002130 [DOI] [PMC free article] [PubMed] [Google Scholar]
- Lazebnik M., Popovic D., McCartney L., Watkins C. B., Lindstrom M. J., Harter J., Sewall S., Ogilvie T., Magliocco A., Breslin T. M., Temple W., Mew D., Booske J. H., Okoniewski M., and Hagness S. C., “A large-scale study of the ultrawideband microwave dielectric properties of normal, benign, and malignant breast tissues obtained from cancer surgeries,” Phys. Med. Biol. 52, 6093–6115 (2007). 10.1088/0031-9155/52/20/002 [DOI] [PubMed] [Google Scholar]
- Fear E. C., Li X., Hagness S. C., and Stuchly M. A., “Confocal microwave imaging for breast cancer detection: Localization of tumors in three dimensions,” IEEE Trans. Biomed. Eng. 49, 812–822 (2002). 10.1109/TBME.2002.800759 [DOI] [PubMed] [Google Scholar]
- Bond E. J., Hagness S. C., and Van Veen B. D., “Microwave imaging via space-time beam forming for early detection of breast cancer,” IEEE Trans. Antennas Propag. 51, 1690–1705 (2003). 10.1109/TAP.2003.815446 [DOI] [Google Scholar]
- Li X., Davis S. K., Hagness S. C., van der Weide D., and Van Veen B. D., “Microwave imaging via space-time beam forming: Experimental investigation of tumor detection in multi-layer breast phantoms,” IEEE Trans. Microwave Theory Tech. 52, 1856–1865 (2004). 10.1109/TMTT.2004.832686 [DOI] [Google Scholar]
- Sill J. M. and Fear E. C., “Tissue sensing adaptive radar for breast cancer detection—Experimental investigation of simple tumor models,” IEEE Trans. Microwave Theory Tech. 53, 3312–3319 (2005). 10.1109/TMTT.2005.857330 [DOI] [Google Scholar]
- Klemm M., Craddock I., Leendertz J., Preece A., and Benjamin R., “Experimental and clinical results of breast cancer detection using UWB microwave radar,” in Proceedings of the IEEE International Symposium on Antennas and Propagation, 2008.
- Kosmas P. and Rappaport C., “A matched filter FDTD-based time reversal algorithm for microwave breast cancer detection,” IEEE Trans. Antennas Propag. 54, 1257–1264 (2006). 10.1109/TAP.2006.872670 [DOI] [Google Scholar]
- Meaney P. M., Fanning M. W., Li D., Poplack S. P., and Paulsen K. D., “A clinical prototype for active microwave imaging of the breast,” IEEE Trans. Microwave Theory Tech. 48, 1841–1853 (2000). 10.1109/22.883861 [DOI] [Google Scholar]
- Bulyshev A. E., Semenov S. Y., Souvorov A. E., Svenson R. H., Nazarov A. G., Sizov Y. E., and Tatsis G. P., “Computational modeling of three-dimensional microwave tomography of breast cancer,” IEEE Trans. Biomed. Eng. 48, 1053–1056 (2001). 10.1109/10.942596 [DOI] [PubMed] [Google Scholar]
- Zhang Z. Q. and Liu Q. H., “Three-dimensional nonlinear image reconstruction for microwave biomedical imaging,” IEEE Trans. Biomed. Eng. 51, 544–548 (2004). 10.1109/TBME.2003.821052 [DOI] [PubMed] [Google Scholar]
- Fang Q., Meaney P. M., and Paulsen K. D., “Microwave image reconstruction of tissue property dispersion characteristics utilizing multiple-frequency information,” IEEE Trans. Microwave Theory Tech. 52, 1866–1875 (2004). 10.1109/TMTT.2004.832014 [DOI] [Google Scholar]
- Fang Q., Meaney P. M., Geimer S. D., Streltsov A. V., and Paulsen K. D., “Microwave image reconstruction from 3-D field coupled to 2-D parameter estimation,” IEEE Trans. Med. Imaging 23, 475–484 (2004). 10.1109/TMI.2004.824152 [DOI] [PubMed] [Google Scholar]
- Rubæk T., Meaney P. M., Meincke P., and Paulsen K. D., “Nonlinear microwave imaging for breast-cancer screening using Gauss-Newton’s method and the CGLS inversion algorithm,” IEEE Trans. Antennas Propag. 55, 2320–2331 (2007). 10.1109/TAP.2007.901993 [DOI] [Google Scholar]
- Johnson J. E., Takenaka T., and Tanaka T., “Two-dimensional time-domain inverse scattering for quantitative analysis of breast composition,” IEEE Trans. Biomed. Eng. 55, 1941–1945 (2008). 10.1109/TBME.2007.899364 [DOI] [PubMed] [Google Scholar]
- Rubæk T., Kim O. S., and Meincke P., “Computational validation of a 3-D microwave imaging system for breast-cancer screening,” IEEE Trans. Antennas Propag. 57, 2105–2115 (2009). 10.1109/TAP.2009.2021879 [DOI] [Google Scholar]
- Winters D. W., Shea J. D., Kosmas P., Van Veen B. D., and Hagness S. C., “Three-dimensional microwave breast imaging: Dispersive dielectric properties estimation using patient-specific basis functions,” IEEE Trans. Med. Imaging 28, 969–981 (2009). 10.1109/TMI.2008.2008959 [DOI] [PMC free article] [PubMed] [Google Scholar]
- Meaney P. M., Fanning M. W., Raynolds T., Fox C. J., Fang Q. Q., Kogel C. A., Poplack S. P., and Paulsen K. D., “Initial clinical experience with microwave breast imaging in women with normal mammography,” Acad. Radiol. 14, 207–218 (2007). 10.1016/j.acra.2006.10.016 [DOI] [PMC free article] [PubMed] [Google Scholar]
- Poplack S. P., Tosteson T. D., Wells W. A., Pogue B. W., Meaney P. M., Hartov A., Kogel C. A., Soho S. K., Gibson J. J., and Paulsen K. D., “Electromagnetic breast imaging: Results of a pilot study in women with abnormal mammograms,” Radiology 243, 350–359 (2007). 10.1148/radiol.2432060286 [DOI] [PubMed] [Google Scholar]
- Lazebnik M., Madsen E. L., Frank G. R., and Hagness S. C., “Tissue-mimicking phantom materials for narrowband and ultrawideband microwave applications,” Phys. Med. Biol. 50, 4245–4258 (2005). 10.1088/0031-9155/50/18/001 [DOI] [PubMed] [Google Scholar]
- Abubakar A., van den Berg P. M., and Mallorqui J. J., “Imaging of biomedical data using a multiplicative regularized contrast source inversion method,” IEEE Trans. Microwave Theory Tech. 50, 1761–1771 (2002). 10.1109/TMTT.2002.800427 [DOI] [Google Scholar]
- Semenov S. Y., Svenson R. H., Bulyshev A. E., Souvorov A. E., Nazarov A. G., Sizov Y. E., Pavlovsky A. V., Borisov V. Y., Voinov B. A., Simonova G. I., Starostin A. N., Posukh V. G., Tatsis G. P., and Baranov V. Y., “Three-dimensional microwave tomography: Experimental prototype of the system and vector Born reconstruction method,” IEEE Trans. Biomed. Eng. 46, 937–946 (1999). 10.1109/10.775403 [DOI] [PubMed] [Google Scholar]
- Li D., Meaney P. M., and Paulsen K. D., “Conformal microwave imaging for breast cancer detection,” IEEE Trans. Microwave Theory Tech. 51, 1179–1186 (2003). 10.1109/TMTT.2003.809624 [DOI] [Google Scholar]
- Gilmore C., Abubakar A., Hu W., Habashy T. M., and van den Berg P. M., “Microwave biomedical data inversion using the finite-difference contrast source inversion method,” IEEE Trans. Antennas Propag. 57, 1528–1538 (2009). 10.1109/TAP.2009.2016728 [DOI] [Google Scholar]
- Mojabi P. and LoVetri J., “Microwave biomedical imaging using the multiplicative regularized Gauss-Newton inversion,” IEEE Antennas Wireless Propag. Lett. 8, 645–648 (2009). 10.1109/LAWP.2009.2023602 [DOI] [Google Scholar]
- UWCEM numerical breast phantom repository, http://uwcem.ece.wisc.edu.
- Gabriel S., Lau R. W., and Gabriel C., “The dielectric properties of biological tissues: III. Parametric models for the dielectric spectrum of tissues,” Phys. Med. Biol. 41, 2271–2293 (1996). 10.1088/0031-9155/41/11/003 [DOI] [PubMed] [Google Scholar]
- Taflove A. and Hagness S. C., Computational Electrodynamics: The Finite-Difference Time-Domain Method, 3rd ed. (Artech House, Norwood, 2005). [Google Scholar]
- Chew W. C., Waves and Fields in Inhomogeneous Media (IEEE, Piscataway, 1995). [Google Scholar]
- Remis R. F. and van den Berg P. M., “On the equivalence of the Newton-Kantorovich and distorted Born methods,” Inverse Probl. 16, L1–L4 (2000). 10.1088/0266-5611/16/1/101 [DOI] [Google Scholar]
- Nocedal J. and Wright S. J., Nonlinear Optimization, 2nd ed. (Springer, New York, 2006). [Google Scholar]
- Meaney P. M., Paulsen K. D., and Ryan T. P., “Two-dimensional hybrid element image reconstruction for TM illumination,” IEEE Trans. Antennas Propag. 43, 239–247 (1995). 10.1109/8.371992 [DOI] [Google Scholar]
- Zhang Z. Q., Liu Q. H., Xiao C., Ward E., Ybarra G., and Joines W. T., “Microwave breast imaging: 3-D forward scattering simulation,” IEEE Trans. Biomed. Eng. 50, 1180–1189 (2003). 10.1109/TBME.2003.817634 [DOI] [PubMed] [Google Scholar]
- Bulyshev A. E., Souvorov A. E., Semenov S. Y., Posukh V. G., and Sizov Y. E., “Three-dimensional vector microwave tomography: Theory and computational experiments,” Inverse Probl. 20, 1239–1259 (2004). 10.1088/0266-5611/20/4/013 [DOI] [Google Scholar]
- Cui T. J., Chew W. C., Aydiner A. A., and Chen S., “Inverse scattering of two-dimensional dielectric objects buried in a lossy earth using the distorted Born iterative method,” IEEE Trans. Geosci. Remote Sens. 39, 339–346 (2001). 10.1109/36.905242 [DOI] [Google Scholar]
- Cui T. J., Qin Y., Wang G., and Chew W. C., “Low-frequency detection of two-dimensional buried objects using high-order extended born approximations,” Inverse Probl. 20, S41–S62 (2004). 10.1088/0266-5611/20/6/S04 [DOI] [Google Scholar]
- Bulyshev A. E., Souvorov A. E., Semenov S. Y., Svenson R. H., Nazarov A. G., Sizov Y. E., and Tatsis G. P., “Three-dimensional microwave tomography. theory and computer experiments in scalar approximation,” Inverse Probl. 16, 863–875 (2000). 10.1088/0266-5611/16/3/319 [DOI] [Google Scholar]
- Lazebnik M., Converse M. C., Booske J. H., and Hagness S. C., “Ultrawideband temperature-dependent dielectric properties of animal liver tissue in the microwave frequency range,” Phys. Med. Biol. 51, 1941–1955 (2006). 10.1088/0031-9155/51/7/022 [DOI] [PubMed] [Google Scholar]
- Lazebnik M., Okoniewski M., Booske J. H., and Hagness S. C., “Highly accurate Debye models for normal and malignant breast tissue dielectric properties at microwave frequencies,” IEEE Microw. Wirel. Compon. Lett. 17, 822–824 (2007). 10.1109/LMWC.2007.910465 [DOI] [Google Scholar]
- Saad Y., Iterative Methods for Sparse Linear Systems, 2nd ed. (SIAM, Philadelphia, 2003). [Google Scholar]
- Hansen P. C., Rank-Deficient and Discrete Ill-Posed Problems: Numerical Aspects of Linear Inversion (SIAM, Philadelphia, 1998). [Google Scholar]
- Abubakar A., Habashy T. M., Druskin V. L., Knizhnerman L., and Alumbaugh D., “2.5D forward and inverse modeling for interpreting low-frequency electromagnetic measurements,” Geophysics 73, F165–F177 (2008). 10.1190/1.2937466 [DOI] [Google Scholar]
- Calvetti D., Landi G., Reichel L., and Sgallari F., “Non-negativity and iterative methods for ill-posed problems,” Inverse Probl. 20, 1747–1758 (2004). 10.1088/0266-5611/20/6/003 [DOI] [Google Scholar]
- Meaney P. M., Demidenko E., Yagnamurthy N. K., Li D., Fanning M. W., and Paulsen K. D., “A two-stage microwave image reconstruction procedure for improved internal feature extraction,” Med. Phys. 28, 2358–2369 (2001). 10.1118/1.1413520 [DOI] [PubMed] [Google Scholar]
- Abubakar A., Hu W., van den Berg P. M., and Habashy T. M., “A finite-difference contrast source inversion method,” Inverse Probl. 24, 065004 (2008). 10.1088/0266-5611/24/6/065004 [DOI] [Google Scholar]
- Winters D. W., Bond E. J., Van Veen B. D., and Hagness S. C., “Estimation of the frequency-dependent average dielectric properties of breast tissue using a time-domain inverse scattering technique,” IEEE Trans. Antennas Propag. 54, 3517–3528 (2006). 10.1109/TAP.2006.884296 [DOI] [Google Scholar]
- Rubæk T. and Zhurbenko V., “Prototype of microwave imaging system for breast-cancer screening,” in Proceedings of the 13th International Symposium on Antenna Technology and Applied Electromagnetics and the Canadian Radio Sciences Meeting, Banff, Alberta, Canada, 2009.
- Winters D. W., Shea J. D., Madsen E. L., Frank G. R., Van Veen B. D., and Hagness S. C., “Estimating the breast surface using UWB microwave monostatic backscatter measurements,” IEEE Trans. Biomed. Eng. 55, 247–256 (2008). 10.1109/TBME.2007.901028 [DOI] [PubMed] [Google Scholar]
- Williams T. C., Sill J. M., and Fear E. C., “Breast surface estimation for radar-based breast imaging systems,” IEEE Trans. Biomed. Eng. 55, 1678–1686 (2008). 10.1109/TBME.2008.919883 [DOI] [PubMed] [Google Scholar]
- Popovic D., McCartney L., Beasley C., Lazebnik M., Okoniewski M., Hagness S. C., and Booske J. H., “Precision open-ended coaxial probes for in vivo and ex vivo dielectric spectroscopy of biological tissues at microwave frequencies,” IEEE Trans. Microwave Theory Tech. 53, 1713–1722 (2005). 10.1109/TMTT.2005.847111 [DOI] [Google Scholar]
- Shea J. D., Hagness S. C., and Van Veen B. D., “Hardware acceleration of FDTD computations for 3-D microwave breast tomography,” in Proceedings of the IEEE International Symposium on Antennas and Propagation, Charleston, SC, 2009.
- Shea J. D., Kosmas P., Hagness S. C., and Van Veen B. D., “Contrast-enhanced microwave breast imaging,” in Proceedings of the 13th International Symposium on Antenna Technology and Applied Electromagnetics and the Canadian Radio Sciences Meeting, Banff, Alberta, Canada, 2009.
- Shea J. D., Kosmas P., Van Veen B. D., and Hagness S. C., “Contrast-enhanced microwave imaging of breast tumors: A computational study using 3D realistic numerical phantoms,” Inverse Probl. (in press). [DOI] [PMC free article] [PubMed]


