Abstract
The crawling wave experiment, in which two harmonic sources oscillate at different but nearby frequencies, is a development in sonoelastography that allows real-time imaging of propagating shear wave interference patterns. Previously the crawling wave speed was recovered and used as an indicator of shear stiffness; however, it is shown in this paper that the crawling wave speed image can have artifacts that do not represent a change in stiffness. In this paper, the locations and shapes of some of the artifacts are exhibited. In addition, a differential equation is established that enables imaging of the shear wave speed, which is a quantity strongly correlated with shear stiffness change. The full algorithm is as follows: (1) extract the crawling wave phase from the spectral variance data; (2) calculate the crawling wave phase wave speed; (3) solve a first-order PDE for the phase of the wave emanating from one of the sources; and (4) compute and image the shear wave speed on a grid in the image plane.
INTRODUCTION
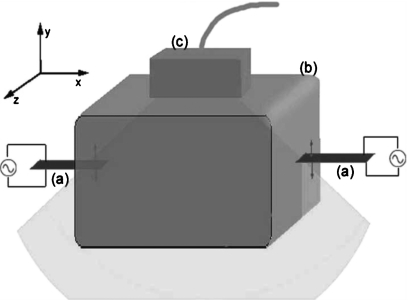
Shear stiffness imaging in tissue is a fast-moving research area inspired by the doctor’s palpation exam. Stiff regions indicate an abnormality. Experiments that are devised to create displacement that will yield tissue mechanical properties include: (1) tissue is compressed; stiff tissue compresses less; the displacement is measured using ultrasound or MR; the Lamé parameter, μ, is imaged, (Oberai et al., 2004; Barbone and Bamber, 2002; Konofagou et al., 2000; Thitaikumar and Ophir, 2007); (2) a time harmonic excitation is applied; the maximum displacement at each point in the image plane is measured using ultrasound and the displacement is imaged (Gao et al., 1995; Taylor et al., 2000; Wu et al., 2002); or the displacement, using MR, is measured at 4 to 8 equally spaced times in a period cycle, the shear wave speed or the Lamé parameter, μ, is imaged (Greenleaf et al., 1996; Kruse et al., 2000; Braun et al., 2001; Manduca et al., 2001, 2002, 2003; Ehman et al., 2006; Sinkus et al., 2007); (3) a traveling wave is created using: (a) a line source created by a sequence of interior radiation force pushes (Bercoff et al., 2002, 2004), and a primarily shear wave, with a front, travels outward from the source; the speed of the wave front is imaged (McLaughlin and Renzi, 2006a, 2006b; Tanter et al., 2008); a point source is created by an interior radiation force push and the local shear wave speed is determined by measuring the time to peak at a nearby location (Nightingale et al., 2001a, 2001b; Fahey et al., 2005; Palmeri et al., 2006); or (b) two harmonic sources that oscillate at different but nearly the same frequency; the traveling wave speed is imaged (Castaneda et al., 2009; Hoyt et al., 2006, 2007a, 2007b, 2007c, 2008a, 2008b; McLaughlin et al., 2007; Wu et al., 2004, 2006; Zhang et al., 2007, 2008). This latter experiment, termed the crawling wave experiment, provides the data for the shear wave imaging presented in this paper. Figure 1 shows a diagram of the experimental setup.
Figure 1.
Setup of the crawling wave experiment: (a) shear vibration sources, (b) biomaterial, and (c) ultrasound probe. The light gray area is the image plane.
In the crawling wave experiment, two sources with different but nearly the same harmonic excitations induce a moving interference pattern in the spectral variance imaged by a Doppler ultrasound machine, e.g., the GE Logiq 9. This moving interference pattern is termed a crawling wave (Wu et al., 2002, 2004, 2006), and the phase wave speed of this crawling wave is related to the shear wave speed of the tissue between the two sources. The phase of the crawling wave can be determined from the spectral variance and then, using, e.g., the Arrival Time algorithm (McLaughlin and Renzi, 2006a, 2006b), the crawling wave phase wave speed can be imaged; see e.g., McLaughlin et al. (2007). In phantoms, e.g., those utilized in McLaughlin et al. (2007); Hoyt et al. (2006, 2007a, 2007c, 2008a); Wu et al. (2004, 2006); Zhang et al. (2007), the crawling wave phase wave speed can be a good indicator of shear wave speed changes.
At the same time, it is possible for the inclusion to be positioned so that there are high-speed artifacts in a crawling wave phase wave speed image. These artifacts can distort the position of the inclusion and also suggest that the inclusion has a higher shear wave speed than is actually the case. This is particularly true when the harmonic sources are point sources, which is one of the cases targeted in this paper. It is less of a problem when the sources are line sources.
In this paper, we develop a new algorithm to recover the shear wave speed without such artifacts, and we test the algorithm on synthetic data. A major contribution is a derivation of a linear partial differential equation that enables calculation of the shear wave phase from both the crawling wave phase and the crawling wave phase wave speed.
MATHEMATICAL MODEL
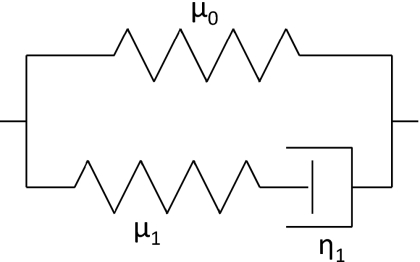
Tissue is viscoelastic. While in previous work (McLaughlin et al., 2007) we assumed that small displacements of propagating waves induced by the crawling wave experiment in tissues were governed by the equations of linear elasticity, here we choose a viscoelastic model. We have chosen the Standard Linear Solid Model (Zener Model) (Fung and Tong, 2001). This model can have several Maxwell elements in parallel. Here we have one Maxwell element in parallel with a spring element, as this model has been shown to match experimental data (Klatt et al., 2007). A diagram of our model is shown in Fig. 2.
Figure 2.
Standard linear solid model with spring (top) and Maxwell element (bottom) in parallel.
With the viscoelastic effect included only for the deviatoric part of the stress-strain relationship, the equations for this Linear Solid Model become
| (1) |
where τ1=η1∕μ1 is the relaxation time for the Maxwell element. We will denote the sum of the spring elements as μ=μ0+μ1.
We choose to include the viscoelastic effect for only the deviatoric part because our calculations with this model show good agreement with experimental data.
EQUATIONS FOR THE PHASE
Let ϕ1 be the spatially-dependent phase of the solution u1 due to the excitation from a source on the left side of the medium oscillating at a frequency ω1. Similarly, let −ϕ2 be the spatially-dependent phase of the solution u2 due to the excitation from a source on the right side of the medium oscillating at a frequency ω2. The Eikonal equations for ϕ1 and ϕ2 are derived as follows.
First, assume the geometric optics approximation (Ji et al., 2003) for u1:
where
is the asymptotic expansion of A. Substitute this expansion into the Linear Solid Model, Eq. 1 and write all terms of Eq. 1 in powers of ω1. Assuming there is enough separation of scales, the coefficient of each power of ω1 is separately set equal to zero. Here we consider only the coefficient of the term which has the highest power of ω1. Setting this coefficient equal to zero yields
| (2) |
where
This is the same form as in Ji and McLaughlin (2004), except here, consistent with the high-frequency approximation of geometric optics, μ=μ0+μ1. This also holds if we use several Maxwell elements in the viscoelastic model; in that case, . In order for Eq. 2 to have a nontrivial solution A0, the matrix M must be singular. Therefore, we set det M=0, which implies that either
| (3) |
where cs is the high-frequency limit of the shear wave speed, or
where cp is the high-frequency limit of the compression wave speed. The experiment is designed so that the amplitude of the compression wave is small [see p. 2440, McLaughlin et al. (2007)], so we assume that the Eikonal equation in Eq. 3 holds.
Similarly, assuming
yields the same Eikonal equation, satisfied by ϕ2; i.e.,
| (4) |
In the experiment, the Doppler spectral variance |u|2 is imaged for the downward component u of u=u1+u2, which is the sum of the two shear waves propagating in opposite directions from the two sources. Under the geometric optics assumption, from the spectral variance, we obtain the phase ψ of the crawling wave (McLaughlin et al., 2007):
| (5) |
where
| (6) |
is the spatially-dependent component of the phase, and Δω=ω1−ω2.
It is important to note that the geometric optics assumption is a far-field assumption, and we are actually in the near field. Also, this assumption models forward scattering. Therefore, we may have some artifacts due to backscattering that result from using the geometric optics assumption. We comment on artifacts due to backscattering in Section 8.
RELATIONSHIP BETWEEN THE CRAWLING WAVE SPEED AND THE SHEAR WAVE SPEED
Taking the time-derivative of Eq. 5, we obtain
The term in parenthesis is the time derivative of the phase in the direction normal to lines of constant phase . Thus the phase wave speed of the crawling wave phase satisfies the Eikonal equation
| (7) |
Here we assume ω1>ω2. See also Osher and Sethian (1988); Sethian (1999); Osher and Fedkiw (2002).
We can derive a relationship between the shear wave speed, cs, and the crawling wave speed, , from Eqs. 3, 4, 7 as follows:
where cos θ=(∇ϕ1⋅∇ϕ2)∕(|∇ϕ1|⋅|∇ϕ2|). Then, with an error of order Δω∕ω1, the relationship between cs and is expressed as
| (8) |
We can see in Eq. 8 that the shear wave speed is almost a constant scaled factor of the crawling wave speed. If the two shear waves are propagating directly toward each other, and their lines of constant phase are parallel, then θ=0 and |cos(θ∕2)|=1, and the shear wave speed is exactly a scaled factor times the crawling wave speed. If we assume this estimate holds and estimate cs by the linear relationship, we obtain
We call this estimate the scaled crawling wave speed. This is the imaging functional F in the preceding paper, McLaughlin et al. (2007).
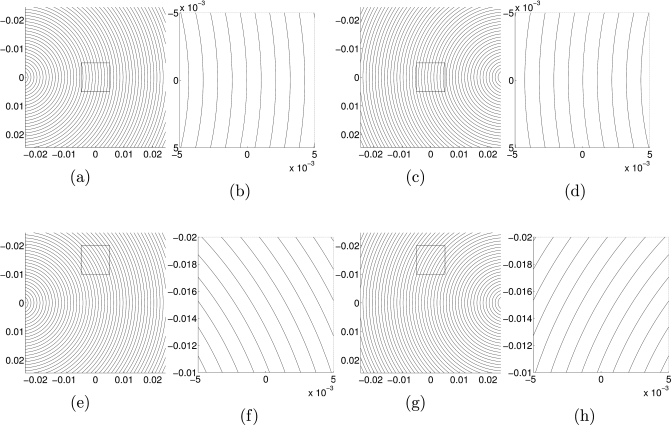
The lines of constant phase of one source may not be parallel to the lines of constant phase associated with the second source. We explain this further. First, consider a single shear wave propagating from a point source in a homogeneous medium. The wave begins by propagating away from the source in all directions at the same speed. Thus the only place where the wave would be propagating straight across the medium would be at points that lie on the horizontal line going through the point source. Now consider two shear waves in a homogeneous medium. At points that lie on the horizontal line between the two point sources, the two waves propagate in exactly opposite directions, so |cos(θ∕2)|=1. However, at any point above or below that line, neither wave is propagating directly across the medium, and so the two waves are not propagating in exactly opposite directions. See Fig. 3 for wavefront images in a constant medium.
Figure 3.
Wavefronts in a homogeneous medium. (a) and (e): wavefronts due to a single point source at (−0.025,0). (b) and (f): closeups of the regions outlined in (a) and (e). (c) and (g): wavefronts due to a single point source at (0.025,0). (d) and (h): closeups of the regions outlined in (c) and (g).
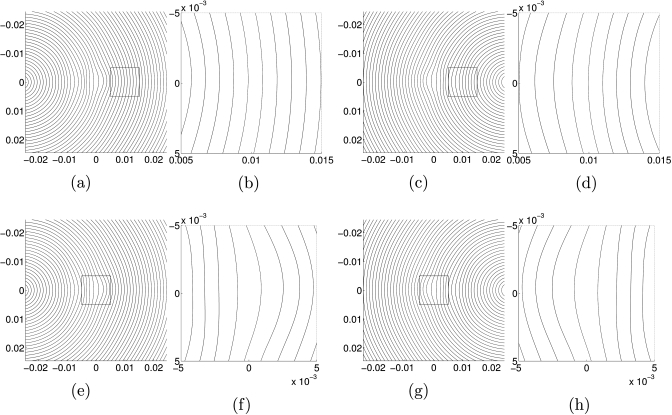
Second, consider just one shear wave in an inhomogeneous medium with an inclusion on the horizontal line through the point source. The shear wave propagates in a horizontal direction on that line, and nearly horizontal direction in a neighborhood about that line. When the wave reaches the inclusion, it travels faster through it than it does through the areas above and below the inclusion. Thus, after the wave has passed through the inclusion, the shape of the wavefront has changed. Before the inclusion, the front was nearly vertical in a neighborhood of the horizontal line from the source, whereas after the wave reaches the inclusion, the wave front is much more rounded. Therefore, the area in which the wave is propagating approximately straight across the medium is much smaller. When we have two shear waves propagating in opposite directions whose fronts both have a very round shape, the approximation θ≈0 is even less accurate. The approximation contains more error when the inclusion does not lie on the horizontal line between the two sources, because both waves enter the inclusion at directions that, even on initiation, are not horizontal. See Fig. 4 for wavefront images in an inhomogeneous medium.
Figure 4.
Wavefronts in an inhomogeneous medium with a polynomial inclusion located at the center of the image plane. (a) and (e): wavefronts due to a single point source at (−0.025,0). (b) and (f): closeups of the regions outlined in (a) and (e). (c) and (g): wavefronts due to a single point source at (0.025,0). (d) and (h): closeups of the regions outlined in (c) and (g).
These calculations suggest that: either (1) the point sources need to be sufficiently far from the region of interest; or (2) the point sources need to be replaced by sources that don’t induce these artifacts; and∕or (3) the artifacts are removed by adding a step to the algorithm that computes the shear wave speed from the crawling wave data. Note that line sources are utilized in Castaneda et al. (2009). As we show later, line sources do not produce the type of artifacts that point sources produce.
SIMULATING THE SPECTRAL VARIANCE
As discussed earlier, our model is described by the viscoelastic equations 1. Since the experiment is designed to have most of the information in one component, we make a simplification and use a wave equation model:
| (9) |
We create synthetic data by solving the viscoelastic wave Eq. 9. It is important to test the algorithm on spectral variance data obtained from the viscoelastic wave equation simulation because this data is a good representation of the data collected experimentally. To generate accurate synthetic data, we implement the following procedures.
We consider the case where μ1 and τ1 are constant. We write the modulus μ0 as , where is the constant background and is the increase or decrease of μ0 in the inhomogeneity. We write the solution u as u=u0+us where u0 is the homogeneous solution, solving
Then the scattered wave us satisfies
where .
In the case of two point sources located at (x1,y1) and (x2,y2), the formula for u0 is:
where
and
where G0 is the homogeneous part of the complex modulus:
In the case of two line sources located at x=x1 and x=x2, the formula for u0 is
For better accuracy, we compute u0 using the exact formulas and we solve for only the scattered wave us numerically using a second-order numerical scheme. Then we compute the spectral variance:
In addition, since us is an outgoing solution, we assume the Sommerfeld radiation condition for the scattering field. Since the simulation can only be performed in a finite computational domain, we need to implement appropriate absorbing boundary conditions to prevent numerical reflections of outgoing waves. Collino and Tsogka (2001) introduced the perfectly matched absorbing layer (PML) model by the split-field approach for a general hyperbolic system. Here we follow their idea and surround the interior domain of interest by artificial absorbing layers where waves are trapped and attenuated. The setup of the first-order system that is solved in the layer follows the derivation in Collino and Tsogka (2001).
The calculations here are in two dimensions, but correspond to a three-dimensional experiment. The oscillating point source in 2d corresponds to a line source oscillating perpendicular to the plane of interest in 3d. The line source in 2d corresponds to a planar source in 3d. The circular inclusion in 2d corresponds to a cylindrical inclusion in 3d.
CRAWLING WAVE SPEED IMAGES
Given the spectral variance |u|2, we can recover the crawling wave speed by first computing the crawling wave arrival times by cross-correlation (Renzi, 2004; McLaughlin and Renzi, 2006a, 2006b), also including an optimization technique that encourages continuity in the arrival times, and then computing the crawling wave speed by Eq. 7. To calculate the derivatives of , we use an averaging method (Anderssen and Hegland, 1999) which controls the noise in the derivatives.
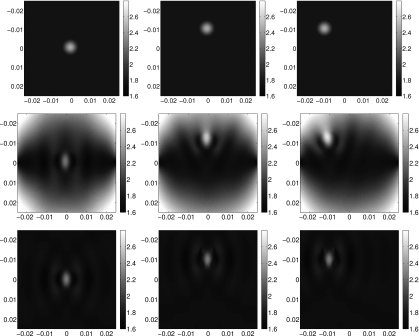
We consider three examples, all with a polynomial inclusion in μ0, but each with the inclusion centered in a different location. We solve the viscoelastic wave equation in a two-dimensional domain Ω={(x,y)∊R2:−0.025≤x≤0.025,−0.025≤y≤0.025}. We use frequencies ω1=101∗2π and ω2=100∗2π. We use point sources located at x=±0.025±2Δx, y=0 and line sources located at x=±0.025±2Δx. Recovered crawling wave speed images from both point sources and line sources are shown in Fig. 5, along with the exact wave speed images.
Figure 5.
Exact shear wave speed (top) and corresponding scaled crawling wave speed from 2d point sources (middle) and 2d line sources (bottom) for three polynomial inclusions.
With point sources, we see significant differences between the exact speed and the scaled crawling wave speed. In an image of the crawling wave speed, artifacts appear that do not appear in an image of the shear wave speed. The shape of the inclusion, which should be a perfect circle, becomes elongated. In some examples, depending upon the location of the inclusion in relation to the two sources, the inclusion appears to have a “tail.” This can be seen in the last two examples, which have the inclusion located close to the corner of the medium. This occurs because, as the two shear waves pass through the inclusion and into the area where the tail appears, their lines of constant phase are not parallel and their propagation directions make θ near π so that cos(θ∕2) is near zero. Given the relationship
we see that having θ near π causes the scaled crawling wave speed to be much higher than the shear wave speed. It should be noted that the colorbar has been adjusted, so the high-speed artifacts are significantly higher even than the images show. With line sources, we have significantly less artifact, because θ≈0 is generally a more accurate assumption.
In these examples, with a single inclusion in a constant background, we notice that the artifact is smallest when the inclusion is halfway between the point sources. However, as we can see in the last two examples, when the inclusion is not directly in line with the two sources, the image of the crawling wave speed depicts its location to be closer to the edge of the medium than it actually is. This is a result of having point sources close to, or in, the region of interest. When we have line sources, the position of the inclusion relative to the sources does not have much effect.
RECOVERING THE SHEAR WAVE SPEED
Since the scaled crawling wave speed can give the type of artifact shown in the previous section, we now develop an algorithm to recover the true shear wave speed.
We cannot solve Eq. 8 directly without knowing the phases ϕ1 and ϕ2, because cos(θ∕2) depends on ∇ϕ1 and ∇ϕ2. An alternative possibility is to solve the following system of equations for ϕ1, ϕ2, and cs:
In this paper, we instead derive a first-order partial differential equation (PDE) for ϕ1, where all that is needed is , and ω2. We then solve the PDE and use the phase ϕ1 to calculate the shear wave speed.
Derivation of the first-order PDE for the shear wave phase
We derive a first-order partial differential equation for the phase ϕ1, beginning with the equation for the spatially-dependent phase of the crawling wave, which is given by
Let . We take the gradient of both sides,
take the dot product of both sides with ∇ϕ1,
multiply the second term on the right-hand side by (|∇ϕ2||∇ϕ1|)∕(|∇ϕ2||∇ϕ1|)=1,
and simplify, using the definition cos θ=(∇ϕ2⋅∇ϕ1)∕(|∇ϕ2||∇ϕ1|), where θ(x) is the angle between ∇ϕ1(x) and ∇ϕ2(x), giving
Substituting |∇ϕ1|=1∕cs and |∇ϕ2|=1∕cs, and using Eq. 8, we have
We neglect the last two terms, where the error in doing so is O(Δω∕ω1), obtaining
| (10) |
Note that it is possible to derive and solve a PDE for ϕ2 in the same way, letting , obtaining
While both ϕ1 and ϕ2 satisfy very similar PDEs, they have different boundary conditions on the left and right boundaries of the region of interest, and so the solutions are not the same.
Shear wave speed recovery algorithm
The shear wave speed recovery algorithm for wave equation data has the following outline:
-
1.
Filter the spectral variance in time to remove all but the Δω frequency content;
-
2.
Find the phase by interpreting the values of as arrival times and cross-correlating the time traces of |u|2;
-
3.
Calculate and , using averaging to compute the derivatives;
-
4.
Solve the PDE 10 for ϕ1;
-
5.
Calculate ∇ϕ1 and cs, using averaging to compute the derivatives.
We note that the first step eliminates the effect of high-frequency noise in the data. For steps 2 and 3, our methods are the same as described in Section 6. Steps 4 and 5 are described in detail below.
Calculating ϕ1 from the PDE
To find the phase ϕ1 of the shear wave from the source on the left side of the medium, we need to solve the first order PDE:
To handle this equation in a stable and efficient manner, we adopt a first-order, fully-implicit upwind marching scheme which is unconditionally stable. The discretization of the PDE for the implicit upwind scheme is as follows.
If :
and if :
where
This scheme gives a diagonally-dominant linear system at every pseudo-time step xj. The stability result follows from a von Neumann stability analysis. We choose initial conditions on the left side of the domain consistent with the source type, so that for a line source, the initial condition is
and for a point source, the initial condition is
where r1 is the distance from the source and is the high-frequency approximation of the background shear wave speed. If we have line sources, we adopt a zero Neumann boundary condition on the top and bottom boundaries. If we have point sources, then if the outflow condition is satisfied, the numerical scheme will automatically solve for values on boundary points, but if the inflow condition is required, we adopt a Dirichlet boundary condition; that is, we use the value of ϕ1 which would be valid if there were no inclusion; i.e.,
For this simulation data, is known. For experimental data, we would have to use an estimate; for example, one could use as an estimate the results from compression tests on soft tissue similar to that being imaged, or alternatively, an average wave speed could be obtained from the time it takes for a wave initiated on one side of the tissue to propagate across the tissue.
To solve for the phase ϕ2, we use a similar procedure except we specify initial conditions in the right side of the domain and solve from right to left.
SHEAR WAVE SPEED IMAGES
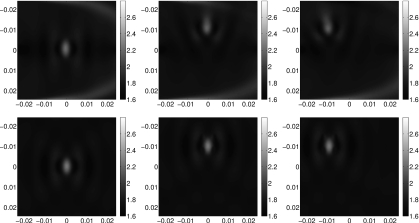
In Fig. 6, we show the recovered shear wave speed for the three cases introduced in Fig. 5, for both point and line sources.
Figure 6.
Recovered shear wave speed from 2d point sources (top) and 2d line sources (bottom) for three polynomial inclusions.
We can see in these images that the artifacts in the crawling wave speed using point sources have been significantly reduced in our shear wave speed images. The shear and crawling wave speeds using line sources are very similar. This is as we expect based on the previous analysis.
We note that the ring-like artifacts around the inclusion still appear in the shear wave speed images. These artifacts are a result of backscattering of the wave after it hits the inclusion. As the geometric optics approximation models forward scattering, we would not expect our algorithm to remove these artifacts.
In the case of point sources, we also see some artifacts propagating in from the upper and lower boundaries. These are a result of our using the high-frequency approximation of the shear wave speed on the boundary. These could be avoided by adapting the algorithm to take into account frequency-dependent wave speed; we will do this in the future.
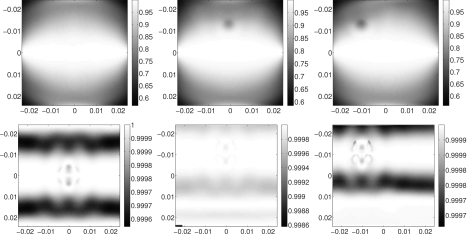
In Fig. 7, we show the term |cos(θ∕2)|. For point sources, the cosine term is significantly less than 1 in precisely the places where the scaled crawling wave speed had high-speed artifacts. For line sources, the cosine term is never significantly less than 1.
Figure 7.
Nonlinear term |cos(θ∕2)| calculated from recovered shear wave phases from 2d point sources (top) and 2d line sources (bottom) for three polynomial inclusions.
CONCLUSIONS AND FORTHCOMING WORK
Based on the foregoing calculations and numerical results, we suggest that (1) if the scaled crawling wave speed is to be used as an estimate of the shear wave speed, then an experimental setup with 2d line sources will yield a more accurate estimate; and (2) if 2d point sources are to be used, then (a) the scaled crawling wave speed images will have less artifact when the inclusion is close to the line between the two sources, and (b) an accurate image of the shear wave speed can be obtained by using the first-order PDE (10) and the Eikonal Eq. 3.
In summary, we have shown that it is possible to recover the shear wave speed, and the shape and location of an inclusion, from the data that is collected in the crawling wave experiment. We have done so by deriving and solving a partial differential equation for the phase of the shear wave.
We note that there are several advantages to using 2d line sources over 2d point sources. First, as mentioned above, the scaled crawling wave speed is a better approximation of the shear wave speed and thus a better indicator of tissue stiffness. Second, when solving the PDE for the shear wave phase, knowledge of the shear wave speed on the boundary is not required for line sources.
In a sequel paper, we apply the shear wave speed recovery algorithm to in vitro prostate data obtained in the crawling wave experiment, and compare our wave speed images to histology images.
In a future publication, we will consider the frequency-dependence of the shear wave speed and adapt the shear wave speed recovery algorithm accordingly, and compare the results of that algorithm to the results of the algorithm discussed in this paper, which is based on a high-frequency assumption. We will also calculate synthetic data in three dimensions.
ACKNOWLEDGMENTS
The authors acknowledge partial funding from the Office of Naval Research under Grant Nos. N000 14-05-1-0600 and N000 14-08-1-0432, the National Institutes of Health NIA under Grant No. R01AG029804, and the National Physical Science Consortium. This work was performed at IPRPI, the Inverse Problems Center at Rensselaer Polytechnic Institute.
The authors make a special note here to correct the notation in McLaughlin et al. (2007). The forms of the two shear waves should be the following: u1=Aeiω1(t−ϕ1), u2=Beiω2(t+ϕ2). The correction is the sign in the exponent of the second equation.
References
- Anderssen, R., and Hegland, M. (1999). “For numerical differentiation, dimensionality can be a blessing!,” Math. Comput. 68, 1121–1141. 10.1090/S0025-5718-99-01033-9 [DOI] [Google Scholar]
- Barbone, P. E., and Bamber, J. C. (2002). “Quantitative elasticity imaging: What can and cannot be inferred from strain images,” Phys. Med. Biol. 47, 2147–64. 10.1088/0031-9155/47/12/310 [DOI] [PubMed] [Google Scholar]
- Bercoff, J., Tanter, M., Chaffai, S., Sandrin, L., and Fink, M. “Ultrafast imaging of beamformed shear waves induced by acoustic radiation force: Application to transient elastography,” Proc.-IEEE Ultrason. Symp. 2002, 1899–1902. [Google Scholar]
- Bercoff, J., Tanter, M., and Fink, M. (2004). “Supersonic shear imaging: A new technique for soft tissue elasticity mapping,” IEEE Trans. Ultrason. Ferroelectr. Freq. Control 51, 396–409. 10.1109/TUFFC.2004.1295425 [DOI] [PubMed] [Google Scholar]
- Braun, J., Buntkowsky, G., Bernarding, J., Tolxdorff, T., and Sack, I. (2001). “Simulation and analysis of magnetic resonance elastography wave images using coupled harmonic oscillators and Gaussian local frequency estimation,” Magn. Reson. Imaging 19, 703–713. 10.1016/S0730-725X(01)00387-3 [DOI] [PubMed] [Google Scholar]
- Castaneda, B., An, L., Wu, S., Baxter, L. L., Yao, J. L., Joseph, J. V., Hoyt, K., Strang, J., Rubens, D. J., and Parker, K. J. (2009). “Prostate cancer detection using crawling wave sonoelastography,” Proc. SPIE 7265, 726513. 10.1117/12.811720 [DOI] [Google Scholar]
- Collino, F., and Tsogka, C. (2001). “Application of the perfectly matched absorbing layer model to the linear elastodynamic problem in anisotropic heterogeneous media,” Geophysics 66, 294–307. 10.1190/1.1444908 [DOI] [Google Scholar]
- Ehman, R. L., Manducca, A., McLaughlin, J. R., Renzi, D., and Yoon, J. -R. (2006). “Variance controlled shear stiffness images for MRE data,” Proceedings of the IEEE International Symposium on Biomedical Imaging: Macro to Nano, pp. 960–963.
- Fahey, B. J., Nightingale, K. R., McAleavey, S. A., Palmeri, M. L., Wolf, P. D., and Trahey, G. E. (2005). “Acoustic radiation force impulse imaging of myocardial radiofrequency ablation: Initial in vivo results,” IEEE Trans. Ultrason. Ferroelectr. Freq. Control 52, 631–641. 10.1109/TUFFC.2005.1428046 [DOI] [PubMed] [Google Scholar]
- Fung, Y. and Tong, P. (2001). Classical and Computational Solid Mechanics (World Scientific; ). [Google Scholar]
- Gao, L., Parker, K. J., and Alam, S. K. (1995). “Sonoelasticity imaging: Theory and experimental verification,” J. Acoust. Soc. Am. 97, 3875–3880. 10.1121/1.412399 [DOI] [PubMed] [Google Scholar]
- Greenleaf, F., Muthupillai, R., Rossman, J., Smith, J., Manduca, A., and Ehman, R. “Direct visualization of strain waves by magnetic resonance elastography,” Proc.-IEEE Ultrason. Symp. 1996, 467–472. [Google Scholar]
- Hoyt, K., Castaneda, B., and Parker, K. J. (2007a). “Feasibility of two-dimensional quantitative sonoelastographic imaging,” Proc.-IEEE Ultrason. Symp. 2007, 2032–2035. 10.1109/ULTSYM.2007.511 [DOI] [Google Scholar]
- Hoyt, K., Castaneda, B., and Parker, K. J. (2007b). “Muscle tissue characterization using quantitative sonoelastography: Preliminary results,” Proc.-IEEE Ultrason. Symp. 2007, 365–368. 10.1109/ULTSYM.2007.101 [DOI] [Google Scholar]
- Hoyt, K., Castaneda, B., and Parker, K. J. (2008a). “Two-dimensional sonoelastographic shear velocity imaging,” Ultrasound Med. Biol. 34, 276–288. 10.1016/j.ultrasmedbio.2007.07.011 [DOI] [PubMed] [Google Scholar]
- Hoyt, K., Kneezel, T., Castaneda, B., and Parker, K. J. (2008b). “Quantitative sonoelastography for the in vivo assessment of skeletal muscle viscoelasticity,” Phys. Med. Biol. 53, 4063–4080. 10.1088/0031-9155/53/15/004 [DOI] [PMC free article] [PubMed] [Google Scholar]
- Hoyt, K., Parker, K. J., and Rubens, D. J. “Sonoelastographic shear velocity imaging: Experiments on tissue phantom and prostate,” Proc.-IEEE Ultrason. Symp. 2006, 1686–1689. [Google Scholar]
- Hoyt, K., Parker, K. J., and Rubens, D. J. (2007c). “Real-time shear velocity imaging using sonoelastographic techniques,” Ultrasound Med. Biol. 33, 1086–1097. 10.1016/j.ultrasmedbio.2007.01.009 [DOI] [PubMed] [Google Scholar]
- Ji, L., and McLaughlin, J. R. (2004). “Recovery of the Lamé parameter μ in biological tissues,” Inverse Probl. 20, 1–24. 10.1088/0266-5611/20/1/001 [DOI] [Google Scholar]
- Ji, L., McLaughlin, J. R., Renzi, D., and Yoon, J. -R. (2003). “Interior elastodynamics inverse problems: Shear wave speed reconstruction in transient elastography,” Inverse Probl. 19, S1–S29. 10.1088/0266-5611/19/6/051 [DOI] [Google Scholar]
- Klatt, D., Hamhaber, U., Asbach, P., Baun, J., and Sack, I. (2007). “Noninvasive assessment of the rheological behavior of human organs using multifrequency MR elastography: A study of brain and liver viscoelasticity,” Phys. Med. Biol. 52, 7281–7294. 10.1088/0031-9155/52/24/006 [DOI] [PubMed] [Google Scholar]
- Konofagou, E. E., Harrigan, T., and Ophir, J. (2000). “Shear strain estimation and lesion mobility assessment in elastography,” Ultrasonics 38, 400–404. 10.1016/S0041-624X(99)00125-0 [DOI] [PubMed] [Google Scholar]
- Kruse, S. A., Smith, J. A., Lawrence, A. J., Dresner, M. A., Manduca, A., Greenleaf, J. F., and Ehman, R. L. (2000). “Tissue characterization using magnetic resonance elastography: Preliminary results,” Phys. Med. Biol. 45, 1579–1590. 10.1088/0031-9155/45/6/313 [DOI] [PubMed] [Google Scholar]
- Manduca, A., Lake, D. S., and Ehman, R. L. (2003). “Improved inversion of MR elastography images by spatio-temporal directional filtering,” Proc. SPIE 5032, 445–452. 10.1117/12.483589 [DOI] [PubMed] [Google Scholar]
- Manduca, A., Oliphant, T. E., Dresner, M. A., Mahowald, J. L., Kruse, S. A., Amromin, E., Felmlee, J. P., Greenleaf, J. F., and Ehman, R. L. (2001). “Magnetic resonance elastography: Noninvasive mapping of tissue elasticity,” Med. Image Anal. 5, 237–254. 10.1016/S1361-8415(00)00039-6 [DOI] [PubMed] [Google Scholar]
- Manduca, A., Oliphant, T. E., Lake, D. S., Dresner, M. A., and Ehman, R. L. (2002). “Characterization and evaluation of inversion algorithms for MR elastography,” Proc. SPIE 4684, 1180–1185. 10.1117/12.467076 [DOI] [Google Scholar]
- McLaughlin, J. R., and Renzi, D. (2006a). “Shear wave speed recovery in transient elastography and supersonic imaging using propagation fronts,” Inverse Probl. 22, 681–706. 10.1088/0266-5611/22/2/018 [DOI] [Google Scholar]
- McLaughlin, J. R., and Renzi, D. (2006b). “Using level set based inversion of arrival times to recover shear wave speed in transient elastography and supersonic imaging,” Inverse Probl. 22, 707–725. 10.1088/0266-5611/22/2/019 [DOI] [Google Scholar]
- McLaughlin, J. R., Renzi, D., Parker, K. J., and Wu, Z. (2007). “Shear wave speed recovery using moving interference patterns obtained in sonoelastography experiments,” J. Acoust. Soc. Am. 121, 2438–2446. 10.1121/1.2534717 [DOI] [PubMed] [Google Scholar]
- Nightingale, K. R., Palmeri, M. L., Nightingale, R. W., and Trahey, G. E. (2001a). “On the feasibility of remote palpation using acoustic radiation force,” J. Acoust. Soc. Am. 110, 625–634. 10.1121/1.1378344 [DOI] [PubMed] [Google Scholar]
- Nightingale, K. R., Soo, M. S., Nightingale, R. W., and Trahey, G. E. (2001b). “Investigation of real-time remote palpation imaging,” Proc. SPIE 4325, 113–119. 10.1117/12.428187 [DOI] [Google Scholar]
- Oberai, A. A., Gokhale, N. H., and Bamber, J. C. (2004). “Evaluation of the adjoint equation based algorithm for elasticity imaging,” Phys. Med. Biol. 49, 2955–2974. 10.1088/0031-9155/49/13/013 [DOI] [PubMed] [Google Scholar]
- Osher, S., and Fedkiw, R. (2002). Level Set Methods and Dynamic Implicit Surfaces (Springer-Verlag, Berlin: ). [Google Scholar]
- Osher, S., and Sethian, J. (1988). “Front propagation with curvature dependent speed: Algorithms based on Hamilton-Jacobi formulations,” J. Comput. Phys. 79, 12–49. 10.1016/0021-9991(88)90002-2 [DOI] [Google Scholar]
- Palmeri, M. L., McAleavey, S. A., Trahey, G. E., and Nightingale, K. R. (2006). “Ultrasonic tracking of acoustic radiation force-induced displacements in homogeneous media,” IEEE Trans. Ultrason. Ferroelectr. Freq. Control 53, 1300–1313. 10.1109/TUFFC.2006.1665078 [DOI] [PMC free article] [PubMed] [Google Scholar]
- Renzi, D. (2004). “Interior elastodynamics inverse problems: Shear wave speed recovery in transient elastography using level set based inversion of arrival times,” Ph.D. thesis, Rensselaer Polytechnic Institute, Troy, New York. [Google Scholar]
- Sethian, J. (1999). Level Set Methods and Fast Marching Methods: Evolving Interfaces in Computational Geometry, Fluid Mechanics, Computer Vision, and Materials Science (Cambridge University Press, Cambridge, England: ). [Google Scholar]
- Sinkus, R., Siegmann, K., Xydeas, T., Tanter, M., Claussen, C., and Fink, M. (2007). “MR elastography of breast lesions: Understanding the solid/liquid duality can improve the specificity of contrast-enhanced MR mammography,” Magn. Reson. Med. 58, 1135–1144. 10.1002/mrm.21404 [DOI] [PubMed] [Google Scholar]
- Tanter, M., Bercoff, J., Athanasiou, A., Deffieux, T., Gennisson, J. -L., Montaldo, G., Muller, M., Tardivon, A., and Fink, M. (2008). “Quantitative assessment of breast lesion viscoelasticity: Initial clinical results using supersonic shear imaging,” Ultrasound Med. Biol. 34, 1373–1386. 10.1016/j.ultrasmedbio.2008.02.002 [DOI] [PubMed] [Google Scholar]
- Taylor, L. S., Porter, B. C., Rubens, D. J., and Parker, K. J. (2000). “Three-dimensional sonoelastography: Principles and practices,” Phys. Med. Biol. 45, 1477–1494. 10.1088/0031-9155/45/6/306 [DOI] [PubMed] [Google Scholar]
- Thitaikumar, A., and Ophir, J. (2007). “Effect of lesion boundary conditions on axial strain elastograms: A parametric study,” Ultrasound Med. Biol. 33, 1463–1467. 10.1016/j.ultrasmedbio.2007.03.011 [DOI] [PMC free article] [PubMed] [Google Scholar]
- Wu, Z., Hoyt, K., Rubens, D. J., and Parker, K. J. (2006). “Sonoelastographic imaging of interference patterns for estimation of the shear velocity distribution in biomaterials,” J. Acoust. Soc. Am. 120, 535–545. 10.1121/1.2203594 [DOI] [PubMed] [Google Scholar]
- Wu, Z., Taylor, L. S., Rubens, D. J., and Parker, K. J. (2002). “Shear wave focusing for three-dimensional sonoelastography,” J. Acoust. Soc. Am. 111, 439–466. 10.1121/1.1419093 [DOI] [PubMed] [Google Scholar]
- Wu, Z., Taylor, L. S., Rubens, D. J., and Parker, K. J. (2004). “Sonoelastographic imaging of interference patterns for estimation of the shear velocity of homogeneous biomaterials,” Phys. Med. Biol. 49, 911–922. 10.1088/0031-9155/49/6/003 [DOI] [PubMed] [Google Scholar]
- Zhang, M., Castaneda, B., Wu, Z., Nigwekar, P., Joseph, J. V., Rubens, D. J., and Parker, K. J. (2007). “Congruence of imaging estimators and mechanical measurements of viscoelastic properties of soft tissues,” Ultrasound Med. Biol. 33, 1617–1631. 10.1016/j.ultrasmedbio.2007.04.012 [DOI] [PMC free article] [PubMed] [Google Scholar]
- Zhang, M., Nigwekar, P., Castaneda, B., Hoyt, K., Joseph, J. V., Sant’Agnese, A. D., Messing, E. M., Strang, J. G., Rubens, D. J., and Parker, K. J. (2008). “Quantitative characterization of viscoelastic properties of human prostate correlated with histology,” Ultrasound Med. Biol. 34, 1033–1042. 10.1016/j.ultrasmedbio.2007.11.024 [DOI] [PubMed] [Google Scholar]


