Abstract
Purpose
Osteosarcoma represents the most common malignant primary bone tumor in childhood; however, the survival rate has remained unchanged for past 20 years. To improve existing diagnosis and treatment methods and broaden the spectrum of imaging agents that can be used for early detection and assessment of tumor response to therapy, we performed a phage display-based screening for peptide sequences that bind specifically to osteosarcoma cells.
Experimental Design
From the Ph.D.™ −12 phage display peptide library comprising 2.7 ×10⁹ different displayed peptides, one peptide was enriched after 4 rounds of in vitro selection on 143B osteosarcoma tumor cells with 293T human embryonic kidney cells as a control. Both the peptide and the phage clone displaying the peptide were conjugated with fluorescent dyes for in vitro cell and ex vivo tumor tissue staining. The peptide was further labeled with 18F for positron emission tomography (PET) imaging studies. Cell uptake and efflux and ex vivo biodistribution were also performed with 18F labeled osteosarcoma specific peptide.
Results
ASGALSPSRLDT was the dominant sequence isolated from biopanning and named as OSP-1. OSP-1 shares a significant homology with heparinase II/III family protein, which binds and reacts with heparan sulfate proteoglycans (HSPGs). The fluorescence staining showed that FITC-OSP-1-phage or Cy5.5-OSP-1 had high binding with a panel of osteosarcoma cell lines, much less binding with UM-SCC1 human head and neck squamous cell carcinoma cells, and almost no binding with 293T cells; whereas the scrambled peptide OSP-S had virtually no binding to all the cell lines. 18F-OSP-1 had significantly higher accumulation in 143B tumor cells both in vitro and in vivo than 18F-OSP-S. 18F-OSP-1 also had higher uptake in 143B tumors than UM-SCC-1 tumors.
Conclusions
Our data suggest that OSP-1 peptide is osteosarcoma specific, and the binding site of OSP-1 might be related to heparan sulfate proteoglycans. Appropriately labeled OSP-1 peptide has the potential to serve as a novel probe for osteosarcoma imaging.
Keywords: Osteosarcoma (OS), Phage display, Positron emission tomography (PET), Molecular imaging, Heparan sulphate proteoglycans (HSPGs)
INTRODUCTION
Osteosarcoma, the most common non-hematologic primary malignant neoplasm of the bone, is characterized by the development of bone or osteoid substance by the tumor cells (1). The disease is mainly developed in young patients between 10 and 25 years old and it is one of the most frequent causes of cancer-related deaths in childhood (2). Approximately 25% of osteosarcoma metastasize, typically to the lung. Despite effective surgical removal of the primary tumor and aggressive chemotherapy, the rate of long-term survival is only 15% to 20% because of pulmonary metastases, non-responsiveness to therapy or disease relapse (3). Clinically, patients with osteosarcoma are usually diagnosed by a palpable mass on physical examination and a characteristic radiographic lesion. Laboratory work can disclose elevations in alkaline phosphatase (ALK), lactate dehydrogenase (LDH), and erythrocyte sedimentation rate (ESR) (4). However, early detection and differentiation of osteosarcoma from osteoid osteoma, aneurysmal bone cyst, infectious or inflammatory processes would be of great help for better control of this malignant disease.
Compared with traditional methods, molecular imaging usually exploits specific molecular probes as well as intrinsic tissue characteristics as the source of image contrast, and provides the potential for understanding integrative biology, earlier detection and characterization of disease, and evaluation of treatment (5). Imaging probes with high affinity and specificity would be the key to successful molecular imaging. Phage display technology represents a high-throughput combinatorial technique for screening billions of random fusion peptide ligands against multiple targets on the surface, or located within cancer cells and targets on tumor blood vessels (6). The distinctive advantage of this technique is that targets may be unknown and non-immunogenic yet may serve as a delineating character for a particular cell type or tumor type (7). Meanwhile, these peptide ligands can be conjugated with imaging agents or therapeutic drugs and may be a promising tool for affinity-based targeted delivery of imaging agents and drugs (8). For example, RGD peptide has been screened with phage display to target integrin proteins (9). RGD peptide and its derivatives have been widely applied to image integrin expression and tumor angiogenesis after being labeled with various radioisotopes (10). So far, no specific probe has been developed to image osteosarcoma.
In this study, we performed in vitro peptidic phage screening using human osteosarcoma 143B cells as selecting target with the protocol (Supplemental Figure 1). A new 12-mer peptide (OSP-1) was identified after four rounds of biopanning, with high binding affinity to 143B cells. The sequence of OSP-1 was found to be almost identical to the 17–28 residues of Heparinase II/III. This enzyme binds and cleaves cell-surface heparan sulphate proteoglycans (HSPGs), which are overexpressed on osteosarcoma cells. 18F-labeled OSP-1 allowed successful noninvasive PET imaging of osteosarcoma tumors in athymic nude mice model, indicating OSP-1 imaging as a promising strategy for early detection of osteosarcoma. To our best knowledge, this is the first PET imaging of osteosarcoma with specific small molecular peptide probe.
MATERIALS AND METHODS
Cell lines and animal models
The 143B, G292, MG-63, U-2 OS, and Saos-2 human osteosarcoma cell lines, UM-SCC1 human head and neck squamous carcinoma and 293T human embryonic kidney cell lines were purchased from the American Type Culture Collection (ATCC, Manassas, VA). The 143B cells were grown in RPMI1640 medium supplemented with 10% (v/v) fetal bovine serum (FBS, Invitrogen) and 0.015 mg/ml 5-bromo-2′-deoxyuridine at 37°C in an atmosphere containing 5% CO2. The U-2 OS, MG-63, G292 and Saos-2 cells were grown in Dulbecco’s modified Eagle medium (Invitrogen) supplemented with 15% (v/v) FBS at 37°C in an atmosphere containing 5% CO2. UM-SCC1 and 293T cells were grown in Dulbecco’s modified Eagle medium (Invitrogen) supplemented with 10% (v/v) FBS at 37°C in an atmosphere containing 5% CO2. The 143B tumor model was generated by subcutaneous injection of 5×10⁶ cells into the left front flank of female athymic nude mice (Harlan Laboratories). The UM-SCC1 tumor model was established by injection of 5×10⁶ cells into the right front flank of the same mice 2 weeks prior to 143B cell inoculation. The mice were used for microPET studies when the tumor volume reached about 300 mm3 (about 1–2 weeks for 143B, and about 3–4 weeks for UM-SCC1). All animal studies were conducted in accordance with the principles and procedures outlined in the Guide for the Care and Use of Laboratory Animals (11) and were approved by the Institutional Animal Care and Use Committee of Clinical Center, the National Institutes of Health.
Selection of tumor cell binding peptides
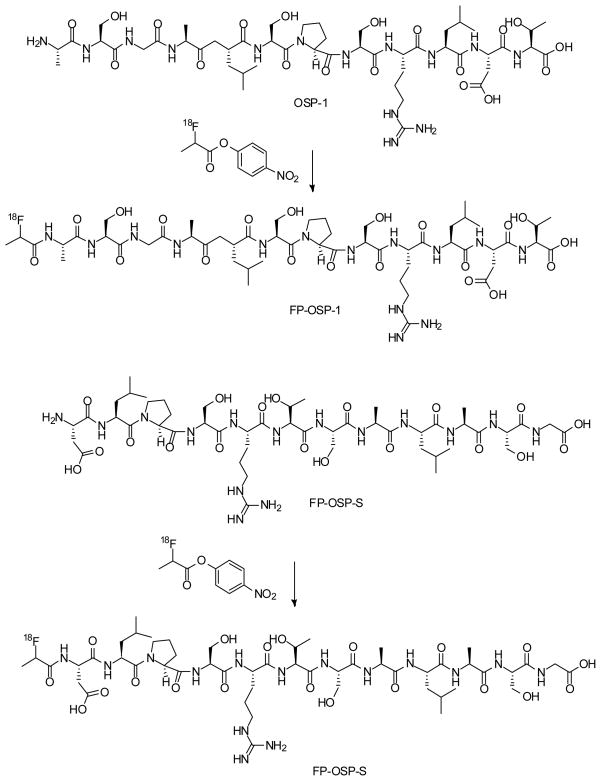
For biopanning, a linear 12-amino-acid peptide library (Ph.D.™ −12 phage display peptide library, New England Biolabs Inc.) was used. Each selection round was conducted as follows: 1×10¹¹ plaque-forming units were added to 293T cells for negative selection. The supernatant was then transferred to 143B cells for positive selection. After 1 h, the cells were washed 5 times with PBS plus 1% bovine serum albumin (BSA) to remove unbound phage particles. The cells and the bound phages were then incubated with E. coli host strain ER2738 to be amplified according to the manufacturer’s protocol. After four rounds of screening, 20 random phage clones were selected for DNA sequencing. The amino acid sequences of displayed peptides were deduced from the DNA sequence. The dominant peptide sequence, ASGALSPSRLDT, was identified and named as OSP-1 for further experiments (Fig. 1).
Fig. 1.
Scheme of the synthesis of 18F-FP-OSP-1 (A) and 18F-FP-OSP-S (B).
Dye-labeling of peptides and phage particles
The peptide OSP-1 and its scrambled peptide OSP-S (DLPSRTSALASG) were synthesized using a peptide synthesizer and purified with HPLC. For peptide labeling, OSP-1 (or OSP-S, 0.5 mg, 0.4 μmol) and DIPEA (7.5 μl) was added to a solution of Cy5.5 NHS ester (0.5 mg, 0.4 μmol) in DMF (150 μl), the reaction mixture was stirred at room temperature for 2 h and quenched with 10 μl of acetic acid. The crude product was purified by reserve phase HPLC on a semipreparative C-18 column. The desired fractions containing Cy5.5-OSP-1 (or Cy5.5-OSP-S) were collected and lyophilized to give a green fluffy powder. Yield: 57% (> 99% purity). The identity of the products were confirmed by TOF-MS ES+: Cy5.5-OSP-1, m/z 1035.79 for [M+H/2] (C89H123N17O32S4, calculated [MW] 2068.73), and Cy5.5-OSP-S, m/z 1035.75 for [M+H/2] (C89H123N17O32S4, calculated [MW] 2068.73), respectively.
OSP-1 phages (1×10¹² pfu) were resuspended in 100 μl of a 0.3-M NaHCO3 (pH 8.6) solution containing 0.25 mg/mL FITC. The phage/fluorochrome reaction was allowed to continue for 1 hour at room temperature in the dark. Subsequent to incubation, the volume of the labeled OSP-1-phage was brought up to 1 ml with DPBS, and the OSP-1-phage was then PEG-precipitated twice and dialyzed extensively against 50 mM Tris–HCl and 150 mM NaCl (pH 7.5; TBS) to remove excess FITC (12).
Fluorescence staining
Live 143B, G292, MG-63, U-2 OS, Saos-2, UM-SCC1 and 293T cells were blocked with 10% bovine serum albumin for 60 min at 37°C, and stained with FITC-OSP-1-phage, Cy5.5-OSP-1 or Cy5.5-OSP-S (100 nM) for 60 min at 37°C or at room temperature in dark. After 5 washing steps, the fixed cells were mounted with 4’,6-diamidino-2-phenylindole (DAPI)-containing mounting medium and all cells were observed by an epifluorescence microscope (Olympus, X81).
Frozen 143B and UM-SCC1 tumor tissue slices (8–10 μm) from the tumor-bearing nude mice were fixed with cold acetone for 20 min and dried in the air for 30 min at RT. After blocking with 1% BSA for 30 min, the sections were incubated with Cy5.5-OSP-1 or Cy5.5-OSP-S (100 nM) for 60 min RT in dark. After 5 washing steps, the slices were mounted with DAPI-containing mounting medium under an epifluorescence microscope (Olympus, X81). Each experiment was performed in duplicate and repeated twice.
In order to determine cell surface expression pattern of heparan sulphate proteoglycan (HSPG) receptor, 143B, U-2 OS, MG-63, G292, Saos-2, UM-SCC1 and 293T cells were fixed with cold alcohol for 20 min. After blocking with 10% BSA for 30 min, the fixed cells were incubated with mouse anti-heparin/heparan sulfate monoclonal antibody (1:300, Millipore, Temecula, CA) for 1 h at room temperature and then visualized with Cy3-conjugated donkey anti-mouse secondary antibody (1:300; Jackson ImmunoResearch Laboratories, West Grove, PA). To confirm that OSP-1 peptide binds to HSPG receptor, fixed 143B cells were blocked with 10% BSA for 30 min and then incubated with OSP-1 (10 μM) for 1 h at room temperature, followed by mouse anti-heparin/hepararan sulfate monoclonal antibody (1:300, Millipore, Temecula, CA) for 1 h at room temperature and then visualized with Cy3-conjugated donkey anti-mouse secondary antibody (1:300; Jackson ImmunoResearch Laboratories, West Grove, PA). After 5 washing steps, the fixed cells were mounted with DAPI-containing mounting medium and all cells were observed by an epifluorescence microscope (Olympus, X81).
Radiochemistry
To a solution of 2-fluoropropionic acid (92 μg, 1 μmol) in DMF (9.2 μl) was added a solution of O-(N-succinimidyl)-1,1,3,3-tetramethyluronium tetrafluoroborate (TSTU, 0.3 mg, 1 μmol) in DMF (30 μl) and diisopropylethyalamine (DIPEA, 10 μl). The reaction mixture was heated at 60 °C for 20 min and was added to a solution of OSP-1 (or OSP-S, 1.2 mg, 1 μmol) in DMF (120 μl). The reaction mixture was heated for another 20 min at 60 °C and quenched with 20 μl of acetic acid. The crude product was purified by reserve phase HPLC on a semipreparative C-18 column. The desired fractions containing FP-OSP-1 (or FP-OSP-S) conjugate were collected and lyophilized to give a white fluffy powder. Yield: >95% (purity >99%). The identity of the products were confirmed by TOF-MS ES+ : FP-OSP-1, m/z 1248.65 for [MH]+ (C51H87FN15O20, calculated [MW] 1248.32), and FP-OSP-S, m/z 1248.67 for [MH]+ (C51H87FN15O20, calculated [MW] 1248.32), respectively.
The 18F labeling precursor, 4-nitrophenyl 2-18F-fluoropropionate (18F-NFP), was synthesized as previously reported (13). The OSP-1 and OSP-S labeling were as follows: OSP-1 (or OSP-S, 500 μg) dissolved in 150 μl anhydrous DMSO was added to dried 18F NFP in a 1ml reaction vial, followed by addition of 20 μl of DIPEA. The reaction mixture was allowed to stand at RT for 30 min and quenched with 800 μl of 5% aqueous acetic acid solution. The labeled peptide was purified by reserved phase HPLC on a semipreparative C-18 column. The desired fractions containing 18F-FP-OSP-1 (or 18F-FP-OSP-S) were collected and diluted with 20 ml of water. After trapping with a C-18 cartridge preactivated with 5 ml of ethanol and 10 ml of water, the product was washed with 2 ml of water and eluted with 2 ml of ethanol. The ethanol solution was blow dried with a slow stream of N2 at 60 °C. The 18F labeled peptide was redissolved in PBS solution and passed through a 0.22 μm Millipore filter into a sterile multidose vial for in vitro and in vivo experiments. The labeling yield is 20% after the unlabeled peptide was efficiently separated from the product. The specific activity was estimated to be ~37 TBq/mmol on the basis of the labeling agent 18F-NFP.
Cell uptake and efflux
The cell uptake studies were performed as we have previously described with some modifications (14). Briefly, 143B, UM-SCC1 or 293T cells were seeded into 12-well plates at a density of 5×10⁵ cells per well and incubated (about 37 kBq/well) with 18F-labeled tracers at 37°C for 15, 30, 60, and 120 min. Tumor cells were then washed three times with chilled PBS and harvested by trypsinization with 0.25% trypsin/0.02% EDTA (Invitrogen). The cell suspensions were collected and measured in a γ counter (Packard, Meriden, CT). The cell uptake was expressed as percentage of decay corrected total input radioactivity. Experiments were performed twice with triplicate wells. For efflux studies, 18F -labeled tracers (about 37 kBq/well) were first incubated with 143B, UM-SCC1 or 293T cells in 12-well plates for 2 h at 37°C to allow internalization. Then cells were washed twice with PBS, and incubated with cell culture medium for 15, 30, 60 and 120 min. After washing three times with PBS, cells were harvested by trypsinization with 0.25% trypsin/0.02% EDTA. The cell suspensions were collected and measured in a γ counter. Experiments were performed twice with triplicate wells. Data are expressed as percent added dose after decay correction.
MicroPET imaging
PET scans and image analysis were performed using an Inveon microPET scanner (Siemens Medical Solutions). Each 143B and UM-SCC1 tumor-bearing mouse was injected in a tail vein with 3.7 MBq (100 μCi, 0.1 nmol in 100 μl) of 18F-OSP-1 or 18F-OSP-S under isoflurane anesthesia (n = 6 per group). For static PET, 5-min scans were acquired at 30 min, 1 h, and 2 h after injection. The images were reconstructed using a two-dimensional ordered subsets expectation maximum (OSEM) algorithm and no correction was applied for attenuation or scatter. For each microPET scan, regions of interest (ROIs) were drawn over the tumor, normal tissue and major organs using vendor software ASI Pro 5.2.4.0 on decay-corrected whole-body coronal images. The maximum radioactivity concentrations (accumulation) within a tumor or an organ were obtained from mean pixel values within the multiple ROI volume and then were converted to megabecquerels per milliliter using a conversion factor. These values were then divided by the administered activity to obtain (assuming a tissue density of 1 g/ml) an image ROI-derived percent injected dose per gram (%ID/g), according to the following formulas: Cf = MBq/ml/MV; % ID/g = 100*MV/Cf/Total Activity in MBq (Cf: conversion factor; MBq: megabecquerel; MV: mean value of pixels in ROI).
Ex vivo biodistribution
Female athymic nude mice bearing 143B and UM-SCC1 xenografts were injected with 0.925 MBq (25 μCi, 25 pmol in 100 μl) of 18F-OSP-1 or 18F-OSP-S to evaluate the distribution of the tracers in the tumor tissues and major organs. At 2 h and 4 h after injection of the tracer, the tumor-bearing mice were sacrificed and dissected. Blood, tumor, major organs, and tissues were collected and wet-weighed. The radioactivity in the wet whole tissue was measured by γ counter (Packard, Meriden, CT). The results are presented as percentage injected dose per gram of tissue (%ID/g). For each mouse, the radioactivity of the tissue samples was calibrated against a known aliquot of the injectate and normalized to a body mass of 20 g. Values were expressed as mean ± SD for groups of four animals (n=4 per group).
Statistical analysis
Quantitative data were expressed as means ± SD. Means were compared using one-way analysis of variance (ANOVA) and a Student’s t test. P values <0.05 were considered statistically significant.
RESULTS
Identification of 143B-binding peptide OSP-1
Four selection rounds were performed on the 143B cell line with a linear 12-amino-acid peptide library to allow for enrichment of tumor cell binding or internalizing phages. Before each selection round, a negative selection with the 293T human embryonic kidney cell line was performed to subtract phages that bound to non-tumor cells. After the final selection round, single-stranded DNAs of 20 clones were sequenced and analyzed. One sequence was found to be enriched in 65% of all sequenced clones and termed OSP-1. OSP-1 is a 12-amino-acid long linear peptide comprising the sequence ASGALSPSRLDT. In order to provide a control peptide, we reshuffled the amino acid sequence of OSP-1 and synthesized a scramble peptide DLPSRTSALASG, named with OSP-S.
Fluorescence staining
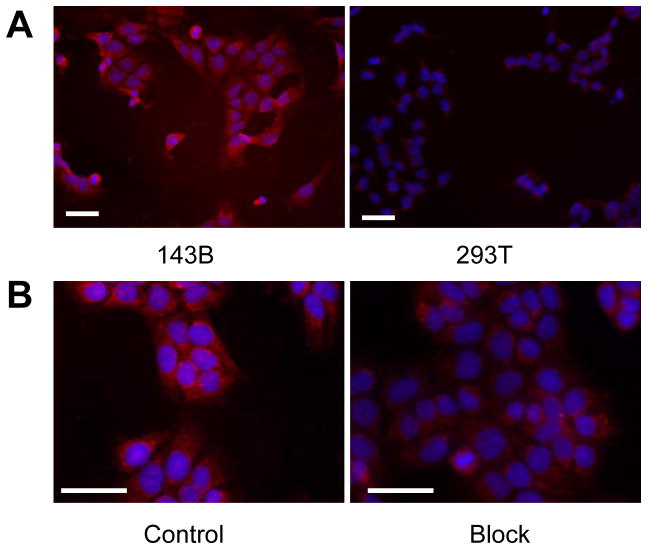
To determine osteosarcoma cell binding ability of OSP-1 in vitro, live 143B, G292, MG-63, U-2 OS, Saos-2, UM-SCC1 and 293T cells were stained with FITC-OSP-1-phage, Cy5.5-OSP-1 or Cy5.5-OSP-S (100 nM). As shown in Fig. 2, FITC-OSP-1-phage showed abundant binding to 143B cells as indicated by strong fluorescent signal and almost no binding to 293T cells (Fig. 2A). Similarly, C5.5-OSP-1 peptide showed strong binding to all 5 osteosarcoma cell lines tested (143B, G292, MG-63, U-2 OS, Saos-2), much less binding to UM-SCC1 cells and no binding to 293T cells. Moreover, the scramble peptide, Cy5.5-OSP-S, exhibited little binding to all the cell lines (Supplemental Figure 2). Ex vivo staining with Cy5.5-OSP-1 showed that the fluorescent signal distributed strongly and diffusively among the whole 143B tumor sections. We did not observe any preferred localization region. No apparent staining signals were observed in UM-SCC1 tumor sections and no binding of Cy5.5-OSP-S to 143B and UM-SCC1 tumors was observed (Fig. 2B). These in vitro and ex vivo staining data supported high affinity and specificity of the identified OSP-1 peptide to 143B osteosarcoma.
Fig. 2.
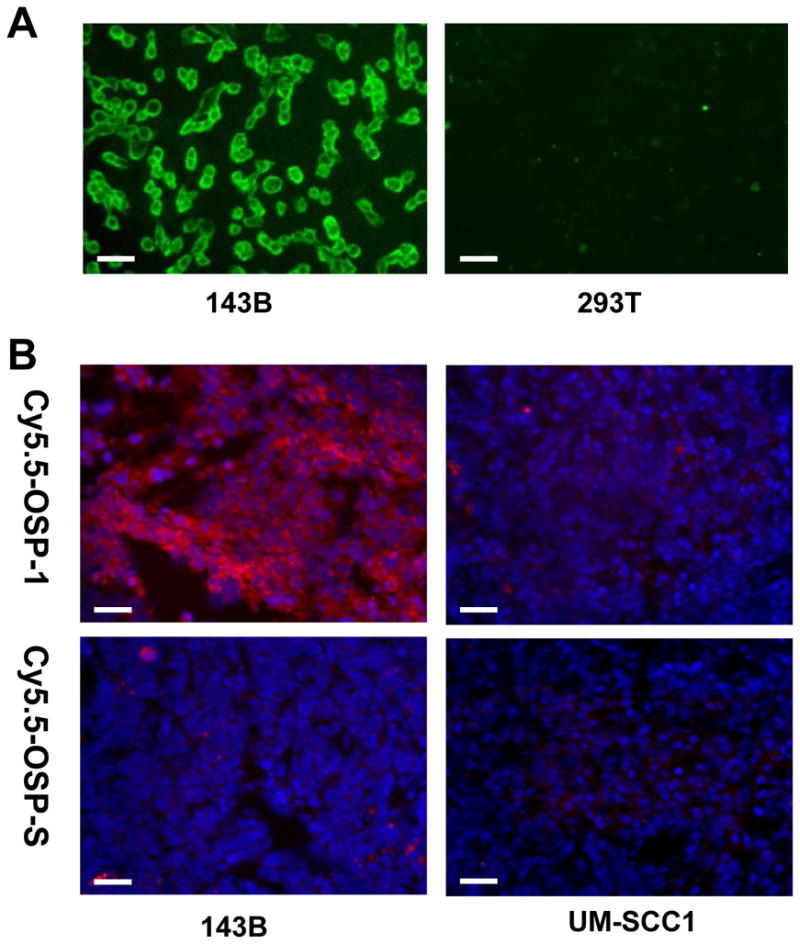
Fluorescence staining to determine the binding affinity of OSP-1 and OSP-S in vitro and ex vivo. Scale bar equals 50 μm. A, fixed human osteosarcoma 143B cells and control 293T human embryonic kidney cells were stained using 100 nM FITC-OSP-1-phage. Green color is from FITC for OSP-1-phage. Magnification, 200 x. B, frozen 143B and UM-SCC1 tumor tissue were stained using 100nM Cy5.5-OSP-1 and Cy5.5-OSP-S. Red color is from Cy5.5 for OSP-1 or OSP-S, and blue color from DAPI for nuclei visualization. Magnification, 200 x.
As the OSP-1 peptide (ASGALSPSRLDT) shares a significant homology with the 17–28 amino acid residues of heparinase II/III family protein (AGGTVTPARLDT), which binds and reacts with heparan sulphate proteoglycan (HSPG), we first checked the expression pattern of HSPG receptor on 5 osteosarcoma cell lines (143B, G292, MG-63, U-2 OS, and Saos-2) and compared with UM-SCC1 head and neck cancer cell line, and 293T cell line by heparin/heparan sulfate antibody staining. It was found that proteoglycans are abundantly expressed by all the tested osteosarcoma cell lines but not by UM-SCC1 and 293T cells (Fig. 3A and Supplemental Figure 3). We then checked HSPG receptor specificity of OSP-1 peptide. As shown in Figure 3B, pre-incubation with OSP-1 peptide abrogated the binding of heparin/heparan sulfate antibody to 143B osteosarcoma cells.
Fig. 3.
Immunofluorescence staining staining of heparan sulphate proteoglycan (HSPG) without and with OSP-1 blocking. Scale bar equals 50 μm. A, heparin/heparan sulfate monoclonal antibody staining of 143B and 293T cell lines. Magnification, 200 x. B, Mouse anti-heparin/heparan sulfate antibody staining of fixed 143B in the presence of OSP-1. Magnification, 400 x.
Cell uptake and efflux of OSP-1
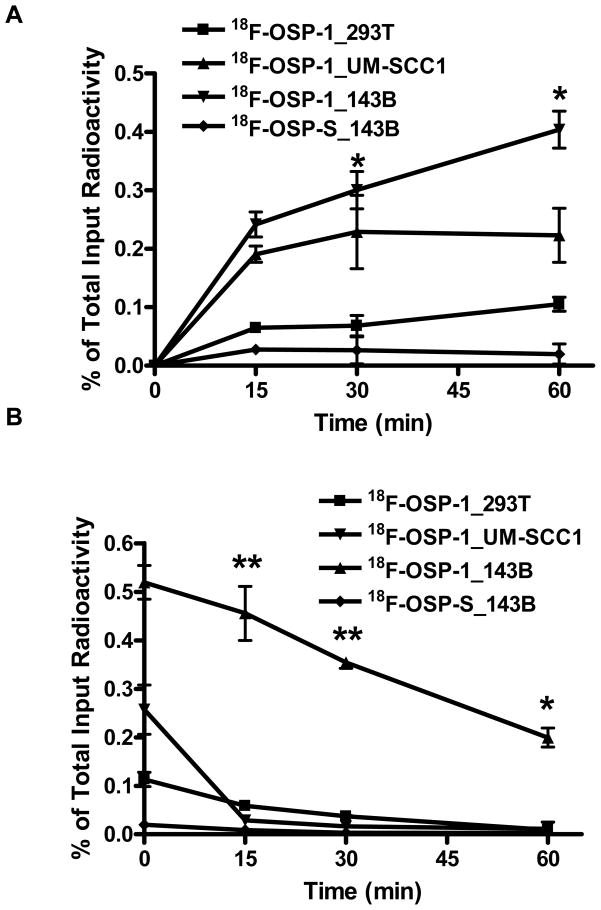
We further developed OSP-1 as a PET imaging tracer by labeling it with a positron emitting radioisotope, 18F (t1/2= 108 min). The labeling and structure of 18F-OSP-1 and 18F-OSP-S was shown in Fig. 1. Both 18F-FP-OSP-1 and 18F-FP-OSP-S were characterized in vitro by cell uptake and efflux assay 143B, UM-SCC1 and 293T cells. 18F-FP-OSP-1 had significantly higher cell uptake in 143B cells than both UM-SCC1 and 293T cells (Fig. 4A). UM-SCC1 was between those of 143B and 293T with moderate cells uptake of 18F-FP-OSP-1. 18F-FP-OSP-1 uptake in 143B cells reached the maximum of 0.52 % of total input radioactivity after 120 min. In contrast with 18F-FP-OSP-1, 18F-FP-OSP-S showed only 0.02% of total input radioactivity in 143B. Although decreasing along with time, the cell retention of 18F-FP-OSP-1 in the three cell lines also showed the order of 143B> UM-SCC1 > 293T. 18F-FP-OSP-1 in UM-SCC1 and 293T were undetectable after 60 min. 18F-FP-OSP-S in 143B cell line was undetectable after 15 min (Fig. 4B).
Fig. 4.
A, Time dependent uptake of 18F-FP-OSP-1 and 18F-FP-OSP-S in 143B, UM-SCC1 and 293T cells (n=3, mean ± SD). B, Time dependent efflux of 18F-FP-OSP-1 and 18F-FP-OSP-S in 143B, UM-SCC1 and 293T cells (n=3, mean ± SD).
MicroPET imaging
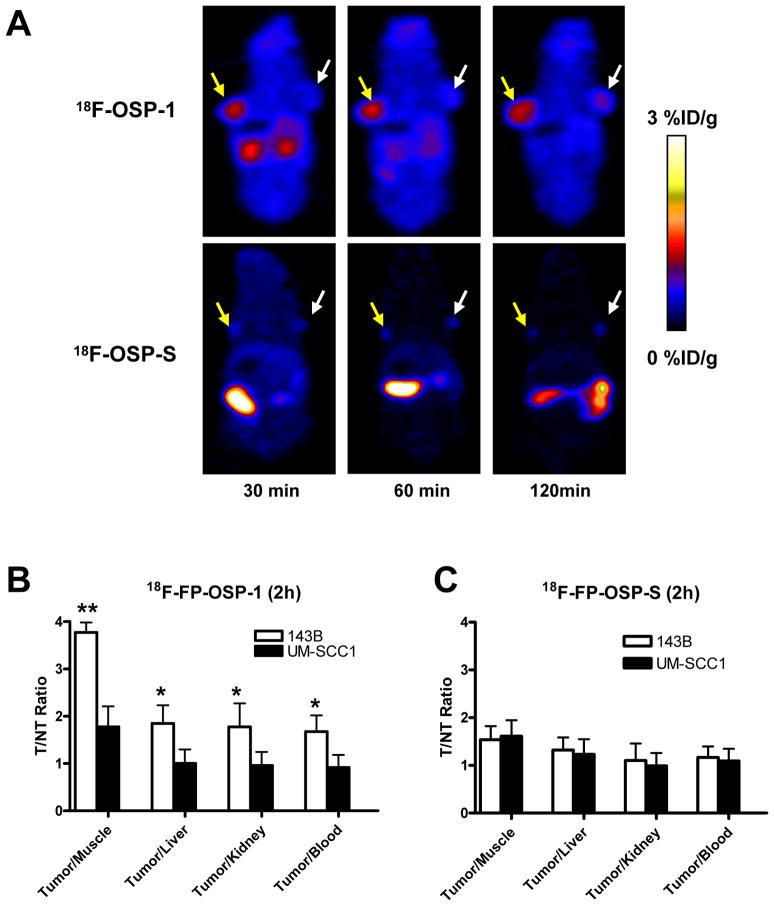
Next, we performed in vivo microPET imaging with 18F-FP-OSP-1 and 18F-FP-OSP-S as imaging agent. Representative coronal microPET images of 143B and UM-SCC1 tumor bearing mice (n=6 per group) at different times after intravenous injection of 3.7 MBq (100 μCi) of 18F-FP-OSP-1 or 18F-FP-OSP-S are shown in Fig. 5A. The 143B tumors were clearly visible with high contrast in relation to the contralateral UM-SCC1 tumors at all time points measured from 30 to 120 min after injection of 18F-FP-OSP-1. Prominent uptake of 18F-FP-OSP-1 was also observed in the kidneys at early time points, suggesting that this tracer is mainly excreted through the renal-urinary route. Tumor and major organ activity accumulation in the microPET scans was quantified by measuring the ROIs that encompassed the entire organ on the coronal images. The 143B tumor uptake of 18F-FP-OSP-1 was significantly higher than the UM-SCC1 tumor at all time points examined (p<0.01; Supplemental Figure 4A). At 120 min after injection, the uptake in 143B tumors was 1.43 ± 0.14 % ID/g versus 0.75 ± 0.12 % ID/g in UM-SCC1 tumors. The in vivo 143B tumor binding specificity of 18F-FP-OSP-1 was also confirmed by comparison with 18F-FP-OSP-S studies. 18F-FP-OSP-S showed significantly lower uptake than 18F-FP-OSP-1 in 143B tumor at all time points (P<0.01). At 30, 60 and 120 min post injection, a 5.9-, 3.6- and 3.9-fold uptake of 18F-FP-OSP-1 compared to 18F-FP-OSP-S within 143B tumor was observed (Supplemental Figure 4B). The tumor-to-nontumor (T/NT) ratios of 18F-FP-OSP-1 and 18F-FP-OSP-S at 120 min were calculated and are compared in Fig. 5B and C. The tumor/kidney, tumor/liver and tumor/muscle ratios of 18F-FP-OSP-1 in 143B were significantly higher than those in UM-SCC1 (P < 0.05). By contrast, the T/NT ratios of 18F-FP-OSP-S in 143B and UM-SCC1 tumors were not significantly different from each other. In addition, the tumor/muscle ratio of 18F-FP-OSP-1 in 143B tumors was significantly higher than that of 18F-FP-OSP-S (P < 0.05).
Fig. 5.
In vivo imaging of transplanted tumors by OSP-1 and OSP-S. A, Decay-corrected whole-body coronal microPET images of 143B and UM-SCC1 tumor-bearing mice at 30, 60 and 120 min after injection of 3.7MBq (100 μCi) of 18F-FP-OSP-1 or 18F-FP-OSP-S. The images shown are 5-min static scans of a single mouse, which is representative of the six mice tested in each group (yellow arrows indicate 143B tumors and white arrows indicate UM-SCC1 tumors). B and C, Comparison of tumor to muscle, liver, kidney and blood ratios of 18F-FP-OSP-1 or 18F-FP-OSP-S at 120 min after injection of 3.7 MBq (100μCi) tracer in 143B and UM-SCC1 tumor-bearing mice (n=6 per group) as measured by PET imaging (**, P<0.01; *, P<0.05).
Biodistribution studies
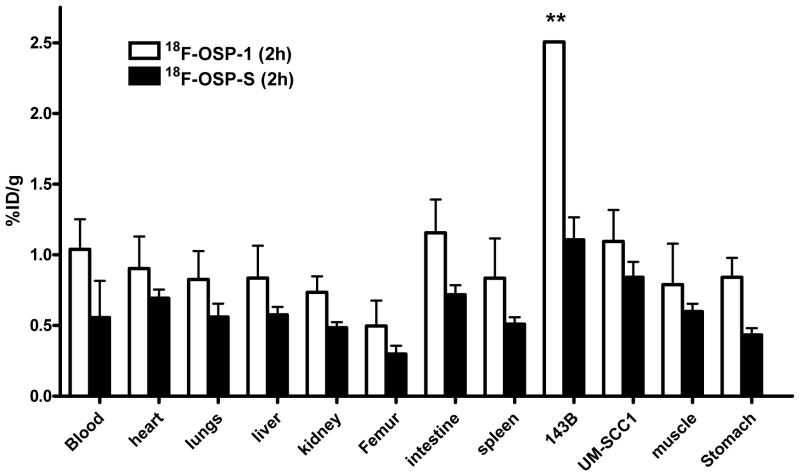
To validate the microPET quantification, we also performed biodistribution studies. Female nude mice bearing 143B and UM-SCC1 xenografts (n=4 per group) were injected intravenously with 0.925 MBq (25 μCi) of 18F-FP-OSP-1 and then sacrificed at 2 h or 4 h after injection of the tracer. The data are expressed as the percentage injected dose per gram of tissue (%ID/g) in Figure 6. 18F-FP-OSP-1 uptake in 143B tumors was significantly higher than that in UM-SCC1 tumors (p<0.05), which is consistent with the microPET data. To further determine the in vivo binding specificity of 18F-OSP-1, we also injected 18F-OSP-S into 143B and UM-SCC1 tumor bearing mice (n=4 per group) with a dose of 0.925 MBq (25 μCi). In 143B tumor, a significantly lower uptake of 18F-OSP-S was seen compared to uptake of 18F-OSP-1 (Supplemental Figure 5A) (1.106 ± 0.096 ID/g v.s. 2.506 ± 0.002 %% ID/g, P < 0.01) at the 120 min time point, indicating the tumor targeting specificity of 18F-OSP-1 in the 143B tumor model. The T/NT ratios of 18F-FP-OSP-1 and 18F-FP-OSP-S at 120 min were calculated from the biodistribution data and are compared in Supplemental Figure 5B. Consistent with the quantification from PET imaging, the T/NT ratios of 18F-FP-OSP-1 in 143B tumor were also significantly higher than that in UM-SCC1 tumors (p<0.05). The tumor muscle ratio of both 18F-FP-OSP-1 and 18F-FP-OSP-S quantified from ex vivo biodistribution data (3.49±0.35 and 1.74±0.05) is comparable with that from PET imaging (3.77±0.21 and 1.54±0.18).
Fig. 6.
Biodistribution of 18F-FP-OSP-1 and 18F-FP-OSP-S (0.925 MBq per mouse) in 143B and UM-SCC1 tumor-bearing nude mice at 120 min after injection. Data are expressed as mean %ID/g ± SD (n=4 per group; **, P<0.01).
DISCUSSION
In view of the high level of malignancy and metastatic ability of osteosarcoma, early detection with high sensitivity and specificity would greatly help tumor control. Phage display is a successful tool for identifying novel peptides with high specificity to tumor cells or tumor blood vessels (6, 15). In this study, by applying a 12-mer peptide library to human osteosarcoma 143B cell lines, we were able to identify the binding peptide OSP-1. This peptide was found to be enriched in 65% of all sequenced clones. OSP-1 demonstrated specific binding to osteosarcoma cell lines in vitro. The specificity was supported by significantly lower binding of OSP-1 to non-osteosarcoma cancer cells and normal cells and much lower cell binding in vitro of the scramble peptide OSP-S.
The in vivo behavior of 18F-FP-OSP-1 was tested in animal experiments using microPET. 18F-FP-OSP-1 showed enhanced tumor uptake versus 18F-FP-OSP-S in 143B xenograft animal models. The tumor-to-muscle ratio for 18F-FP-OSP-1 was 3.8 compared to a ratio of 1.5 for 18F-FP-OSP-S at 120 minutes postinjection, indicating that OSP-1 is a promising molecule for specific imaging of osteosarcoma. The specificity for osteosarcoma of OSP-1 was further demonstrated with animals bearing UM-SCC1 human head and neck squamous carcinoma tumors. The much lower tumor-to-muscle ratio of 18F-FP-OSP-1 in UM-SCC1 tumors indicated that OSP-1 has the potential to differentiate osteosarcoma and other malignant tumors. The biodistribution data showed that the tracer uptake of 18F-FP-OSP-1 in 143B tumors at 120 min was significantly higher compared with that in the UM-SCC1 tumors and uptake of 18F-FP-OSP-S in 143B tumors. Although the tumor uptake value acquired by ex vivo biodistribution assay is higher than that quantified based on PET scan, the tumor/non tumor ratios are consistent, which demonstrates the feasibility to detect osteosarcoma with PET imaging using 18F-FP-OSP-1 as a specific tracer.
We noticed the different pharmacokenetics of 18F-FP-OSP-1 and the scramble peptide 18F-FP-OSP-S, with OSP-1 excreted mainly through renal-urinary route and the scramble peptide through biliary route. The exact reason for this is not clear since the amino acid components are identical with these two peptides and both peptides are metabolically stable. We speculated that OSP-1 and OSP-S form different conformations due to varying order of the same amino residues, resulting in different hydrophobicities. The exact binding target is usually unknown when using whole cells as the selecting object during phage display process. A protein database search for OSP-1 revealed that this peptide shares a significant homology with heparinase II/III family protein, which binds and reacts with HSPGs (16–17). Since the proteoglycan are abundantly expressed by osteocytes and osteogenic tumor cells, which rely on proteoglycans in cell attachment processes and mineralization (18), it is highly reasonable to surmise that the binding targets of OSP-1 on the surface of osteosarcoma cells are HSPGs. Our data confirmed that osteosarcoma cells overexpress HSPGs and that anti-heparin/heparan sulfate antibody binding to osteosarcoma cells can be blocked by excess amount of OSP-1 peptide.
CONCLUSION
In conclusion, the novel linear 12-mer peptide OSP-1 demonstrated the significant ability to bind to osteosarcoma. Due to its high and specific binding to osteosarcoma cells in vitro and in vivo, OSP-1 can be used for coupling with radioactive isotopes, fluorescence and anticancer agents and has potential to be used for diagnosis and treatment of osteosarcoma.
Statement of Translational Relevance.
Osteosarcoma is the most common non-hematologic primary malignant neoplasm of the bone and the disease is mainly developed in young patients between 10 and 25 years old. Early detection and differentiation of osteosarcoma from osteoid osteoma, aneurysmal bone cyst, infectious or inflammatory processes would be of great help for better control of this malignant disease. In this study, we performed in vitro peptidic phage screening and identified a new 12-mer peptide (OSP-1) with high binding affinity to osteosarcoma cells. 18F-labeled OSP-1 allowed successful noninvasive positron emission tomography (PET) imaging of osteosarcoma tumors in athymic nude mice model, indicating OSP-1 imaging as a promising strategy for early detection of osteosarcoma.
Supplementary Material
Acknowledgments
This research was supported by the Intramural Research Program of the National Institute of Biomedical Imaging and Bioengineering (NIBIB), National Institutes of Health (NIH). We thank Dr. Henry S. Eden for proof-reading the manuscript.
References
- 1.Lamoureux F, Trichet V, Chipoy C, Blanchard F, Gouin F, Redini F. Recent advances in the management of osteosarcoma and forthcoming therapeutic strategies. Expert Rev Anticancer Ther. 2007;7:169–81. doi: 10.1586/14737140.7.2.169. [DOI] [PubMed] [Google Scholar]
- 2.Espey DK, Wu XC, Swan J, Wiggins C, Jim MA, Ward E, et al. Annual report to the nation on the status of cancer, 1975–2004, featuring cancer in American Indians and Alaska Natives. Cancer. 2007;110:2119–52. doi: 10.1002/cncr.23044. [DOI] [PubMed] [Google Scholar]
- 3.Scotlandi K, Picci P, Kovar H. Targeted therapies in bone sarcomas. Curr Cancer Drug Targets. 2009;9:843–53. doi: 10.2174/156800909789760410. [DOI] [PubMed] [Google Scholar]
- 4.Kuhelj D, Jereb B. Pediatric osteosarcoma: a 35-year experience in Slovenia. Pediatr Hematol Oncol. 2005;22:335–43. doi: 10.1080/08880010590935257. [DOI] [PubMed] [Google Scholar]
- 5.Massoud TF, Gambhir SS. Molecular imaging in living subjects: seeing fundamental biological processes in a new light. Genes Dev. 2003;17:545–80. doi: 10.1101/gad.1047403. [DOI] [PubMed] [Google Scholar]
- 6.Seung-Min L, Gil-Suk Y, Eun-Sang Y, Tae-Gyun K, In-San K, Byung-Heon L. Application of phage display to discovery of tumor-specific homing peptides: developing strategies for therapy and molecular imaging of cancer. Methods Mol Biol. 2009;512:355–63. doi: 10.1007/978-1-60327-530-9_20. [DOI] [PubMed] [Google Scholar]
- 7.Jayanna PK, Bedi D, Deinnocentes P, Bird RC, Petrenko VA. Landscape phage ligands for PC3 prostate carcinoma cells. Protein Eng Des Sel. doi: 10.1093/protein/gzq011. [DOI] [PMC free article] [PubMed] [Google Scholar]
- 8.Enback J, Laakkonen P. Tumour-homing peptides: tools for targeting, imaging and destruction. Biochem Soc Trans. 2007;35:780–3. doi: 10.1042/BST0350780. [DOI] [PubMed] [Google Scholar]
- 9.Dijkgraaf I, Beer AJ, Wester HJ. Application of RGD-containing peptides as imaging probes for alphavbeta3 expression. Front Biosci. 2009;14:887–99. doi: 10.2741/3284. [DOI] [PubMed] [Google Scholar]
- 10.Niu G, Chen X. PET Imaging of Angiogenesis. PET Clin. 2009;4:17–38. doi: 10.1016/j.cpet.2009.04.011. [DOI] [PMC free article] [PubMed] [Google Scholar]
- 11.Guide for the Care and Use of Laboratory Animals. Washington, DC: National Academy Press; 1996. [Google Scholar]
- 12.Kelly KA, Waterman P, Weissleder R. In vivo imaging of molecularly targeted phage. Neoplasia. 2006;8:1011–8. doi: 10.1593/neo.06610. [DOI] [PMC free article] [PubMed] [Google Scholar]
- 13.Liu S, Liu Z, Chen K, Yan Y, Watzlowik P, Wester HJ, et al. (18)F-Labeled Galacto and PEGylated RGD Dimers for PET Imaging of alpha(v)beta (3) Integrin Expression. Mol Imaging Biol. 2009 doi: 10.1007/s11307-009-0284-2. [DOI] [PMC free article] [PubMed] [Google Scholar]
- 14.Liu Z, Niu G, Wang F, Chen X. (68)Ga-labeled NOTA-RGD-BBN peptide for dual integrin and GRPR-targeted tumor imaging. Eur J Nucl Med Mol Imaging. 2009;36:1483–94. doi: 10.1007/s00259-009-1123-z. [DOI] [PubMed] [Google Scholar]
- 15.Bratkovic T. Progress in phage display: evolution of the technique and its application. Cell Mol Life Sci. 67:749–67. doi: 10.1007/s00018-009-0192-2. [DOI] [PMC free article] [PubMed] [Google Scholar]
- 16.Sanderson RD, Yang Y, Kelly T, MacLeod V, Dai Y, Theus A. Enzymatic remodeling of heparan sulfate proteoglycans within the tumor microenvironment: growth regulation and the prospect of new cancer therapies. J Cell Biochem. 2005;96:897–905. doi: 10.1002/jcb.20602. [DOI] [PubMed] [Google Scholar]
- 17.Sasisekharan R, Moses MA, Nugent MA, Cooney CL, Langer R. Heparinase inhibits neovascularization. Proc Natl Acad Sci U S A. 1994;91:1524–8. doi: 10.1073/pnas.91.4.1524. [DOI] [PMC free article] [PubMed] [Google Scholar]
- 18.Lamoureux F, Picarda G, Garrigue-Antar L, Baud’huin M, Trichet V, Vidal A, et al. Glycosaminoglycans as potential regulators of osteoprotegerin therapeutic activity in osteosarcoma. Cancer Res. 2009;69:526–36. doi: 10.1158/0008-5472.CAN-08-2648. [DOI] [PubMed] [Google Scholar]
Associated Data
This section collects any data citations, data availability statements, or supplementary materials included in this article.


