

Abstract
Objectives
The use of biologics such as infliximab has dramatically improved the treatment of rheumatoid arthritis (RA). However, factors predictive of therapeutic response need to be identified. A proteomic study was performed prior to infliximab therapy to identify a panel of candidate protein biomarkers of RA predictive of treatment response.
Methods
Plasma profiles of 60 RA patients (28 non-responders ACR 20 negative and 32 responders ACR 70 positive to infliximab) were studied by SELDI-TOF-MS technology on two types of arrays, an anion exchange array (SAX2) and a nickel affinity array (IMAC3-Ni). Biomarker characterization was carried out using classical biochemical methods (purification by ammonium sulfate precipitation or metal affinity chromatography) and identification by MALDI-TOF analysis.
Results
Two distinct protein profiles were observed on both arrays and several proteins were differentially expressed in both patient populations. Five proteins at 3.86, 7.77, 7.97, 8.14 and 74.07 kDa were overexpressed in the non-responder group, whereas one at 28 kDa was increased in the responder population (sensitivity > 56%, specificity > 77.5%). Moreover combination of several biomarkers improved both the sensitivity and specificity of the detection of patient response to over 97%. The 28 kDa protein was characterized as apolipoprotein A-I and the 7.77 kDa biomarker was identified as platelet factor 4.
Conclusions
We characterized six plasma biomarkers, enabling the detection of patient response to infliximab with high sensitivity and specificity. Apolipoprotein A-1 was predictive of a good response to infliximab, whereas platelet factor 4 was associated with non-responders.
Keywords: Adult; Aged; Antibodies, Monoclonal; therapeutic use; Antirheumatic Agents; therapeutic use; Apolipoprotein A-I; blood; Arthritis, Rheumatoid; blood; drug therapy; Biological Markers; blood; Drug Monitoring; methods; Female; Humans; Male; Middle Aged; Platelet Factor 4; blood; Prognosis; Proteomics; methods; Sensitivity and Specificity; Spectrometry, Mass, Matrix-Assisted Laser Desorption-Ionization; methods; Treatment Outcome
Keywords: rheumatoid arthritis, SELDI-TOF-MS, infliximab, biomarkers, treatment response
Prevalence of rheumatoid arthritis (RA) varies between 0.3 and 0.8% in European countries.[1] Joint invasion and destruction are mainly mediated by inflammatory cells, cytokines and proteolytic enzymes. The heterogeneity of pathological manifestations, disease course, and response to treatments suggests that several subtypes of RA exist, especially at a molecular level.
Early referral, diagnosis and initiation of treatments to control tissue damage and structural progression are highly recommended, considering the disease’s high propensity towards joint destruction, even during periods of clinical remission.[2] Although classical treatments are still used [3, 4], a radical new approach to RA treatment is now available with the use of the biological therapies, such as tumor necrosis factor α (TNFα) inhibitors (etanercept, infliximab, adalimumab), anti-CD20 antibodies (rituximab), interleukin-1 (IL-1) receptor antagonists (anakinra) and an inhibitor of T lymphocyte costimulation (abatacept). Almost 70% of treated patients respond to these therapies, but for unknown reasons, approximately one-third of RA patients do not respond [5]. Indeed, the currently used markers reflecting bone and cartilage turnover [6] are few and inaccurate, and no predictive factor of treatment resistance has been identified. Discovery of biomarkers for diagnosis, prognosis and disease monitoring [7] is necessary.
In order to identify proteins predictive of a treatment response, we chose to study the plasma proteome (i.e. the whole protein content) of RA patients by the technology SELDI-TOF-MS (Surface Enhanced Laser Desorption/Ionization – Time Of Flight Mass Spectrometry) developed by Ciphergen Biosystems, Inc..[8, 9] This method has allowed characterization of numerous biomarkers for many diseases [10–12], particularly cancer.[13–16]
Concerning RA, a first SELDI-based study on 12 synovial fluid samples characterized an RA biomarker absent in osteoarthritis patients, the pro-inflammatory S100A8 protein.[17] More recently the same protein was identified in a larger survey comparing serum protein profiles of RA and non-inflammatory control samples.[18]
In our study, we used this SELDI-TOF-MS technology to characterize biomarkers predictive of an anti-TNFα therapy response in RA patients. Protein profiles were performed on plasma specimens taken prior to the start of infliximab treatment, from patients that were further evaluated as non-responders (ACR 20 negative) or responders (ACR 70 positive) to the therapy. Several biomarkers were isolated and were highly correlated with the infliximab response both independently or when associated in a decision tree algorithm. Moreover, corresponding proteins were identified using classical biochemistry techniques.
PATIENTS AND METHODS
Patients and study protocol
Patients with a RA diagnosis according to ACR (American College of Rheumatology) criteria were recruited in four university hospitals from the Rhône-Alpes area. All patients had disease duration of at least 6 months, had never received anti-TNFα therapy before inclusion and had no active or latent bacterial, fungal or viral infection at the time of enrolment. Blood was withdrawn on a spray-coated K2EDTA tube before the first infliximab infusion and plasma aliquots were stored at −80°C. Patients then received the same infliximab treatment as previously described [19] and clinical outcome was assessed at week 30. Among the 60 recruited patients, 28 were ACR 20 negative (non-responders), whereas 32 were ACR 70 positive (responders). Differences between both populations of each classical parameter measured at inclusion were evaluated with the Mann-Whitney U-test or the Chi2 test.
Proteomic analysis
The plasma protein profile was investigated with the SELDI-TOF-MS method developed by Ciphergen Biosystems, Inc (Fremont, CA), that associates a first phase of protein fractionation on chips with distinct chromatographic surfaces (cationic, anionic, hydrophobic…) to a second detection step of protein molecular weight by mass spectrometry after laser desorption. We used an anion exchange array (SAX2) and a nickel affinity chip (IMAC3-Ni). Firstly, the sample protein concentration was evaluated using the Bradford method.[20] For the SAX2 array, 5 μl of plasma diluted to a final concentration of 0.7 μg/μl in a washing/loading buffer (10 mM Tris, 0.1% Triton X100 pH 7) was loaded twice in duplicate for a 30 min incubation period at room temperature. Then spots were washed twice with 5 μl of washing buffer, twice with 5 μl of the same buffer without Triton X100 and finally with 5 μl of 10 mM Hepes pH 7. For the IMAC-Ni array, 20 μl of plasma was mixed with 30 μl of a denaturation buffer (50 mM Tris, 8 M urea, 1% CHAPS pH 7.4) for 15 min at +4°C with frequent agitations, and 5 μl of this protein solution diluted in the washing/loading buffer (PBS, 0.5 M NaCl, 0.1% Triton X100 pH 7.3) to 0.7 μg/μl was applied on each spot previously activated with 100 mM NiSO4. Incubation and washing steps were performed as previously described, using the IMAC3 buffer with (first two washes) or without Triton X100 (last two washes). Then 0.8 μl of saturated sinapinic acid in 0.5% trifluoroacetic acid, 50% acetonitrile was applied twice on each spot and chips were analyzed on the ProteinChip® reader (model PBSII). Mass data processing was performed with the Ciphergen ProteinChip® software 3.1 and intensities, (height from baseline), of characterized proteins were compared in each group using the Mann-Whitney U-test. ROC (Receiver Operating Characteristic) curve analyses were performed to measure the diagnostic potential of each biomarker and correlations between variables (biomarkers and clinical data) were evaluated using the Spearman rank test. Finally, CART (Classification and Regression Tree) analysis allowed data classification in a tree-like structured decision diagram.[21]
Protein purification and identification
Apolipoprotein A-I was purified from 300 μl of responder plasma by protein precipitation with 50% ammonium sulfate. After centrifugation at 14000 g for 10 min, 5 μl of supernatant (6.35 μg) was loaded on a 15% SDS-PAGE gel which was further stained with Coomassie blue R-250. The only band revealed at about 28 kDa was excised from the gel, trypsin-digested and sequenced by LC-MSMS (liquid chromatography-tandem mass spectrometry).
Platelet factor 4 (PF4) was purified from 5.2 ml of non-responder plasma on a cobalt-based affinity resin. After washings, the matrix-bound proteins were desorbed with 6 ml PBS 1X containing 20 mM imidazole and 0.5 M NaCl. This specific eluate was dialyzed overnight in distilled water, lyophilized and the resuspended powder was finally loaded on an 18% SDS-PAGE gel. A thick Coomassie blue R-250 stained band between 6 kDa and 14 kDa was sequenced by LC-MSMS as previously described. As results were not conclusive, we set up an ELISA for platelet factor 4 in order to deplete the column specific eluate from the 7,769 Da biomarker. Then 100 μl of eluate diluted twice in 2% bovine serum albumin (BSA) was incubated on a 96-well plate for 2 h at room temperature in wells previously coated with 1, 2 or 10 μg of monoclonal anti-human PF4 antibody (R&D Systems, Lille, France). Next 2 μl of supernatant was loaded on a normal phase NP20 chip which was analyzed on the ProteinChip® reader. Results were expressed as a ratio of the intensity of the 7,769 Da peak to the BSA peak value in order to overcome possible loading discrepancies and significance was assessed using the Wilcoxon test.
RESULTS
Blood protein profiles of RA patients before the start of infliximab treatment
Characteristics of enrolled patients are summarized in table 1. Both populations were similar in terms of patient identity (age and sex), RA characteristics (disease duration, number of swollen and tender joints) and biological parameters such as rheumatoid factor (RF), C-reactive protein (CRP) and erythrocyte sedimentation rate (ESR), demonstrated that in this panel as well as in general RA population, no classical marker of RA severity and aggressiveness could predict the patient response to an anti-TNFα therapy.
Table 1.
Demographic characteristics of patients at inclusion
| Group characteristics | ACR 20 negative | ACR 70 positive |
|---|---|---|
| Number | 28 | 32 |
| Age (years) | 53 (37.7–61.3) | 58 (31–78.15) |
| Women (%) | 78 | 90 |
| Disease duration (years) | 11,5 (5–31.45) | 12.5 (4.95–28.9) |
| RF positive (%) | 75 | 95 |
| CRP level (mg/liter) | 25.65 (0.85–58.05) | 13.5 (2.85–45.1) |
| ESR (mm first hour) | 34 (7.4–76.35) | 34 (15.9–78.4) |
| Number tender joints | 11 (3.55–21) | 13 (5.75–27) |
| Number swollen joints | 4.5 (0.85–10) | 6 (0.95–14) |
Values correspond to medians + 5th and 95th percentiles, except for sex and RF expressed as percentages. RF = Rheumatoid Factor; CRP = C-Reactive Protein; ESR = Erythrocyte Sedimentation Rate.
Two distinct protein profiles were obtained through plasma analysis on the SAX2 and IMAC-Ni arrays (fig 1A&B). Moreover, duplicate loadings of samples showed a similar protein pattern, characterizing the reproducibility of our experimental procedure (data not shown). Several proteins were found to be differentially expressed in both patient populations: only one small protein at 3.86 kDa was characterized on the SAX2 anion exchange array whereas five distinct markers at 7.77, 7.97, 8.21, 28.0 and 74.07 kDa were identified from the IMAC-Ni affinity array (table 2). All biomarkers were significantly increased in the non-responder population, except the 28.0 kDa protein which was overexpressed in responders, and they discriminated both populations with an overall high specificity (>77.5%), a lower sensitivity (>56%) and an AUC ranging from 0.761 to 0.846, depending on the biomarkers. Correlation analyses between the six biomarkers showed that only the 3 proteins around 8 kDa isolated on IMAC-Ni were strongly positively related: 7.77 and 7.97 (r=0.587, p<0.0001), 7.77 and 8.21 (r=0.597, p<0.0001), and 7.97 and 8.14 (r= 0.869, p<0.0001).
Figure 1. Representative SELDI-TOF-MS plasma profiles on SAX2 and IMAC3-Ni arrays.
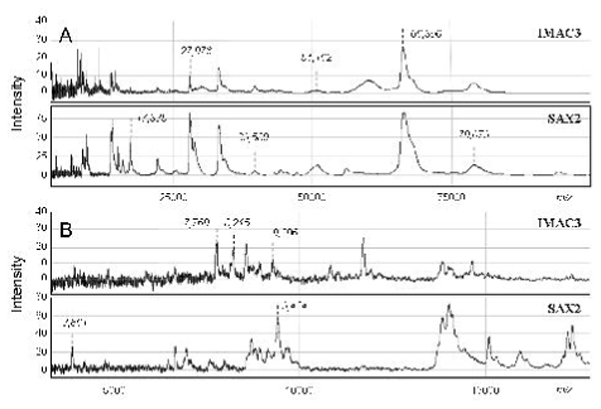
Plasma proteome of RA patients was analyzed by SELDI-TOF-MS with different laser intensities to characterize large (A) and smaller (B) proteins. Spectra showed relative intensity of each protein according to its mass/charge (m/z) value. Some peak intensities are marked in italic typing.
Table 2.
Characterization of plasma biomarkers for infliximab treatment response in RA
| Marker (kDa) | Peak intensity (mean ± SD) |
p | Cut-off | AUC | Spec (%) | Sens (%) | |
|---|---|---|---|---|---|---|---|
| NR group | R group | ||||||
| SAX 2 | |||||||
| 3.86 | 17.22 ± 7.23 | 8.37 ± 3.30 | 0.0000004 | 13.14 | 0.846 | 82.5 | 77 |
| IMAC3-Ni | |||||||
| 7.77 | 20.50 ± 8.69 | 11.05 ± 6.23 | 0.000005 | 16.51 | 0.809 | 80 | 71 |
| 7.97 | 15.20 ± 5.94 | 9.82 ± 4.44 | 0.00002 | 12.73 | 0.785 | 80 | 71 |
| 8.21 | 17.38 ± 6.31 | 11.81 ± 4.76 | 0.00002 | 15.94 | 0.761 | 83 | 56 |
| 28.0 | 1.88 ± 0.94 | 3.74 ± 2.16 | 0.000005 | 2.39 | 0.796 | 77.5 | 82 |
| 74.07 | 8.55 ± 4.34 | 4.45 ± 3.01 | 0.000009 | 7.18 | 0.800 | 87.5 | 62 |
NR = Non-Responder; R = Responder; SD = Standard Deviation; Spec = Specificity; Sens = Sensitivity; AUC = Area Under the Curve; p was calculated using the Mann-Whitney test
The entire protein profiles of both populations were then compared in a multivariate CART analysis. The best tree, obtained with the IMAC3-Ni proteomic profile, comprises five nodes: following the path according to the node value (protein peak intensity) leads to a terminal node classifying the patient in either of the two populations. This classification tree predicts infliximab response in this population with a specificity of 97.5% and a sensitivity of 97.1% (fig 2). Combining proteomic profiles with clinical data (CRP, ESR, disease duration and number of swollen or tender joints) or using both the SAX2 and IMAC3 profiles did not improve specificity and sensitivity. Moreover three proteins of the tree at 7.77, 8.21 and 28 kDa are individually highly discriminating (table 2). Box plot representation of individual peak intensities of these proteins, showed a tiny overlap of values between both populations (fig 3A, B&C), especially for the 7.77 and 28 kDa biomarkers. We then focused on the characterization of these two biomarkers.
Figure 2. Decision tree built from IMAC3-Ni protein profile.

CART analysis was performed on the whole proteome peaks characterized on the IMAC-Ni array. The intensity (I) of each node corresponding to a protein will draw a path for each patient leading to a terminal node, classifying the patient as a responder (R) or a non-responder (NR)
Figure 3. Relative peak intensities of the 7,769 Da (A) the 8,210 (B) and the 27,976 Da biomarkers in the responder (R) and non-responder (NR) populations.

The box represents the interquartile range, the line across the box is the median and the whiskers represent the 5th and 95th percentiles.
Purification and identification of the 7.77 and 28.0 kDa biomarkers
The 28 kDa biomarker was first purified by ammonium sulfate precipitation: although part of the protein was precipitated in the pellet, a nearly pure band was recovered at about 28 kDa in the supernatant as shown on an SDS-PAGE gel (fig 4A). Loading supernatant on an IMAC3-Ni chip confirmed this protein to be the previous identified biomarker at m/z 27,976 (data not shown). Finally the sequencing of this protein by LC-MSMS identified it undoubtedly as apolipoprotein A-I (on-line table 1). Correlation analysis showed that this biomarker was independent of clinical variables.
Figure 4. Identification of the 27,976 Da and the 7,769 Da biomarkers.

(A) Proteins from a responder plasma were precipitated with 50% ammonium sulfate and after centrifugation, 1 μl of pellet (lane 2 – 42.63 μg), 5 μl of desalted supernatant (lane 3 – 6.35 μg) and 1 μl of pure plasma (lane 1 – 77.43 μg) were loaded on a 15% SDS-PAGE gel. The 28 kDa band in the supernatant (circled on the gel) was identified by LC-MSMS as apolipoprotein A-I. (B) The 7,769 Da biomarker purified on a cobalt-based IMAC was incubated with coated anti-PF4 monoclonal antibodies (1 to 10 μg/well) and after a 2 h incubation period, supernatant was loaded on an NP20 array. (C) The intensity of this protein peak (in parenthesis on spectra) normalized to the BSA signal decreased while amount of coated antibody increased (* p=0.022 calculated with the Wilcoxon’s test).
Identification of the 7.77 kDa required more steps. A first purification step on an IMAC-based column allowed the isolation in the specific eluate of one main protein at m/z 7,769 contaminated by faint amounts of 3 proteins between 8 and 9 kDa, as characterized on the IMAC-Ni and NP20 arrays (data not shown and fig 4B). Fractioning this sample on an SDS-PAGE revealed a thick band around 8 kDa that was sequenced by LS-MSMS: several proteins were characterized, among which platelet factor 4 (PF4, or CXCL4) was the most represented (on-line table 2). Based on previous studies identifying this 7,769 Da protein as mature PF4 (without the first 31 amino acids of the signal peptide) [22, 23], we tried to deplete the column eluate from the biomarker with a homemade PF4 ELISA. The decrease of the peak intensity in the supernatant after incubation with anti-PF4 antibodies, evaluated on an NP20 array, was proportional to the increase of the amount of antibodies coated in the wells (fig 4B), with a significant 44% reduction of the signal for the highest antibody concentration (fig 4C). This last experiment formally identified the 7.77 kDa biomarker as platelet factor 4. As previously, this biomarker was not correlated to the clinical parameters.
DISCUSSION
In this study with SELDI-TOF-MS we characterized several biomarkers closely correlated to the response to infliximab therapy in RA patients. Although other clinical and biological parameters such as number of inflamed joints, HLA haplotypes or CRP level, can partially predict treatment efficiency [7], this is the first time to our knowledge that biomarkers with specificity as high as 87.5% independently and 97.5% when associated in a classification tree, have been determined. Indeed, these prediction characteristics were obtained for the discrimination of two extreme patient groups (ACR 20 negative and ACR 70 positive) and it is likely that specificity and sensitivity of these biomarkers will be lower when used on a more homogeneous RA population. Six biomarkers between 3.86 and 74.07 kDa were isolated on two chromatographic surfaces, suggesting different reactivities of these proteins. The smallest one at 3.86 kDa was characterized on an anion array, meaning that this protein is negatively charged at pH 7. The other 5 biomarkers isolated on an IMAC-Ni chip have a specific affinity for this metallic ion. Three of these proteins were also recovered in the classification tree built from the IMAC-Ni plasma profile, emphasising their importance in the determination of the infliximab response.
We focused initially on the 28 kDa protein that is overexpressed in the responder population and is also the first node of the decision tree, and we identified it as apolipoprotein A-I. Apolipoprotein A-I is the major protein component of HDL (High Density Protein) particles and the primary acceptor for cholesterol in extra-hepatic tissues. In RA, several studies have reported a decrease of circulating levels of apolipoprotein A-I and HDL-cholesterol in patients compared to the general population [24–26], and concentration of both parameters increases significantly in patients responding to a DMARD (Disease-Modifying Anti-Rheumatic Drug) treatment compared to non-responders.[27] On the other hand, apolipoprotein A-I was highly expressed in inflamed RA synovial tissues particularly in perivascular areas containing infiltrated T cells and macrophages, but was not detected in normal tissue [28] or in the synovium of non-inflammatory RA.[29] Moreover, increased levels of apolipoprotein A-I and cholesterol have been measured in RA synovial fluid.[30] As apolipoprotein A-I was reported to inhibit the synthesis of the major inflammatory cytokines TNFα and interleukin-1β by blocking direct contact between T lymphocytes and monocytes [31], increased levels of this protein in synovial tissue could modulate inflammation and disease evolution by controlling interactions between immune cells and then cytokine production.[28, 32] This specific function as a “negative” acute phase protein is also emphasised in a study reporting that patients with lower levels of apolipoprotein A-1 develop more systemic inflammatory response syndrome criteria.[33]
Finally, it has been recently shown in a retrospective study among blood donors (n=1078) who later developed RA (n=79) that the lipid profile was perturbed at least 10 years prior to the onset of symptoms, especially the HDL-cholesterol value that was significantly decreased.[34] The authors suggested that this specific lipid profile may be favourable to the onset of RA or the presence of a constant high inflammatory state due to low levels of HDL-cholesterol. In our study, we demonstrated that high pre-treatment levels of apolipoprotein A-I were predictive of a good response to infliximab. This increased initial concentration may favour the response to anti-TNFα treatment, via the decrease of chronic inflammation, by inhibiting cytokine release and potentiating the efficiency of therapy in a synergistic way.
The second biomarker we focused on was overexpressed in non-responder patients and was identified as platelet factor 4 (PF4) (or CXCL4). This chemokine specific for platelet α-granules exerts multiple functions in several physiological processes.[35] In RA, several studies reported an increase of PF4 in patient synovial fluid [36, 37] and elevated plasma levels in patients with cutaneous vasculitis.[38] In our study, the increase in plasma PF4 was correlated to a non-response to infliximab, and the same rise was recently shown in sera of Crohns disease patients who had not responded to infliximab therapy.[39] Two of its coagulation-unrelated functions may explain this result: PF4 was reported to induce degranulation of TNFα-primed neutrophils [40] and to inhibit monocyte apoptosis.[41] A high PF4 concentration may increase the inflammatory response by potentiating the pro-inflammatory functions of neutrophils and monocytes, that may counteract the efficiency of an anti-TNFα therapy.
In this proteomic study that investigated the plasma protein profile of RA patients who were either responders or non-responders to infliximab therapy, we identified two biomarkers (apolipoprotein A-I and PF4) that may be key elements for RA treatment monitoring. Firstly, these proteins are involved in RA physiopathology and may be associated with specific clinical situations such as inflammation or vasculitis and secondly, both are strongly correlated with and without clinical response to infliximab treatment. However, these biomarkers need to be validated in a larger cohort of patients and to be evaluated for determination of intermediate treatment response assessed by the ACR score (ACR50) or more linearly by the Disease Activity Score (DAS) 28 index. The identification of the other biomarkers is currently under investigation.
Acknowledgments
This work was supported by grants from the “Ministère de l’Enseignement Supérieur et de la Recherche”, the “Région Rhône-Alpes”, Joseph Fourier University, the GEFLUC (department of Grenoble), the “Fondation pour la Recherche Médicale”, the “Direction Régionale de la Recherche Clinique” (CHU Grenoble) and the “Ligue Nationale contre le Cancer”.
APPENDIX
The corresponding author has the right to grant on behalf of all authors and does grant on behalf of all authors, an exclusive licence on a worldwide basis to the BMJ Publishing Group Ltd to permit this article (if accepted) to be published in ARD and any other BMJPGL products and sublicences such use and exploit all subsidiary rights, as set in our licence.
References
- 1.Roux CH, Saraux A, Le Bihan E, Fardellone P, Guggenbuhl P, Fautrel B, et al. Rheumatoid arthritis and spondyloarthropathies: geographical variations in prevalence in France. J Rheumatol. 2007;34:117–22. [PubMed] [Google Scholar]
- 2.Molenaar ETH, Voskuyl AE, Dinant HJ, Bezemer PD, Boers M, Dijkmans BAC. Progression of radiologic damage in patients with rheumatoid arthritis in clinical remission. Arthritis Rheum. 2004;50:36–42. doi: 10.1002/art.11481. [DOI] [PubMed] [Google Scholar]
- 3.Le Loet X, Berthelot JM, Cantagrel A, Combe B, De Bandt M, Fautrel B, et al. Clinical practice decision tree for the choice of the first disease modifying antirheumatic drug for very early rheumatoid arthritis: a 2004 proposal of the French Society of Rheumatology. Ann Rheum Dis. 2006;65:45–50. doi: 10.1136/ard.2005.035436. [DOI] [PMC free article] [PubMed] [Google Scholar]
- 4.American College of Rheumatology Subcommittee on Rheumatoid Arthritis Guidelines. Guidelines for the management of rheumatoid arthritis: 2002 update. Arthritis Rheum. 2002;46:328–46. doi: 10.1002/art.10148. [DOI] [PubMed] [Google Scholar]
- 5.Kievit W, Fransen J, Oerlemans AJ, Kuper HH, van de Laar MA, de Rooij DR, et al. The efficacy of anti-TNF in rheumatoid arthritis, a comparison between randomized controlled trials and clinical practice. Ann Rheum Dis. 2007;66:1473–8. doi: 10.1136/ard.2007.072447. [DOI] [PMC free article] [PubMed] [Google Scholar]
- 6.Garnero P, Landewe R, Boers M, Verhoeven A, van der Linden S, Christgau S, et al. Association of baseline levels of markers of bone and cartilage degradation with long-term progression of joint damage in patients with early rheumatoid arthritis. Arthritis Rheum. 2002;46:2847–56. doi: 10.1002/art.10616. [DOI] [PubMed] [Google Scholar]
- 7.Morel J, Combe B. How to predict prognosis in early rheumatoid arthritis. Best Pract Res Clin Rheumatol. 2005;19:137–46. doi: 10.1016/j.berh.2004.08.008. [DOI] [PubMed] [Google Scholar]
- 8.Seibert V, Wiesner A, Buschmann T, Meuer J. Surface-enhanced laser desorption ionization time-of-flight mass spectrometry (SELDI TOF-MS) and ProteinChip® technology in proteomics research. Pathol Res Pract. 2004;200:83–94. doi: 10.1016/j.prp.2004.01.010. [DOI] [PubMed] [Google Scholar]
- 9.Vorderwulbecke S, Cleverley S, Weinberger SR, Wiesner A. Protein quantification by the SELDI-TOF-MS-based ProteinChip® system. Nature Methods. 2005;2:393–5. [Google Scholar]
- 10.Hodgetts A, Levin M, Kroll JS, Langford PR. Biomarker discovery in infectious diseases using SELDI. Future Microbiol. 2007;2:35–49. doi: 10.2217/17460913.2.1.35. [DOI] [PubMed] [Google Scholar]
- 11.Davidsson P, Sjögren M. Proteome studies of CSF in AD patients. Mech Ageing Dev. 2006;127:133–7. doi: 10.1016/j.mad.2005.09.021. [DOI] [PubMed] [Google Scholar]
- 12.Vanhoutte KJ, Laarakkers C, Marchiori E, Pickkers P, Wetzels JF, Willems JL, et al. Biomarker discovery with SELDI-TOF MS in human urine associated with early renal injury: evaluation with computational analytical tools. Nephrol Dial Transplant. 2007;22:2932–43. doi: 10.1093/ndt/gfm170. [DOI] [PubMed] [Google Scholar]
- 13.Zhang Z, Bast RC, Yu Y, Li J, Sokoll LJ, Rai AJ, et al. Three biomarkers identified from serum proteomic analysis for the detection of early stage ovarian cancer. Cancer Res. 2004;64:5882–90. doi: 10.1158/0008-5472.CAN-04-0746. [DOI] [PubMed] [Google Scholar]
- 14.Clarke CH, Buckley JA, Fung ET. SELDI-TOF-MS proteomics of breast cancer. Clin Chem Lab Med. 2005;43:1314–20. doi: 10.1515/CCLM.2005.225. [DOI] [PubMed] [Google Scholar]
- 15.Mueller J, von Eggeling F, Driesch D, Schubert J, Melle C, Junker K. ProteinChip technology reveals distinctive protein expression profiles in the urine of bladder cancer patients. Eur Urol. 2005;47:885–93. doi: 10.1016/j.eururo.2005.02.016. [DOI] [PubMed] [Google Scholar]
- 16.Seibert V, Ebert MP, Buschmann T. Advances in clinical cancer proteomics: SELDI-TOF-mass spectrometry and biomarker discovery. Brief Funct Genomic Proteomic. 2005;4:16–26. doi: 10.1093/bfgp/4.1.16. [DOI] [PubMed] [Google Scholar]
- 17.Uchida T, Fukawa A, Uchida M, Fujita K, Saito K. Application of a novel protein biochip technology for detection and identification of rheumatoid arthritis biomarkers in synovial fluid. J Proteome Res. 2002;1:495–9. doi: 10.1021/pr025531w. [DOI] [PubMed] [Google Scholar]
- 18.De Seny D, Fillet M, Meuwis MA, Geurts P, Lutteri L, Ribbens C, et al. Discovery of new rheumatoid arthritis biomarkers using the surface-enhanced laser desorption/ionization time-off-light mass spectrometry proteinchip approach. Arthritis Rheum. 2005;52:3801–12. doi: 10.1002/art.21607. [DOI] [PubMed] [Google Scholar]
- 19.Marotte H, Pallot-Prades B, Grange L, Tebib J, Gaudin P, Alexandre C, et al. The shared epitope is a marker of severity associated with selection for, but not with response to, infliximab in a large rheumatoid arthritis population. Ann Rheum Dis. 2006;65:342–7. doi: 10.1136/ard.2005.037150. [DOI] [PMC free article] [PubMed] [Google Scholar]
- 20.Bradford MM. A rapid and sensitive method for the quantification of microgram quantities of protein utilizing the principle of protein dye binding. Anal Biochem. 1976;72:248–54. doi: 10.1006/abio.1976.9999. [DOI] [PubMed] [Google Scholar]
- 21.Breiman L, Freidman JH, Olshen RA, Stone CJ. Classification and regression trees. New York: Chapman and Hall; 1984. [Google Scholar]
- 22.Vermeulen R, Lan Q, Zhang L, Gunn L, McCarthy D, Woodbury RL, et al. Decreased levels of CXC-chemokines in serum of benzene-exposed workers identified by array-based proteomics. Proc Natl Acad Sci USA. 2005;102:17041–6. doi: 10.1073/pnas.0508573102. [DOI] [PMC free article] [PubMed] [Google Scholar]
- 23.Lam YW, Mobley JA, Evans JE, Carmody JF, Ho SM. Mass profiling-directed isolation and identification of a stage-specific serologic protein biomarker of advanced prostate cancer. Proteomics. 2005;5:2927–38. doi: 10.1002/pmic.200401165. [DOI] [PubMed] [Google Scholar]
- 24.Lakatos J, Harsagyi A. Serum total, HDL, LDL cholesterol, and triglyceride levels in patients with rheumatoid arthritis. Clin Biochem. 1988;21:93–6. doi: 10.1016/s0009-9120(88)80094-8. [DOI] [PubMed] [Google Scholar]
- 25.Doherty NS, Littman BH, Reilly K, Swindell AC, Buss JM, Anderson NL. Analysis of changes in acute-phase plasma proteins in an acute inflammatory response and in rheumatoid arthritis unsing two-dimensional gel electrophoresis. Electrophoresis. 1998;19:355–63. doi: 10.1002/elps.1150190234. [DOI] [PubMed] [Google Scholar]
- 26.Park YB, Lee SK, Lee WK, Suh CH, Lee CW, Lee CH, et al. Lipid profiles in untreated patients with rheumatoid arthritis. J Rheumatol. 1999;26:1701–4. [PubMed] [Google Scholar]
- 27.Park YB, Choi HK, Kim MY, Lee WK, Song J, Kim DK, et al. Effects of antirheumatic therapy on serum lipid levels in patients with rheumatoid arthritis: a prospective study. Am J Med. 2002;113:188–93. doi: 10.1016/s0002-9343(02)01186-5. [DOI] [PubMed] [Google Scholar]
- 28.Dayer JM. The saga of discovery of IL-1 and TNF and their specific inhibitors in the pathogenesis and treatment of rheumatoid arthritis. Joint Bone Spine. 2002;69:123–32. doi: 10.1016/s1297-319x(02)00363-9. [DOI] [PubMed] [Google Scholar]
- 29.Bresnihan B, Gogarty M, Fitzgerald O, Dayer JM, Burger D. Apolipoprotein A-I infiltration in rheumatoid arthritis synovial tissue: a control mechanism of cytokine production ? Arthritis Res Ther. 2004;6:R563–6. doi: 10.1186/ar1443. [DOI] [PMC free article] [PubMed] [Google Scholar]
- 30.Ananth L, Prete PE, Kashyap ML. Apolipoproteins A-I and B and cholesterol in synovial fluid of patients with rheumatoid arthritis. Metab Clin Exp. 1993;42:803–6. doi: 10.1016/0026-0495(93)90050-x. [DOI] [PubMed] [Google Scholar]
- 31.Hyka N, Dayer JM, Modoux C, Kohno T, Edwards CK, Roux-Lombard P, et al. Apolipoprotein A-I inhibits the production of interleukin-1β and tumor necrosis factor-α by blocking contact-mediated activation of monocytes by T lymphocytes. Blood. 2001;97:2381–9. doi: 10.1182/blood.v97.8.2381. [DOI] [PubMed] [Google Scholar]
- 32.Burger D, Dayer JM. High-density lipoprotein-associated apolipoprotein A-I: the missing link between infection and chronic inflammation ? Autoimmun Rev. 2002;1:111–7. doi: 10.1016/s1568-9972(01)00018-0. [DOI] [PubMed] [Google Scholar]
- 33.Chenaud C, Merlani PG, Roux-Lombard P, Burger D, Harbarth S, Luyasu S, et al. Low apolipoprotein A-I level at intensive care unit admission and systemic inflammatory response syndrome exacerbation. Crit Care Med. 2004;32:632–7. doi: 10.1097/01.ccm.0000114820.47460.0a. [DOI] [PubMed] [Google Scholar]
- 34.Van Halm VP, Nielen MMJ, Nurmohamed MT, van Schaardenburg D, Reesink HW, Voskuyl AE, et al. Lipids and inflammation: serial measurements of the lipid profile of blood donors who later developed rheumatoid arthritis. Ann Rheum Dis. 2007;66:184–8. doi: 10.1136/ard.2006.051672. [DOI] [PMC free article] [PubMed] [Google Scholar]
- 35.Slunggard A. Platelet factor 4: a chemokine enigma. Int J Biochem Cell Biol. 2005;37:1162–7. doi: 10.1016/j.biocel.2004.12.003. [DOI] [PubMed] [Google Scholar]
- 36.Endresen GK. Evidence for activation of platelets in the synovial fluid from patients with rheumatoid arthritis. Rheumatol Int. 1989;9:19–24. doi: 10.1007/BF00270285. [DOI] [PubMed] [Google Scholar]
- 37.Erdem H, Pay S, Musabak U, Simsek I, Dinc A, Pekel A, et al. Synovial angiostatic non-ELR CXC chemokines in inflammatory arthritides: does CXCL4 designate chronicity or synovitis? Rheumtol Int. 2007;27:969–73. doi: 10.1007/s00296-007-0317-6. [DOI] [PubMed] [Google Scholar]
- 38.Yamamoto T, Chikungo T, Tanaka Y. Elevated plasma levels of β–thromboglobulin and platelet factor 4 in patients with rheumatoid disorders and cutaneous vasculitis. Clin Rheumatol. 2002;21:501–4. doi: 10.1007/s100670200123. [DOI] [PubMed] [Google Scholar]
- 39.Meuwis MA, Fillet M, Lutteri L, Marée R, Geurts P, de Seny D, et al. Proteomics for prediction and characterization of response to infliximab in Crohn disease. Clin Biochem. doi: 10.1016/j.clinbiochem.2008.04.021. Published Online First: 6 May 2008. [DOI] [PubMed] [Google Scholar]
- 40.Kasper B, Brandt E, Bulfone-Paus S, Petersen F. Platelet factor 4 (PF-4) –induced neutrophil adhesion is controlled by src-kinases, whereas PF-4 –mediated exocytosis requires the additional activation of p38 MAP kinase and phosphatidyl 3-kinase. Blood. 2004;103:1602–10. doi: 10.1182/blood-2003-08-2802. [DOI] [PubMed] [Google Scholar]
- 41.Scheuerer B, Ernst M, Dürrbaum-Landmann I, Fleischer J, Grage-Griebenow E, Brandt E, et al. The CXC-chemokine platelet factor 4 promotes monocyte survival and induces monocyte differentiation into macrophages. Blood. 2000;95:1158–66. [PubMed] [Google Scholar]