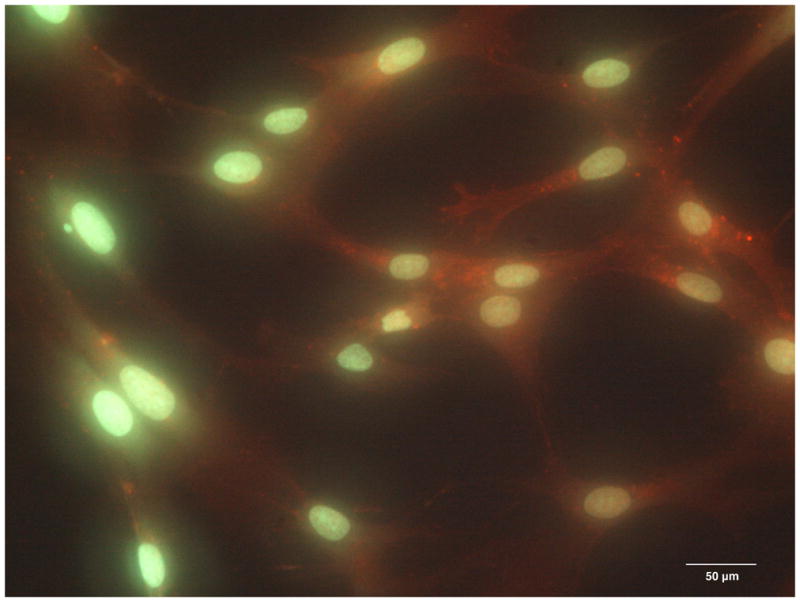
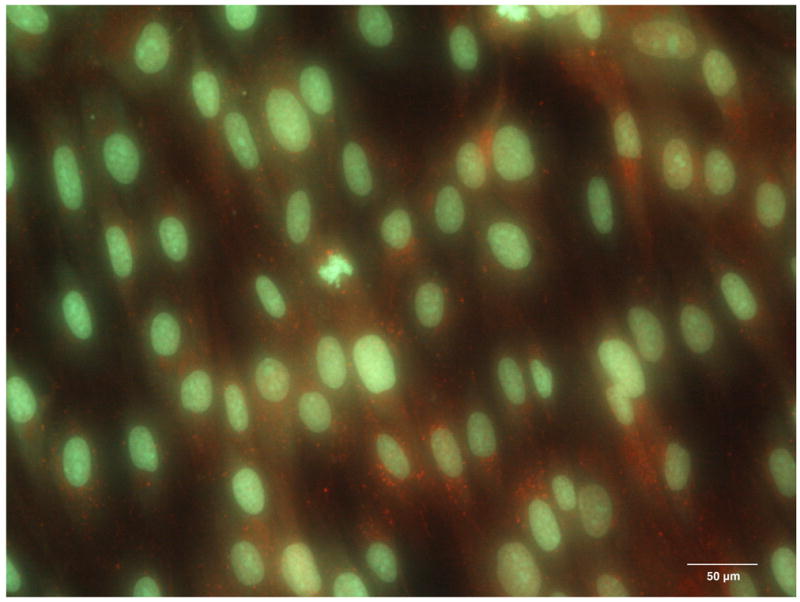
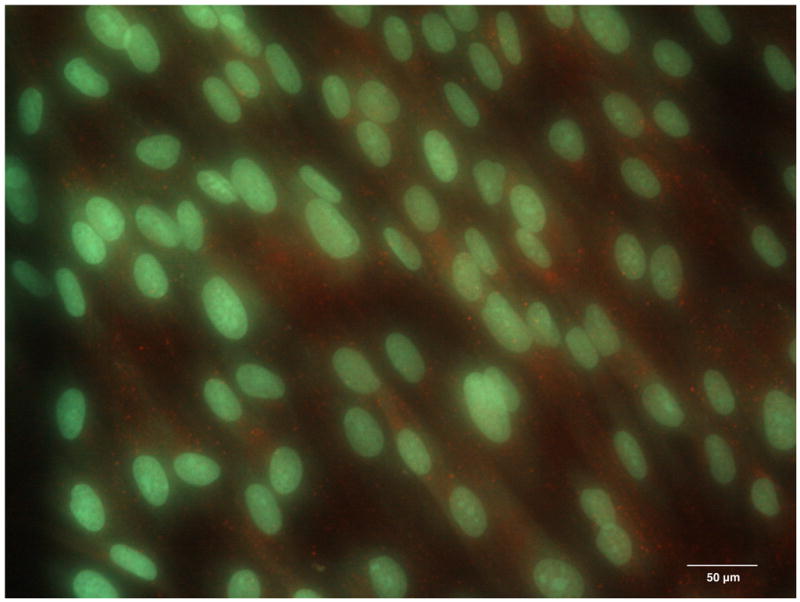
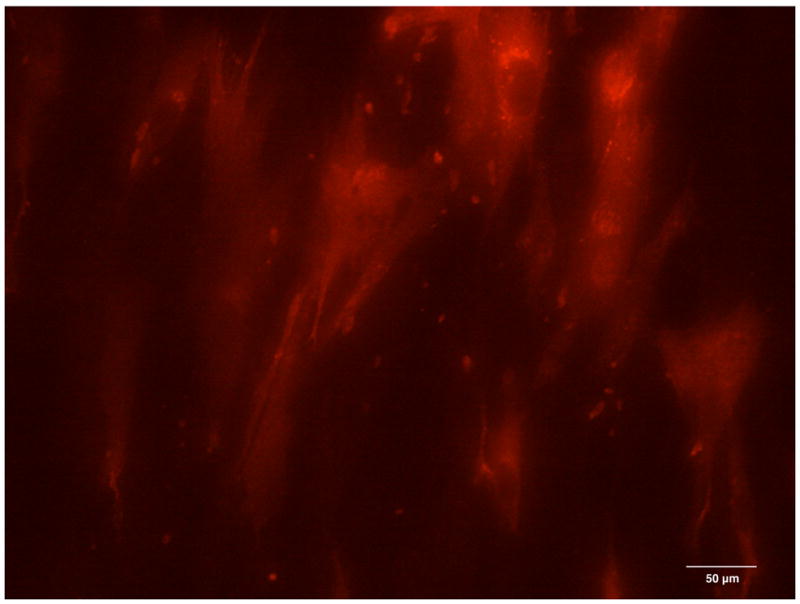
Figure 4.


The expression of Connexin 43 in the cytoplasm of the DPSC cultures on day 1 (A), day 2 (B) and day 4 (C). The expression of Connexin 43 on the surface of DPSCs on day 2 of culture (D, red channel). Red fluorescence identifies Connexin 43; green fluorescence, DPSC nuclei and cytoplasms.
