

Abstract
The mammalian cell nucleus is a dynamic and highly organized structure. Most proteins are mobile within the nuclear compartment, and this mobility reflects transient interactions with chromatin, as well as network interactions with a variety of protein partners. To study these dynamic processes in living cells, we developed an imaging method that combines the photoactivated green fluorescent protein (PA-GFP) and fluorescence resonance energy transfer (FRET) microscopy. We used this new method, photoquenching FRET (PQ-FRET), to define the dynamic interactions of the heterochromatin protein-1 alpha (HP1α) and the transcription factor CCAAT/enhancer binding protein alpha (C/EBPα) in regions of centromeric heterochromatin in mouse pituitary cells. The advantage of the PQ-FRET assay is that it provides simultaneous measurement of a protein’s mobility, its exchange within macromolecular complexes and its interactions with other proteins in the living cell without the need for corrections based on reference images acquired from control cells.
The mammalian cell nucleus is a dynamic and highly organized structure containing a nonrandom arrangement of functional chromatin domains and subcompartments formed by the self-assembly of proteins1-3. Spatial and temporal changes in distribution of nuclear proteins are known to accompany stages of cell differentiation, suggesting that nuclear organization may function to establish transcriptional networks, which yield cell-specific patterns of gene expression4. The identification of the protein-protein interaction networks that govern these processes within the context of the organized cell nucleus will be critical for understanding the control of gene expression5.
A hallmark of the interphase nucleus is constitutive heterochromatin composed of noncoding repetitive sequences that coalesce near centromeres, forming chromocenters that are identifiable in mouse cells by intense staining with DNA-binding dyes6. These regions of chromatin are marked by several different proteins, including HP1α, and are typically associated with transcriptional silencing7,8. It is surprising, then, that some transcription factors are also found associated with these intranuclear sites9-11. For example, the transcription factor C/EBPα, which has a role in the differentiation of many cell types12, localizes to regions of centromeric heterochromatin13-15. The important regulatory role of the association of transcription factors with chromocenters is suggested by changes in this pattern of localization with the cell cycle, cell signaling or stage of cell differentiation4,10-17. Kinetic microscopy techniques have shown that most proteins within the nuclear compartment are mobile, and that dynamic processes drive the assembly of metastable protein complexes at certain intranuclear sites3,8. What is needed are live-cell imaging methods that allow these dynamic protein-protein interaction networks to be visualized in their natural context within the intact cell nucleus.
To address this, we developed a cellular imaging method, which can be used to simultaneously measure the mobility of a protein, its exchange within macromolecular complexes and its interactions with protein partners. The method is based on PA-GFP, which can be switched from a dim to a bright fluorescent state when illuminated by a brief pulse of intense 400-nm light18. The activation of PA-GFP–labeled proteins in a discrete region of the cell provides a direct measure of the mobility of the labeled protein19. We have combined this approach with the technique of FRET microscopy, which provides information about the spatial relationships between proteins on the scale of angstroms. When excitation energy is transferred from a donor fluorophore to nearby acceptor fluorophores there is quenching of the donor fluorescence and sensitized emission from the acceptor20,21. Here we used PA-GFP as a photoactivatable FRET acceptor and monitored the attendant quenching of cyan fluorescent protein (CFP)-labeled donor proteins, allowing us to quantify the dynamic interactions between proteins fused to the fluorophores. We apply this approach to demonstrate for the first time the dynamic association of HP1α with C/EBPα in regions of heterochromatin. The PQ-FRET assay provides direct measurements of protein mobility, exchange and interactions within macromolecular complexes in living cells without the need for corrections based on reference images acquired from separate control cells.
RESULTS
Rationale of the PQ-FRET assay
FRET-based microscopy techniques detect the result of energy transfer between fluorophores that label proteins inside living cells. The efficient transfer of energy requires that donor and acceptor fluorophores are in close proximity (<80 Å), and that there is a substantial overlap of the donor emission and acceptor absorption spectra. This spectral overlap, however, limits FRET measurements because it contributes a substantial spectral bleed-through (SBT) background to the FRET signal. Image processing to remove the SBT background based on reference images acquired from separate control cells is commonly used to determine FRET efficiency, but these approaches vary in their accuracy22. An alternative technique, acceptor photobleaching FRET (apFRET), measures dequenching of the donor signal after selective bleaching of the acceptor to determine the proportion of donor energy that was lost to FRET20-23. Because each cell serves as its own control, apFRET does not require separate measurements from reference cells. Measurements of dynamic interactions between proteins, however, require an approach that combines both kinetic microscopy and FRET measurements.
Here we describe an approach that takes advantage of the kinetic measurements made possible by PA-GFP (Fig. 1a), and uses the activated PA-GFP as a FRET acceptor for CFP. The Förster distance (R0) for this pair, determined from their spectral overlap integral20,21, is approximately 41 Å. Upon photoactivation, PA-GFP provides an absorbing species for energy transfer, which can quench the CFP signal, with the added benefit that the use of PAGFP allows the monitoring of protein mobilities. The quenching of CFP by the activated PA-GFP (Fig. 1b) provides a measure of FRET that does not require correction for SBT. Additionally, each cell serves as its own control, allowing small changes in donor signal to be accurately measured. This new approach provides simultaneous measurement of acceptor protein mobility (diffusion of PA-GFP), exchange of the acceptor protein within macromolecular complexes containing the donor (rate of donor quenching) and the spatial relationship of the labeled proteins (amount of donor quenching).
Figure 1. Protein mobility and interactions can be measured using PA-GFP and PQ-FRET.
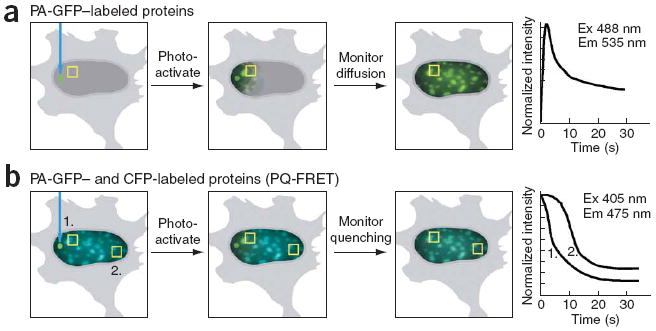
(a) The mobility of proteins labeled with PA-GFP is measured after a brief photoactivation pulse of 405-nm light delivered to a discrete spot within the cell. The diffusion of the fluorescent PA-GFP is monitored over time in an ROI, and the mobility rate is calculated. (b) For PQ-FRET, cells that coexpress PA-GFP– and CFP-labeled proteins are identified by their cyan fluorescence. PA-GFP is then photoactivated in a discrete spot using a brief pulse of 405-nm light, and diffusion of the fluorescent PA-GFP is monitored in the green channel. Simultaneously, changes in the CFP signal are monitored in the cyan channel for different ROIs (squares 1 and 2). The quenching of the CFP (donor) signal by PA-GFP (acceptor) provides a measurement of FRET, indicating interactions between the labeled proteins. The diffusion rate of the PA-GFP provides a measure of the mobility of the protein, the rate of quenching is a measure of how rapidly the acceptor protein is exchanged within the macromolecular complex, and the steady-state level of CFP quenching indicates the FRET efficiency at the particular donor:acceptor ratio.
HP1α and C/EBPα interact
When expressed alone in the mouse pituitary GHFT1 cells, both HP1α and C/EBPα accumulated in regions of centromeric heterochromatin, identified by preferential staining with the cellpermeant DNA dye H33342 (Supplementary Fig. 1 online). When we coexpressed these proteins in the same cell, they colocalized in regions of heterochromatin (Fig. 2a). To determine whether these proteins could interact as part of a common macromolecular complex, we coimmunoprecipitated HP1α fused to yellow fluorescent protein (YFP-HP1α) with hemagglutinin (HA)-tagged C/EBPα (Fig. 2b and Supplementary Fig. 2 online) and found that that two proteins coimmunoprecipitate. We next used the apFRET approach to determine whether this protein complex was present in the intact cell nucleus. As a control for specificity, we coexpressed the YFP-HP1α with the CFP-labeled promyelocytic leukemia (PML) protein, which forms distinct PML bodies in the cell nucleus24. Although there was overlap in the distribution of HP1α and PML, these proteins clearly occupied distinct subnuclear domains (Fig. 2c). We used an automated image analysis algorithm to obtain apFRET measurements from populations of cells expressing different acceptor:donor ratios. When FRET occurs, the efficiency of donor dequenching increases with increasing amounts of available acceptor until the donor population is saturated. We observed FRET between the fluorophores labeling YFP-HP1α and CFP-C/EBPα, but not between YFP-HP1α and CFP-PML, confirming the association of HP1α and C/EBPα in the living cell nucleus (Fig. 2d).
Figure 2.
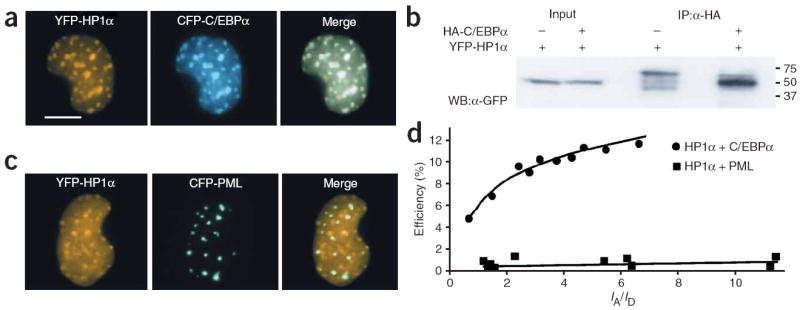
HP1α and C/EBPα interact in the nucleus of GHFT1 cells. (a) Fluorescence micrographs of the nucleus of a GHFT1 cell coexpressing YFP-HP1α and CFP-C/EBPα showing the colocalization of the two proteins in regions of heterochromatin. Scale bar, 10 μm. (b) Coimmunoprecipitation analysis of the association of HP1α and C/EBPα. The lysates from cells expressing YFP-HP1α, or YFP-HP1α and HA-C/EBPα were incubated with an HA-specific antibody conjugated to agarose beads, which were then washed and the bound proteins were eluted with denaturing sample buffer. The input lanes contain 5% of the total protein loaded in the immunoprecipitation (IP) lanes. The coimmunoprecipitated YFP-HP1α was detected by western blot (WB) using polyclonal anti-GFP (the full blot is available in Supplementary Fig. 2). (c) Fluorescence micrographs of the nucleus of a GHFT1 cell coexpressing YFP-HP1α and the control fusion, CFP-PML. (d) apFRET analysis of GHFT1 cells expressing either YFP-HP1α and CFP-C/EBPα, or YFP-HP1α and CFP-PML. Cells expressing different ratios of acceptor:donor were subjected to apFRET, and data was analyzed using an automated image analysis protocol. The average percent efficiency of donor dequenching for each cell nucleus was plotted as a function of the YFP/CFP signal intensity ratio (IA/ID).
Visualizing the intranuclear dynamics of HP1α
Previous studies used fluorescence recovery after photobleaching (FRAP) to monitor the mobility of HP1α within the living cell nucleus25. Here we determined that mobility measurements made by photoactivation of PA-GFP were comparable with those made by monitoring FRAP. After photoactivation of PA-GFP–HP1α in a discrete spot in the nucleus, there was rapid diffusion of HP1α throughout the nuclear compartment, reaching equilibrium in about 25 s (Fig. 3a,b). Then we independently measured a similar mobility for HP1α using FRAP microscopy. The halftime to steady state for fluorescence recovery was approximately 4.5 s (Fig. 3c), similar to an earlier report of the dynamic properties of HP1α25.
Figure 3.
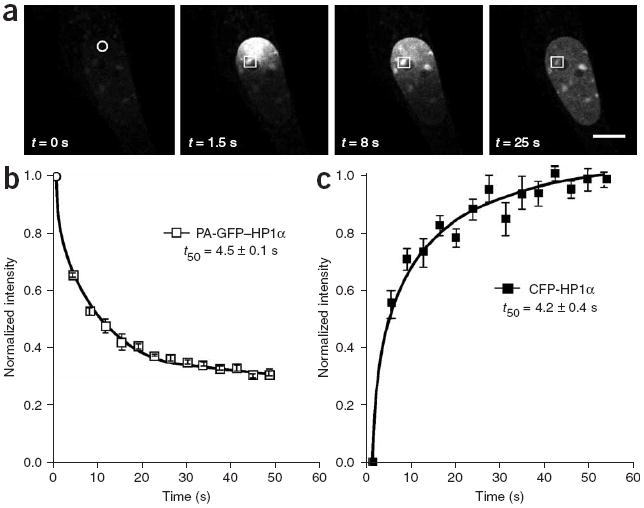
The mobility of HP1α within the nuclear compartment measured by PA-GFP and FRAP. (a) The mobility of PA-GFP–HP1α in the nucleus of a mouse GHFT1 cell was monitored after a 500-ms photoactivation pulse of 405-nm light at 135 μW laser power (circle), and is illustrated by the sequence of images showing the diffusion of PA-GFP–HP1α throughout the nucleus. Scale bar, 10 μm. (b) The diffusion rate was measured over a 50-s time frame in the indicated ROI (squares in a). The diffusion rate was measured in 5 different cells; error bars, s.e.m. (c) GHFT1 cells expressing CFP-HP1α were subjected to FRAP analysis. A 2 μm–diameter ROI in the cell nucleus was photobleached, and the recovery of CFP-HP1α fluorescence in this ROI was monitored. The plot shows the mean change in relative fluorescence intensity, normalized to the pre-bleach levels. The results are the average for five different cells. For both methods, the halftime (t50) needed for the fluorescence to either reach steady-state or recover is shown.
Direct visualization of dynamic protein interactions
The rapid mobility of HP1α (Fig. 3) and its interactions with C/EBPα (Fig. 2) suggest that these proteins associate as part of a metastable protein complex. We used the PQ-FRET method to directly measure the kinetics of the interaction between these two proteins in living cells. We selected cells that coexpressed PA-GFP– HP1α and CFP-C/EBPα based on CFP fluorescence (Fig. 4a). In these cells we then photoactivated PA-GFP–HP1α in a discrete spot and monitored the intensity of CFP-C/EBPα over time in several different regions of interest (ROIs) in the cell nucleus (Fig. 4a). After a brief delay after photoactivation (about 1, 2, and 4 s for ROI 1, 2 and 3, respectively; Fig. 4b), the CFP labeling C/EBPα was rapidly quenched by the activated PA-GFP–HP1α. The quenching of CFP measured in the different regions of the nucleus varied between 5 and 12% depending on the final ratio of PA-GFP to CFP (IA/ID) in each ROI (Fig. 4b) with a mean halftime to steady state of about 1 s. Three different parameters could be determined from these measurements. First, the diffusion rate of PA-GFP–HP1α reflects the mobility of the HP1α within the nucleus (see Fig. 3a). Second, the rate of quenching of the CFP-C/EBPα provided a measure of how rapidly the PA-GFP–HP1α exchanged with both the nonactivated PA-GFP–HP1α and the endogenous HP1 proteins. Third, the steady-state level of CFP quenching indicated the FRET efficiency at a particular donor:acceptor ratio.
Figure 4.
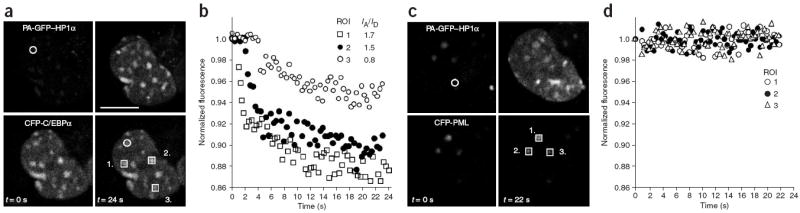
PQ-FRET is used to measure the dynamic interactions between HP1α and C/EBPα. (a) Images of GHFT1 cells coexpressing PA-GFP–HP1α and CFPC/EBPα were acquired in green (top) and cyan channels (bottom) before photoactivation (left; t = 0 s). A 500-ms activation pulse at 405 nm was delivered to a 2-μm spot (circle), and the changes in CFP intensity were then monitored in the indicated ROI (squares 1–3) during 24 s. The final images for both PA-GFP–HP1α and CFP-C/EBPα are shown (right; t = 24 s). Scale bar, 10 μm. (b) Measurement of the changes in CFP-C/EBPα fluorescence after the photoactivation of PA-GFP–HP1α, normalized to the initial levels, for the three ROIs in a. The final PA-GFP/CFP intensity ratio (IA/ID) achieved in each ROI is shown in the legend. (c) Images of GHFT1 cells coexpressing PA-GFP–HP1α and CFP-PML before (left) and after (right) photoactivation. The analysis was done as described in a. (d) Measurement of CFP-PML intensity after the photoactivation of PA-GFP–HP1α, normalized to the initial levels, for the three ROIs in c. These experiments were repeated in 10–20 different cells for each plasmid combination.
The quenching of CFP-C/EBPα by PA-GFP–HP1α was specific as we did not detect a change in the CFP signal in identically treated cells coexpressing PA-GFP–HP1α and CFP-PML (Fig. 4c,d). This confirmed the earlier apFRET measurements (Fig. 2d), and showed that CFP was not being photobleached by the repetitive scanning at low laser power. There was, however, photobleaching of CFP at the site of photoactivation by the brief photoactivation pulse from the 405 nm laser line (Supplementary Fig. 3 online). The photobleaching had no effect on the CFP signal in other regions of the nucleus, and the bleached CFP-C/EBPα at the photoactivation site recovered with a halftime of about 5 s (Supplementary Fig. 3).
The versatility of the PQ-FRET method is in the ability to measure the dynamics of protein interactions. We demonstrated this by comparing the PQ-FRET measurements of C/EBPα and HP1α (Fig. 4b) with those acquired from cells expressing the basic leucine zipper region (BZIP) of C/EBPα. The C/EBPα BZIP domain dimerizes with nanomolar affinity when bound to DNA26. When PA-GFP–C/EBP BZIP was photoactivated in cells coexpressing CFP–C/EBP BZIP, it equilibrated within the nuclear compartment within about 12 s (Fig. 5a). We monitored CFP–C/EBP BZIP in different ROIs within that cell nucleus, as well as in the nucleus of an adjacent, nonactivated cell (Fig. 5b). There was progressive quenching of the CFP signal within the nucleus of the photoactivated cell over the timeframe of 120 s, whereas no change in the CFP–C/EBP BZIP signal was detected in the nonphotoactivated cell (Fig. 5c). Despite the rapid equilibration of PA-GFP–C/EBP BZIP, the rate of CFP–C/EBP BZIP quenching was considerably slower than that measured for C/EBPα in the presence of HP1α (Fig. 4a). The quenching of CFP ranged from 16 to 26%depending on the final acceptor:donor ratio, with a halftime to steady state of about 53 s, which likely reflects the stable association of the dimerized proteins.
Figure 5.
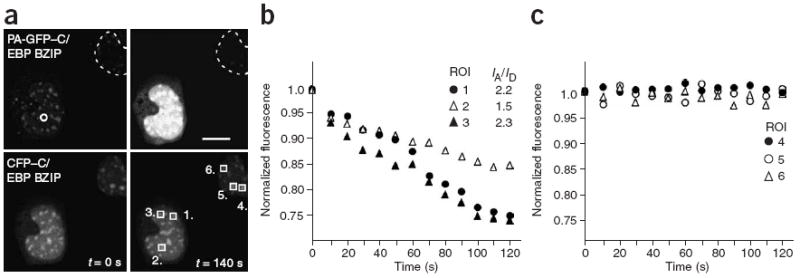
PQ-FRET is used to measure dimer formation by the C/EBP BZIP domains. (a) Images of GHFT1 cells coexpressing PA-GFP–C/EBP BZIP and CFP–C/EBP BZIP were acquired in both the green (top) and cyan (bottom) channels before photoactivation (left, t = 0 s); the dotted line indicates the nucleus of a cell not receiving an activation pulse. A 500-ms activation pulse at 405 nm was delivered to a 2-μm spot (circle), and the changes in CFP intensity were then monitored in the indicated ROIs (squares 1–3) over a 140-s time frame. The CFP intensity was also monitored in the nonactivated cell nucleus in the indicated ROIs (squares 4–6). The final images for both PA-GFP–C/EBP BZIP and CFP–C/EBP BZIP are shown (right; t = 140 s). Scale bar, 10 μm. (b) Measurement of the changes in CFP-C/EBP BZIP intensity over time, normalized to the initial levels, for the three ROIs shown in a; the final PA-GFP/CFP intensity ratio (IA/ID) achieved in each ROI is shown in the legend. (c) Quantification of the CFP–C/EBP BZIP intensity in the nonactivated cell nucleus, normalized to the initial levels, for the three ROIs shown in a.
Finally, we independently verified that the quenching of the donor-labeled proteins was the result of FRET by donor fluorescence lifetime measurements. The measurement of donor fluorescence lifetime, the average time a population of fluorophores spends in the excited state, provides one of the most direct measures of energy transfer20,21. Because energy transfer dissipates the excited-state energy of the donor, its fluorescence lifetime is shortened in the presence of acceptor. Here we used time-correlated single-photon counting fluorescence lifetime imaging microscopy (FLIM) to detect changes in donor lifetime following the photoactivation of PA-GFP. The time-domain FLIM measurements from cells expressing CFP-C/EBPα alone indicated an average fluorescence lifetime of about 2.14 ns, which was unaffected when we photoactivated these cells (Table 1). For cells that coexpressed CFP-C/EBPα and PA-GFP–HP1α, upon photoactivation of PA-GFP the mean CFP lifetime distribution shifted to shorter times (1.82 ns; Table 1 and Supplementary Fig. 4 online). Additionally, the shift to shorter donor lifetimes was more pronounced in cells that coexpressed CFP–C/EBP BZIP and PA-GFP–C/EBP BZIP (1.60 ns; Table 1 and Supplementary Fig. 4). Together, these results show the utility of the PQ-FRET method for measuring the dynamic interactions of proteins in living cells.
Table 1.
Two-component donor lifetime analysis before and after photoactivation of PA-GFP
| Expressed proteins | Number of ROIs analyzed | Donor lifetime before activation τm (ns)a | Donor lifetime after activation τm (ns) | E (%)b |
|---|---|---|---|---|
| CFP-C/EBPα | 20 | 2.14 ± 0.09 | 2.13 ± 0.10 | Not applicable |
| PA-GFP–HP1α and CFP-C/EBPα | 40 | 2.07 ± 0.16 | 1.82 ± 0.17 | 12.2 ± 1.6 |
| PA-GFP–C/EBP BZIP and CFP–C/EBP BZIP | 36 | 2.06 ± 0.09 | 1.60 ± 0.12 | 21.7 ± 3.3 |
τm, mean lifetime.
E = 1 − (τDA/τD), where E is efficiency, τDA is the donor lifetime in the presence of acceptor and τD is the donor lifetime.
DISCUSSION
Here we demonstrated a method that provides new insight into the dynamic nature of protein interaction networks in the living cell nucleus. Most chromatin-associated proteins, except the core histones, are quite mobile within the nuclear compartment (reviewed in ref. 27). The mobility of these nuclear proteins reflects their transient interactions with chromatin, as well as their network interactions with a variety of different protein partners3,27. For example, the transcription factor C/EBPα localized to regions of constitutive heterochromatin in mouse cells where it interacted with HP1α as part of a metastable protein complex. Although typically associated with transcriptional silencing7,8, a number of different transcription factors are known to preferentially localize to regions of centromeric heterochromatin4,9-17. These associations may function to establish cell-specific patterns of gene expression4,5,10.
Although C/EBP family proteins can bind directly to the repetitive DNA elements that form the chromocenters13-15, their association with the chromocenters likely involves interactions with the proteins that mark these domains, such as HP1α. In this regard the structural organization ofHP1α supports its interactions with many proteins, suggesting that it may function in the assembly of macromolecular complexes in chromatin28. The organization of chromocenters depends on the methylation of underacetylated histone tails by the Su(var)3–9 histone methyltransferase, which modifies histone H3 on lysine 9 (MeK9H3). HP1α is recruited to this epigenetic mark through the direct binding of the chromodomain to the MeK9H3 (ref. 29). Amodel to explain heterochromatin spreading has been proposed where HP1α binds to MeK9H3 and recruits Su(var)3–9, which in turn acts on adjacent histones to generate new binding sites, allowing HP1α to spread linearly along the chromatin fiber28,29. It is possible that the association of HP1α with other proteins, such as transcription factors, could function to control the spreading of these heterochromatin domains.
The dynamic association between C/EBP and HP1 was indicated by rapid quenching of CFP-C/EBP, following a brief delay after photoactivation of PA-GFP–HP1. The kinetics reflected the mobility of PA-GFP–HP1α within the three-dimensional volume of the nucleus, as well as its rapid exchange within protein complexes. These results were in striking contrast to those obtained for the C/EBP BZIP domains. Although the PA-GFP–C/EBP BZIP equilibrated even more rapidly than HP1α within the nuclear compartment, the quenching of the CFP–C/EBP BZIP was much slower. This likely reflects the slow exchange of C/EBP BZIP domain dimers within complexes as a result of the high affinity of the dimer interaction26. These results illustrate several important benefits of the PQ-FRET assay. First, unlike FRET measurements of sensitized emission from the acceptor, the detection of donor quenching does not require correction for the SBT background. Under the conditions used here, there was no detectable bleed-through of the activated PA-GFP signal into the cyan channel. Depending on the characteristics of different imaging systems, however, this background signal could become significant. Second, in contrast to photodestructive methods like apFRET, PQ-FRET uses photoactivation of the acceptor in a single discrete region of the cell, allowing the dynamic process of donor quenching to be monitored in real time in the entire compartment.
Finally, a distinct advantage of this approach is its potential application to high-throughput screening. Because the entire field of view can be photoactivated in a single excitation pulse, the technique can be used to monitor donor quenching in multiple cells. Therefore, it should be straightforward to use PQ-FRET in multiwell sample plate formats. There are several commercially available systems for high-throughput screening–compatible cellular imaging that combine high temporal resolution with high spatial resolution. These systems support autofocus to keep the microscope objective focused on the layer of cells at the bottom of the wells of the sample plates. The availability of the full spectrum of excitation wavelengths (340 nm to near-infrared) on some systems, for example, would allow the measurement of multiple fluorescent markers by taking fast sequential images at different wavelengths. This type of system could be used to automatically establish CFP levels in sample plate cultures, rapidly photoactivate the PA-GFP, and then monitor potential changes in donor fluorescence in each individual well of the sample plate. The recent report of new photoactivatable fluorescent proteins with different spectral characteristics increases the possibilities for photoquenching-based approaches30.
METHODS
Live cell microscopy, photoactivation and FRAP analysis
We transfected mouse GHFT1 cells with the indicated plasmid DNA(s) encoding the fluorescent protein–fusion proteins, and inoculated these cells into culture dishes containing 42-mm cover glass (ProSciTech). On the following day, we transferred the cover glass with the monolayer of cells to amedium-filled chamber fitted to the microscope stage. We measured the mobility of PA-GFP on a Zeiss LSM 510 confocal microscope using a 63× 1.2 numerical aperture (NA) water-immersion objective and a 25-mW diode laser generating the 405-nm line. We used a power meter to measure the laser power at the specimen plane (Model SSIM-VIS & IR; Coherent, Inc.). We identified the transfected cells by the coexpressed mRFP marker, and subjected the selected cells to 500-ms photoactivation laser pulse at 135 μW power delivered to a 2 μm–diameter spot in the cell nucleus. We monitored the diffusion of the photoactivated PA-GFP by collecting images at 1 μW laser power every 2 s using the green (excitation (ex) 488 nm, emission (em) 530–600 nm) channel. We also performed the FRAP experiments on the Zeiss LSM 510 confocal microscope using the 405-nm laser line. We collected the prebleach images at 1.5 μW laser power, followed by a 500-ms bleach pulse at 135 μW power delivered to a 2 μm–diameter spot. The shape and size of the bleached spot were kept constant for all experiments. Single images were then collected every 2 s in the cyan channel (ex 405 nm, em475 nm) using 1.5 μW laser power. We normalized the fluorescence intensity in the bleached area to the initial fluorescence; the results represent the analysis of 5–10 different cells, and we repeated each experiment at least three times.
apFRET microscopy and image analysis
We collected the apFRET data with a widefield Olympus inverted IX-70 microscope equipped with a 60× 1.2 NA water-immersion objective lens. The filter combinations were ex 500/20 nm, 515 nm beam splitter and em 535/30 for YFP, and ex 436/20 nm, 455 nm beam splitter and em 470/30 nm for CFP (Chroma Technology Corporation). We obtained the 12-bit depth images with no saturated pixels using a cooled digital interline camera (Orca-200; Hamamatsu). We used the ISee graphical software (ISee Imaging Systems) to integrate a series of computerized image analysis functions into a single algorithm that could be applied to sets of images in a consistent and unbiased way. A histogram-based statistical method was used to optimally threshold the acquired images to automatically identify the nucleus. We measured the mean intensity of a defined area outside the nucleus to define the background fluorescence and subtracted this value from each image. We then measured the mean intensity of background-subtracted nucleus ROIs for each image and exported all measurements for analysis using the Excel spreadsheet software (Microsoft). We used the software to calculate the donor:acceptor ratio and the efficiency of donor dequenching for each set of images in the population of transfected cells, and corrected for donor bleaching using data obtained from parallel experiments in cells expressing the donor alone.
Photoquenching FRET
We selected mouse GHFT1 cells coexpressing PA-GFP–HP1α with either CFP-C/EBPα or CFP-PML, or PAGFP–C/EBP BZIP with CFP–C/EBP BZIP, based on CFP fluorescence. We collected the preactivation images using both the cyan (ex 405 nm, em 475 nm) and green (ex 488 nm, em 530–600 nm) channels using approximately 1 μW laser power at the specimen plane, and adjusted the detector gain so that there were no saturated pixels in the cyan image. We delivered a 500-ms 405-nm pulse at 135 μW power to a 2 μm–diameter spot; the shape and size of the activation spot was constant for all experiments. We collected single images with the 405-nm laser line at 1.5 μW laser power every 390 ms for 20 s, or every 10 s for 150 s. Then we collected a second image in the green channel to assess PAGFP activation and determine the PA-GFP/CFP signal intensity ratio. We measured the change in CFP signal intensity over time for several different ROIs and normalized the signal to the initial fluorescence in each ROI. There was no detectable bleed-through of the GFP signal into the cyan channel when using 405-nm excitation. The individual experiments involved the analysis of 5–10 different cells, and each experiment was repeated at least three times.
Additional methods
The methods for expression plasmid construction, cell culture and transfections, immunoprecipitation, and FRET-FLIM imaging and data processing are available in Supplementary Methods online.
Supplementary Material
Acknowledgments
We thank G. Patterson and J. Lippincott-Schwartz for kindly providing the PA-GFP–C1 vector, and R. Tsien for the mRFP1 cDNA. We thank M. Logsdon for technical assistance, Y. Chen from the Keck Center for Cellular Imaging for assistance with FLIM data analysis, and F. Koberling (PicoQuant GmbH) for helpful discussion. We also thank J. Redick and C. Davis from the Advanced Microscopy Facility for help with the laser scanning confocal microscopy. This work was supported by a grant from the US National Institutes of Health (DK47301 to R.N.D.).
Footnotes
AUTHOR CONTRIBUTIONS I.A.D. and R.N.D. contributed equally to the conceptual development of and implementation of this method. C.F.B. contributed to all technical aspects of this project. A.P. developed and helped apply the fluorescence lifetime measurements.
COMPETING INTERESTS STATEMENT The authors declare that they have no competing financial interests.
Note: Supplementary information is available on the Nature Methods website.
Reprints and permissions information is available online at http://npg.nature.com/reprintsandpermissions/
References
- 1.Lamond AI, Earnshaw WC. Structure and function in the nucleus. Science. 1998;280:547–553. doi: 10.1126/science.280.5363.547. [DOI] [PubMed] [Google Scholar]
- 2.Cremer T, Cremer C. Chromosome territories, nuclear architecture and gene regulation in mammalian cells. Nat Rev Genet. 2001;2:292–301. doi: 10.1038/35066075. [DOI] [PubMed] [Google Scholar]
- 3.Misteli T. Concepts in nuclear architecture. Bioessays. 2005;27:477–487. doi: 10.1002/bies.20226. [DOI] [PubMed] [Google Scholar]
- 4.Francastel C, Magis W, Groudine M. Nuclear relocation of a transactivator subunit precedes target gene activation. Proc Natl Acad Sci USA. 2001;98:12120–12125. doi: 10.1073/pnas.211444898. [DOI] [PMC free article] [PubMed] [Google Scholar]
- 5.Remenyi A, Scholer HR, Wilmanns M. Combinatorial control of gene expression. Nat Struct Mol Biol. 2004;11:812–815. doi: 10.1038/nsmb820. [DOI] [PubMed] [Google Scholar]
- 6.Amirand C, et al. Three distinct sub-nuclear populations of HMG-I protein of different properties revealed by co-localization image analysis. J Cell Sci. 1998;111:3551–3561. doi: 10.1242/jcs.111.23.3551. [DOI] [PubMed] [Google Scholar]
- 7.Perrod S, Gasser SM. Long-range silencing and position effects at telomeres and centromeres: parallels and differences. Cell Mol Life Sci. 2003;60:2303–2318. doi: 10.1007/s00018-003-3246-x. [DOI] [PMC free article] [PubMed] [Google Scholar]
- 8.Ficz G, Heintzmann R, Arndt-Jovin DJ. Polycomb group protein complexes exchange rapidly in living Drosophila. Development. 2005;132:3963–3976. doi: 10.1242/dev.01950. [DOI] [PubMed] [Google Scholar]
- 9.Brown KE, et al. Association of transcriptionally silent genes with Ikaros complexes at centromeric heterochromatin. Cell. 1997;91:845–854. doi: 10.1016/s0092-8674(00)80472-9. [DOI] [PubMed] [Google Scholar]
- 10.Francastel C, Schübeler D, Martin DI, Groudine M. Nuclear compartmentalization and gene activity. Nat Rev Mol Cell Biol. 2000;1:137–143. doi: 10.1038/35040083. [DOI] [PubMed] [Google Scholar]
- 11.Piwien Pilipuk G, Galigniana MD, Schwartz J. Subnuclear localization of C/EBP beta is regulated by growth hormone and dependent on MAPK. J Biol Chem. 2003;278:35668–35677. doi: 10.1074/jbc.M305182200. [DOI] [PubMed] [Google Scholar]
- 12.Darlington GJ, Wang N, Hanson RW. C/EBP alpha: a critical regulator of genes governing integrative metabolic processes. Curr Opin Genet Dev. 1995;5:565–570. doi: 10.1016/0959-437x(95)80024-7. [DOI] [PubMed] [Google Scholar]
- 13.Tang QQ, Lane MD. Activation and centromeric localization of CCAAT/enhancer-binding proteins during the mitotic clonal expansion of adipocyte differentiation. Genes Dev. 1999;13:2231–2241. doi: 10.1101/gad.13.17.2231. [DOI] [PMC free article] [PubMed] [Google Scholar]
- 14.Schaufele F, et al. CCAAT/enhancer binding protein alpha assembles essential cooperating factors in common subnuclear domains. Mol Endocrinol. 2001;15:1665–1676. doi: 10.1210/mend.15.10.0716. [DOI] [PubMed] [Google Scholar]
- 15.Liu W, Enwright JF, Hyun W, Day RN, Schaufele F. CCAAT/Enhancer Binding Protein alpha uses distinct domains to prolong pituitary cells in the Growth 1 and DNA Synthesis phases of the cell cycle. BMC Cell Biol. 2002;3:6. doi: 10.1186/1471-2121-3-6. [DOI] [PMC free article] [PubMed] [Google Scholar]
- 16.Cobb BS, et al. Targeting of Ikaros to pericentromeric heterochromatin by direct DNA binding. Genes Dev. 2000;14:2146–2160. doi: 10.1101/gad.816400. [DOI] [PMC free article] [PubMed] [Google Scholar]
- 17.Tang QQ, Lane MD. Role of C/EBP homologous protein (CHOP-10) in the programmed activation of CCAAT/enhancer-binding protein-beta during adipogenesis. Proc Natl Acad Sci USA. 2000;97:12446–12450. doi: 10.1073/pnas.220425597. [DOI] [PMC free article] [PubMed] [Google Scholar]
- 18.Patterson GH, Lippincott-Schwartz J. A photoactivatable GFP for selective photolabeling of proteins and cells. Science. 2002;297:1873–1877. doi: 10.1126/science.1074952. [DOI] [PubMed] [Google Scholar]
- 19.Lippincott-Schwartz J, Patterson GH. Development and use of fluorescent protein markers in living cells. Science. 2003;300:87–91. doi: 10.1126/science.1082520. [DOI] [PubMed] [Google Scholar]
- 20.Jares-Erijman EA, Jovin TM. FRET imaging. Nat Biotechnol. 2003;21:1387–1395. doi: 10.1038/nbt896. [DOI] [PubMed] [Google Scholar]
- 21.Day RN, Schaufele F. Imaging molecular interactions in living cells. Mol Endocrinol. 2005;19:1675–1686. doi: 10.1210/me.2005-0028. [DOI] [PMC free article] [PubMed] [Google Scholar]
- 22.Berney C, Danuser G. FRET or no FRET: a quantitative comparison. Biophys J. 2003;84:3992–4010. doi: 10.1016/S0006-3495(03)75126-1. [DOI] [PMC free article] [PubMed] [Google Scholar]
- 23.Bastiaens PI, Jovin TM. Microspectroscopic imaging tracks the intracellular processing of a signal transduction protein: fluorescent-labeled protein kinase C beta I. Proc Natl Acad Sci USA. 1996;93:8407–8412. doi: 10.1073/pnas.93.16.8407. [DOI] [PMC free article] [PubMed] [Google Scholar]
- 24.Maul GG, Negorev D, Bell P, Ishov AM. Review: properties and assembly mechanisms of ND10, PML bodies, or PODs. J Struct Biol. 2000;129:278–287. doi: 10.1006/jsbi.2000.4239. [DOI] [PubMed] [Google Scholar]
- 25.Cheutin T, et al. Maintenance of stable heterochromatin domains by dynamic HP1 binding. Science. 2003;299:721–725. doi: 10.1126/science.1078572. [DOI] [PubMed] [Google Scholar]
- 26.Krylov D, Olive M, Vinson C. Extending dimerization interfaces: the bZIP basic region can form a coiled coil. EMBO J. 1995;14:5329–5337. doi: 10.1002/j.1460-2075.1995.tb00217.x. [DOI] [PMC free article] [PubMed] [Google Scholar]
- 27.Phair RD, et al. Global nature of dynamic protein-chromatin interactions in vivo: three dimensional genome scanning and dynamic interaction networks of chromatin proteins. Mol Cell Biol. 2004;24:6393–6402. doi: 10.1128/MCB.24.14.6393-6402.2004. [DOI] [PMC free article] [PubMed] [Google Scholar]
- 28.Maison C, Almouzni G. HP1 and the dynamics of heterochromatin maintenance. Nat Rev Mol Cell Biol. 2004;5:296–304. doi: 10.1038/nrm1355. [DOI] [PubMed] [Google Scholar]
- 29.Bannister AJ, et al. Selective recognition of methylated lysine 9 on histone H3 by the HP1 chromodomain. Nature. 2001;410:120–124. doi: 10.1038/35065138. [DOI] [PubMed] [Google Scholar]
- 30.Lukyanov KA, Chudakov DM, Lukyanov S, Verkhusha VV. Innovation: Photoactivatable fluorescent proteins. Nat Rev Mol Cell Biol. 2005;6:885–891. doi: 10.1038/nrm1741. [DOI] [PubMed] [Google Scholar]
Associated Data
This section collects any data citations, data availability statements, or supplementary materials included in this article.