

Abstract
There are many important considerations during preclinical development of cancer nanomedicines, including: 1) unique aspects of animal study design; 2) the difficulties in evaluating biological potency, especially for complex formulations; 3) the importance of analytical methods that can determine platform stability in vivo, and differentiate bound and free active pharmaceutical ingredient (API) in biological matrices; and 4) the appropriateness of current dose scaling techniques for estimation of clinical first-in-man dose from preclinical data. Biologics share many commonalities with nanotechnology products with regard to complexity and biological attributes, and can, in some cases, provide context for dealing with these preclinical issues. In other instances, such as the case of in vivo stability analysis, new approaches are required. This paper will discuss the significance of these preclinical issues, and present examples of current methods and best practices for addressing them. Where possible, these recommendations are justified using the existing regulatory guidance literature.
Keywords: Nanotechnology, Biological potency, Modeling and simulation, Clinical starting dose, Allometry
1. Introduction
Nanotechnology offers many potential advantages to traditional drug design and delivery. Encapsulation within a nanoparticle can alter a drug's pharmacokinetics and distribution in ways that improve efficacy and reduce adverse side effects. For instance, drug complexation within the nanoparticle formulation can prevent first-pass clearance from the bloodstream, often resulting in prolonged circulation relative to the unfomulated drug [1]. The size and surface properties of nanomaterials can cause them to selectively accumulate in tumor tissue via what is termed the enhanced permeability and retention (EPR) effect [2,3] — making them potentially useful tumor delivery vectors. Nanomaterials may also be “actively targeted” to diseased tissue by specific ligands (peptides, proteins, antibodies, aptamers, or small molecules) attached to their surfaces [4,5].
Such application of nanotechnology to drug design presents many new challenges and opportunities [6]. Engineered nanomaterials are now successfully being used for therapeutic applications in the treatment of cancer and other diseases. However, researchers and regulators are still working to define precisely what nanomaterial properties establish safety and efficacy [7,8]. Many of the FDA's general recommendations for preclinical study design are broadly applicable to nanomedicines, and guidances for biologics and drug reformulations, in particular, can also provide additional context. It is in the nuances of extending such existing guidances to nanomaterials that confusion seems to arise — specifically, in such issues as the design of animal studies, establishing biological potency, methods of evaluating drug release properties, and interspecies dose scaling.
This review focuses on preclinical biological issues rather than concerns regarding the physicochemical characterization of nanomaterials. Such concerns have been reviewed elsewhere [9], however, the importance of extensive physicochemical characterization cannot be overstated. Biological studies conducted on poorly characterized material are at best un-illuminating and more often misleading — sending researchers after time-consuming red herrings and down expensive dead-ends. Indeed, thorough physicochemical characterizations are the foundation upon which the biological preclinical evaluation is built.
Here, we review the significance of biological preclinical issues for various nanomaterial based therapeutics, and present examples of methods for addressing them. We focus on the areas of choice of dosing route and regimen, selection of the most appropriate animal species, potency evaluation and establishing biological equivalence of multiple batches of a drug, evaluation of nanomaterial in vivo stability and drug release, and estimation of a starting clinical dose. Examples are taken both from research presented for the first time here and drawn from the scientific literature. Much of the new research is from NCI's Nanotechnology Characterization Lab (NCL). The NCL is part of NCI's Alliance for Nanotechnology in Cancer and was founded in 2004 as a formal interagency collaboration between NCI, the National Institute of Standards and Technology (NIST), and the Food and Drug Administration (FDA). Nanomaterials submitted to the NCL are subjected to a three-tiered Assay Cascade of scientific tests, including physicochemical characterization, in vitro assessment and in vivo evaluation for safety and efficacy. To date, NCL has characterized more than 180 different nanomaterials, including those intended as drugs, biologics, and medical devices.
2. Material and methods
2.1. Materials
Sprague Dawley rats and New Zealand White rabbits were purchased from Charles River Laboratories, Inc. (Willmington, MA). Tumor necrosis factor-alpha (TNF)-gold nanoparticle formulation (Aurimune™) and TNF ELISA (CytElisa™ kit) were provided by Cytimmune Sciences, Inc. (Rockville, MD). Heparin was purchased from Sigma-Aldrich (St. Louis, MO).
2.2. Husbandry
Animal rooms were kept at 50% relative humidity, 68–72 F with 12 h light/dark cycles. Rats were housed by treatment group, with two animals/cage (rat polycarbonate cage type), with 1/4” corncob bedding. Animals were allowed ad libitum access to Purina 18% NIH Block and chlorinated tap water. NCI-Frederick is accredited by AAALAC International and follows the Public Health Service Policy for the Care and Use of Laboratory Animals. Animal care was provided in accordance with the procedures outlined in [10].
2.3. Rat pharmacokinetic studies
Double jugular catheterized 10-week-old female Sprague Dawley rats (approximate weights of 200 g) were purchased from Charles River Laboratories (Raleigh, N.C.). Rats, 4–5 animals per group, were treated intravenously by the right jugular catheter with 250 ug TNF / kg of either the Au–TNF (Aurimune™) nanoformulation or native TNF in PBS vehicle. Blood samples were collected from the left jugular catheter at 15, 30, 60, 120, 240, 480 and 1440 min. The blood samples were mixed 1:1 with heparin (1 mg/mL in PBS) and stored at 4 °C. Samples were analyzed for gold and TNF concentration by ICP-MS and ELISA, respectively.
2.4. Rabbit pharmacokinetic data
Rabbit pharmacokinetic data were obtained from a GLP compliant study conducted by BioCon, Inc. in New Zealand White rabbits (3 males and 3 females/group, 2.5–3 kg). The study was reviewed and approved by the BioCon, Inc IACUC. The rabbits were injected with 25 or 125 μg TNF /kg of the Au–TNF nanoformulation via the ear vein, followed by a 1 mL saline flush. The rabbit blood collection times were 5, 30, 60, 120, 240, 360, 480 and 1440 min. Blood was collected into heparinized tubes undiluted.
2.5. Human pharmacokinetic data
Human pharmacokinetic data were obtained from a GLP compliant clinical study conducted by NIH. Institutional Review Board (IRB) approval was granted by the NIH for the parent study titled “TNF-Bound Colloidal Gold in Treating Patients With Advanced Solid Tumors”, from which blinded clinical pharmacokinetic data was obtained for this retrospective analysis. Three oncology patients per dose level received 11 or 16 μg TNF /kg of the Au–TNF nanoformulation, administered as an intravenous bolus. Blood collection times were 5, 15, 30, 60, 120, 180, 240 and 480 min. Blood was collected into heparinized tubes undiluted.
2.6. Au ICP-MS analysis of blood and tissue
(Certain commercial instruments are identified in this paper to specify adequately the experimental procedure. Such identification does not imply recommendation or endorsement by NIST, nor does it imply that the equipment identified is necessarily the best for the purpose.) The entire blood sample was transferred to a microwave cell. Four samples approximately 0.25 g each of RM 8012 (Gold Nanoparticles, Nominal 30 nm Diameter) were weighed into 4 microwave cells serving as controls. Six microwave cells were used for procedure blanks. To each blood sample, 4 mL of concentrated HNO3 and 1 mL concentrated HCl were added. To each tissue sample, 8 mL of concentrated HNO3 and 2 mL concentrated HCl were added. The microwave cells were capped and the samples were digested by microwave radiation. The resulting digest was quantitatively transferred to a pre-weighed 60-mL low density polyethylene (LDPE) bottle and diluted with water to approximately 50 g. The analytical portion was prepared by transferring 5 g of the sample digest into a 60-mL LDPE bottle and diluting the content to approximately 50 g with a diluent consisting of 1.5% HNO3 and 4% HCl by volume. The digest of a blood (or a tissue) sample from a control rat was used to prepare matrix matched calibration standards. Approximately 5 g of the digest was transferred to each of the six 60-mL LDPE bottles, into which 0 μg, 0.5 μg, 1.0 μg, 1.5 μg, 2.0 μg, 2.5 μg, 3.0 μg gold from SRM 3121 (Gold Standard Solution) were added, respectively. The content in each bottle was diluted to approximately 50 g with the acid diluent described above. Samples were quantified by using the quantitative analysis mode of the Agilent 7500cs ICP-MS. A solution containing 10 ng/g indium was used as the internal standard. Sample solution and the internal standard were picked up at two separate channels of the peristaltic pump. Solutions from the two channels were joined with a mixing T before entering the nebulizer. Ion counts at 115 amu and 197 amu were recorded for indium and gold, respectively.
2.7. TNF ELISA analysis of blood
An enzyme-linked immunosorbent assay (ELISA) method was used to determine free and total TNF in blood samples. This method is a sandwich ELISA, which measures TNF using a CytElisa™ kit (CytImmune Sciences, Inc.). Mouse anti-human TNF monoclonal antibodies coated on the plate were used to capture TNF in samples and rabbit antihuman TNF polyclonal antibodies were used as the detection antibodies. A secondary antibody, goat anti-rabbit antibody alkaline phosphatase conjugate, was used to develop a substrate to produce a visible color, which was detected at 490 nm. The amount of TNF in the sample was determined by comparing the sample response to that of a TNF standard curve, using a 4-parameter fit of the average uncorrected absorbance of the standard at each concentration. The standard curve used for the rat samples were 2500, 1875, 1250, 938, 625, 469 and 313, for the rabbit samples were 1000, 500, 250, 625, 312.5 156.75, 78.375 and 39, and for the human samples were 2500, 1875, 1250, 937.5 625, 468.75 and 312.5 pg TNF /mL.
2.8. Noncompartmental pharmacokinetic analysis
Noncompartmental pharmacokinetic parameters were determined by the following methods, using WinNonlin Version 4.1 software (Pharsight Corp., Mountain View, CA): the area under the time concentration curve (AUC) was calculated using the linear trapezoidal rule with extrapolation to time infinity; clearance (CL) was calculated from dose/AUC; apparent volume of distribution (Vd) was calculated from dose/Co (concentration at time zero calculated from extrapolation of the plasma time curve); plasma half-life (t1/2) was calculated from 0.693/slope of the terminal elimination phase (λ).
2.9. Compartmental pharmacokinetic analysis
The single compartment model expressed as the algebraic equation, C(t)=D/Vd*e(−K10*t), was fit to the pooled animal blood concentration–time data (C(t)) and dose (D). The volume of distribution (Vd) and first-order elimination rate constant (K10) parameters were estimated by nonlinear least-squares regression analysis, using 1/(Y*Y) weighting scheme (WinNonlin 4.1; Pharsight Corporation, Mountain View, CA).
For a description of the hyperbolic stability and Au–TNF release models, please refer to the results and discussion.
2.10. Allometric scaling
Allometric scaling of CL and V parameters were performed by fitting the power models, CL=a*BWb and V=c*BWd, where BW is the body weight and a–d are fitting parameters. Brain weight product scaling was performed by fitting the power models, CL=a*BWb/BrW and V=c*BWd/BrW, where BrW is the brain weight. Power model parameters were estimated by non-weighted, nonlinear least-squares regression analysis using WinNonlin Version 4.1 software (Pharsight Corp., Mountain View, CA). For allometric analysis, the standard body weights 75, 3 and 0.2 kg, and standard brain weights 1.5, 0.013 and 0.0018 kg were used for man, rabbit and rat, respectively.
3. Results and discussion
3.1. Animal study design
At this time, many of the FDA's general recommendations for design of small molecule chemotherapeutic and biologic preclinical studies also apply to nanomedicine. However, as nanotechnology researchers often come from outside the traditional pharmacology field (e.g. from the physical, chemical or materials sciences), these general recommendations are briefly reviewed here, highlighting important nanotechnology-specific issues.
3.1.1. Species selection
Pharmacology and toxicology studies should be conducted in the most clinically relevant animal model. It is key that the pharmacology studies demonstrate a thorough understanding of the drug's mechanism of action [11]. The choice of the most clinically relevant oncology models is a matter of continuous debate, and evaluation in multiple models is preferred. In fact, a review of small molecule preclinical data by NCI's Developmental Therapeutics Program found that drugs had a higher probability of later demonstrating clinical efficacy if they were successful in multiple xenograft models [12]. Something to consider when designing xenograft studies to evaluate nanoparticle efficacy, is that it is the xenograft's vascular fenestrations that allow selective access of nanotherapeutics to the tumor tissue [13]. Since xenograft tumors have variably sized vascular fenestrations, and it is unknown how these fenestrations might relate to the eventual clinical tumor target encountered [13], evaluating multiple models is certainly a prudent course.
Pharmacology studies, due to their experimental nature, are generally not performed under good laboratory practice (GLP) guidelines. Toxicology and pharmacokinetic studies must be conducted under GLP for investigational new drug (IND) approval. Toxicology studies must generally be performed in both sexes, in a rodent and non-rodent species, usually rats and dogs. In certain cases, specific animal species are historically more predicative of toxicity for certain drug classes (e.g., primates for predication of complement-mediated toxicity of phosphorthionate oligonucleotide therapies [14]), and should be used. Due to species-specific target expression, in some cases only primates are relevant for toxicology studies, or there are no nonhuman target-expressing animals. In such cases, transgenic animals expressing the target or a surrogate ligand for a similar animal target can be used to characterize toxicity profiles [15].
For particulates, including nanomaterials, uptake by the reticuloendothelial system (RES) has been shown to be an important modulator of biodistribution [16]. At this time, the most relevant species for evaluating nanomaterial toxicology or ADME, with regard to RES function, are unknown. Studies suggest that in laboratory animals (rats, mice, guinea pigs, rabbits and dog) and man, splenic macrophages and liver Kupffer cells are primarily involved in sequestration of particulates, while in some larger animals (sheep, goat, cat, pig and calf) pulmonary intravascular macrophage (PIM) are primarily involved [17]. For example, data from a study examining distribution of gold and iron oxide colloids in multiple species primarily observed liver Kupffer cell uptake in rats, mice, guinea pigs, rabbits and nonhuman primates, while in sheep, calves, goat, cat, and pig, PIM uptake was observed [18]. Thus, the selectivity of RES-mediated particle distribution would, in theory, support the use of more traditional species (e.g., dog and rat) in nanoparticle toxicological and pharmacokinetic assessment, rather than some of the larger experimental animals (e.g., pig).
3.1.2. Dosing route and regimen
The dosing regimen and administration route for repeat-dose toxicology studies are dictated by the intended clinical administration route and regimen, which is in turn dictated by the pharmacology of the nanoformulation. The ideal dosing administration route takes pharmacokinetics into consideration. For many, if not most, nanoformulations, the clinically relevant administration route for making use of the tumor-selective distribution of nanoformulations (i.e., by the enhanced permeation and retention (EPR) effect) is intravenous (i.v.). However, nanoformulations have also been used to increase oral bioavailability, for inhalation administration, and as intraperitoneal or subcutaneous depots. In all these cases, it is important that preclinical pharmacology and toxicology studies utilize the intended clinical administration route. As for the ideal dosing regimen to be taken forward into clinical trials, this is gleaned from in vitro cytotoxicity studies, in vivo pharmacokinetic/pharmacodynamic studies, and often, ultimately, relies on scientific judgment. It is also important to take into account ease of administration and patient compliance (e.g., intraperitoneal (i.p.) dosing is not as well tolerated as standard i. v. infusion). Toxicology studies should also include the i.v. route for nanoformulations where the primary clinical administration route is not i.v., to allow for high exposure comparison [19]. The duration of multi-dose toxicology studies is dependent upon the intended clinical dosing duration, but is generally less than four weeks repeat dosing for a cancer therapy IND [11]. The number of animals required for toxicology, toxicokinetic and pharmacokinetic studies depends upon the study length. For studies of up to 4 weeks in duration, 5–10 rats or 3–4 dogs per sex per dosage group are usually sufficient [20]. The number of animals required for pharmacology studies is dependent upon the variability in the monitored endpoint.
3.1.3. Special issues for toxicity studies
The maximum dose used in preclinical toxicology trials depends upon several factors, including the toxicity of the nanoformulation and its solubility. It is generally not reasonable to dose a nanoformulation over several g/kg, or 50 fold greater than the expected clinical exposure, based on area under the time–concentration curve (AUC) [21]. If toxicity is not observed at these high doses, then it is not necessary to escalate further. Alternatively, if the drug is only soluble or stable at mg/mL concentrations in the optimum vehicle (as is sometimes the case for nanoformulations), then the dose would be limited by this solubility and by the maximum volume that can be administered to the animal model by the clinically relevant administration route and dosing regimen. The lack of toxicity profile characterization, and an inability to identify a maximum tolerated dose (MTD) and dose limiting toxicities (DLT), either due to solubility limitations or instability at high concentrations, complicates risk analysis and the selection of a first-in-man dose. Fortunately (or unfortunately), identifying toxic doses is generally not difficult for cytotoxic chemotherapeutic agents. Biologics, on the other hand, which may not demonstrate toxicity in preclinical models at reasonable doses, are often dosed to pharmacologically appropriate blood concentration, based on receptor affinity or biomarker modulation, and not MTD [15].
There is evidence for unique distributions of nanotechnology platforms based on physicochemical particulate properties, such as size. In a study by De Jong et al., gold nanoparticles, administered i.v. to rats, were shown to preferentially accumulate in organs in a size-dependent manner [22]. Gold particles with 10 nm diameters preferentially accumulated in kidney, testis, thymus heart, brain, spleen and liver, while 50 nm particles accumulated primarily in lung, spleen and liver, and particles with diameters greater than 100 nm accumulated in spleen and liver exclusively. In a separate study of silica nanoparticles intravenously injected into mice, 50 and 100 nm particles accumulated in both liver and spleen, while 200 nm particles accumulated exclusively in spleen [23]. This increased splenic uptake by particles with diameters greater than 200 nm has also been shown for other nanoparticles, such as liposomal formulations [24]. Larger silica particles, greater than 600 nm, have also been shown to accumulate in rat lung [25]. This accumulation in the lung by larger particles, or aggregated nanoparticles, may be the result of entrapment by intravascular macrophages in the lung or the sieving action of the narrow pulmonary capillaries, which could result in occlusion. This potential for microcirculation compromise is not unique to nanotechnology, and has been concern for other particulate medicines as well [26]. It is clearly important to include the drug-free (or empty) nanoparticle and free drug as control groups in toxicology studies, to allow identification of particle-dependent toxicities and particle-dependent shifts in the encapsulated drug's toxicity, respectively. The inclusion of the empty platform in toxicology studies has been recommended previously by the FDA for drug depots and liposomes [27].
Understanding nanoplatform pharmacokinetics and biodistribution is important, as it allows researchers to identify organs on which to concentrate in exploring potential sites of toxicity. The unique distribution governed by properties of the nanoparticle can certainly alter the toxicity profile of the encapsulated drug. For example, formulation of doxorubicin as a cyanoacrylate nanoparticle resulted in accumulation in the kidneys of rats, and shifted toxicity from the heart (for free doxorubicin) to the kidney [28]. Nanoscale liposomal formulations of doxorubicin, such as Doxil, accumulate in skin, resulting in a shift in the toxicity profile from dose-limiting cardiotoxicity and myelosuppression (for free doxorubicin) to the cutaeneous toxicity, palmar–plantar erythrodysesthesia [29]. The FDA recommends comparative pharmacokinetic and mass balance studies between marketed and novel drug formulations to identify these differences in disposition [30]. Often there is at least some distribution of nanoplatforms to organs of the RES (liver, spleen, lung, kidney), and there is also concern about the long term consequences of RES accumulation for non-biodegradable platforms, such as carbon-based or metal nanoparticles. In the past, this concern over biological persistence has been adequately addressed for implanted devices by safety studies of the devices extractable and leachable components; it is likely that persistent nanoparticles will be regulated in a similar fashion [31,32]. The FDA also recommends that in cases of selective distribution, as is the case in RES sequestration of nanoparticles or selective distribution of targeted nanoparticle, it may be necessary to perform repeat dose tissue distribution studies to identify accumulation [33]. For other studies that may be important for regulatory review of chemotherapeutic agents, such as teratogenicity, genotoxicity, safety pharmacology and human tissue cross reactivity, the reader is directed to the FDA white paper by DeGeorge et al., 1998 and other relevant guidance [21,27].
3.2. Evaluation of biological potency
As is the case with biologics, when it comes to nanotechnology-based platforms the “process is the product”. That is to say, if the process changes, whether due to alternate production schemes or as part of scale-up, it is likely that the finished product is going to change as well. Since preclinical testing can't start over “from scratch” every time there is a formulation change, bridging studies are required to compare the properties of the new material to a “gold-standard” reference material. The question then is: what properties should be considered? There is a vast array of analytical methodologies for physicochemical evaluation of nanomaterials (e.g. dynamic light scattering, atomic force microscopy, zeta potential analysis, electron microscopy, elemental analysis, to name only a few). As first principals characterization of nanoplatforms is beyond the scope of this review, and has been reviewed elsewhere [9], it suffices to say that multiple orthogonal methods should be applied to evaluate batch-to-batch consistency. Unfortunately, none of these physicochemical methods can address if the newly formulated material is identical to the gold-standard in terms of efficaciousness. This is because nanoplatforms are complex and their chemical identity cannot be determined to the level of certainty that is possible for small molecules. It is therefore necessary to perform biological bridging studies, and incorporate biological assays into quality assurance testing.
The importance of establishing biological consistency between batches is not unique to nanoplatforms, as this is an issue for biologics as well. A relevant analogy would be the case of insulin [34]. When first produced, the issue of how to insure consistent batch-to-batch biological potency was a great concern. It was determined that the only way to address this issue for such a complex macromolecule was a bioassay. To assess the biological potency of insulin, blood glucose depression in rabbits was initially used, then convulsive activity in mice, and finally blood glucose depression in mice (this is the most commonly used test of insulin potency today [34]). The FDA recommends that the potency of cellular and gene therapy products be evaluated by bioassay, or by analytical assay that is a validated surrogate of biological activity, and this potency assay should be included as one of the lot release criteria [35]. Due to the similarities between biologics and nanoformulations, as well as the fact that many nanoformulations include biological components, it is logical that potency assays should also be used for nanoplatforms. The choice of bioassay, in vitro or in vivo, depends upon the pharmacological mechanism of action and the assay's potential for standardization. While in vitro assays are faster, cheaper, more reproducible, more ethically justifiable and easier to standardize than in vivo assays, they are not as physiologically relevant. An additional caveat is that the distribution-based benefits of therapeutic/imaging nanoplatforms, such as targeting, can never be fully evaluated in vitro.
The use of bioassays to evaluate the biological potency of nanoplatforms is standard practice during early preclinical development. However, the use of these bioassays as a lot release criteria for insuring batch-to-batch consistency is far less common. To support the batch-to-batch consistency of a folate-targeted, methotrexate conjugated dendrimer nanotherapeutic, Dr. Baker's group at the University of Michigan utilized a mixed folate receptor±co-culture. This co-culture system consisted of red fluorescent protein expressing, folate receptor positive human nasopharyngeal cells and green fluorescent protein expressing, folate receptor negative MCA-207 cells [36]. The bioassay was able to demonstrate selective cell toxicity by the folate-targeted, methotrexate conjugated dendrimer for the folate receptor positive portion of the cell population, labeled with the red fluorescent marker, in contrast to the folate receptor negative portion of the cell population, labeled in green. This assay was then used to further demonstrate batch-to-batch consistency for both selectivity and cytotoxic potency. The company CytImmune Sciences, Inc., as part of its lot release testing, uses an in vitro bioassay to evaluate the biological potency of a nanoformulation of tumor necrosis factor-alpha (TNF), in which TNF and polyethylene glycol (PEG) are conjugated to 27 nm gold colloid (Aurimune®). This bioassay utilizes a lymphoma cell line that is sensitive to TNF, and measures the cytotoxic potency of Aurimune. As discussed above, the use of bioassays to ensure consistency in biological potency has precedence for biologics, and similar methods should be a component of nanotherapeutic lot release testing when feasible.
3.3. Platform stability
In most therapeutic nanomedicine formulations, a small-molecule drug is either encapsulated within a nanoparticle platform or conjugated to the surface. In addition to ensuring that the nanoformulation is stable on the shelf prior to patient administration, it is important to ensure that the platform-drug interaction has sufficient stability in vivo. The FDA guidance for liposome drug products, which can provide some context for evaluation of nanoplatforms in general, recommends the evaluation of in vivo stability [30]. Unfortunately, the NCL has encountered numerous nanoformulations that fall into the category of too stable or too unstable (unpublished findings), meaning they release a drug more slowly or more quickly than optimal. Without knowledge of platform stability in vivo, the extent to which the nanoplatform is influencing drug delivery cannot be determined (Fig. 1). For instance, if the drug is released prematurely, this will negate any possible positive benefits of selective distribution of the nanoplatform (e.g. by the EPR effect), and potentially result in off-target toxicity. On the other hand, if the platform is too stable, the drug is likely to be ineffective, remaining as an inactive prodrug, and might bioaccumulate. The stability of the platform-drug interaction is dependent upon both the chemistry of the nanoformulation and conditions in the surrounding biological matrix. For instance, researchers have developed polymeric nanoparticles that utilize a pH-sensitive hydrazone drug linker to confer controlled release properties [37]. These pH-sensitive nanoparticles are stable at neutral plasma pH, but selectively release their drug cargo in the acidic environment of the lysosome. As another example, magnetite nanoparticles have been constructed that selectively degrade and release drugs at the high temperatures produced under an alternating magnetic field [38]. While nanoparticle formulations may show excellent controlled release characteristics in vitro, this does not always translate to controlled release under the dynamic environment in vivo. Thus, it is very important to characterize the in vivo release behavior.
Fig. 1.
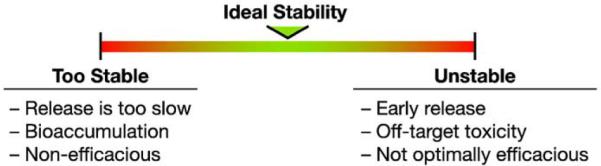
Nanoplatform-drug stability.
3.3.1. Dual labeling and complementary analysis
One experimental method that has been used to assess nanotechnology drug stability in vivo is dual radio-labeling. This entails labeling of a component of the nanoparticle platform with one label (e.g., tritium) and the drug component with another label (e.g., 14C). Similar pharmacokinetic profile and pharmacokinetic parameter estimates, such as volume of distribution, clearance and half life, for the drug and platform tracers in vivo would indicate stability of the platform. It is our experience that many nanotechnology platforms that evade the RES and are stable, distribute into the plasma volume, with an apparent volume of distribution in mammals of approximately 4% of body weight or 40 mL/kg, depending on hydration state and hematocrit levels. Additionally, the nanomaterial typically displays a monophasic decay, as there is no apparent tissue distribution phase. Small molecule drugs, in contrast, have much higher volumes of distribution and often multi-phasic decays. As an example, the NCL dual labeled a nanoliposome formulation of the insoluble drug ceramide with 14C-ceramide and 3H-DSPC to track the payload and platform components, respectively (Fig. 2) [39]. Using dual channel scintillation counting, the 3H and14C β-particle energies in blood and tissues were separately quantified and the platform stability estimated. In this case, it was observed that the ceramide rapidly distributed into tissue, independent of the nanoliposome which remained in the plasma space. These disparate profiles for the two tracers resulted in very different calculated volumes of distribution (1020±478 vs. 63±19 mL/kg for ceramide and liposome, respectively), and rates of clearance from plasma (165±14 vs. 3.6±0.4 mL/h/kg for ceramide and liposome, respectively). As an alternative to dual labeling, complementary analysis can also be used. Complementary analysis involves using different, complementing techniques, such as quantitative chemical and/or biochemical analysis, for measurement of the platform and payload components.
Fig. 2.

14C-C6 ceramide and 3H-DSPC plasma profiles. Reproduced with permission from Drug Metabolism and Disposition, Zolnik et al., 2008 [39]. Plasma time profiles are expressed as the percent injected dose per mL. (◆), 3H-DSPC of ceramide liposome; (□), 3H-DSPC of control liposome on y−1 axis; (●) 14C-ceramide on y−2 axis. Each point represents the mean ± std. dev. from n=4–5 rats.
As an example, the NCL used enzyme linked immunosorbent assay (ELISA) and inductively coupled plasma mass spectrometry (ICP-MS) to track the payload and platform components, respectively, of the earlier discussed Cytimmune TNF-gold (Au) nanoparticle. Rats were treated intravenously with 250 μg TNF/kg of either the colloidal gold-bound TNF (Au–TNF) nanoformulation or native, unformulated TNF in PBS vehicle (see methods section for experimental details). Blood samples were collected at 15, 30, 60, 120, 240, 480 and 1440 min, and analyzed for Au and TNF concentrations by ICP-MS and ELISA, respectively. The colloidal gold bound TNF and native TNF had different blood concentration profiles, with the colloidal gold-bound formulation attaining higher blood TNF concentrations and decaying at a slower rate (Fig. 3). Although the peak blood concentrations of gold and gold bound TNF were similar, the gold concentration had a much slower rate of decay.
Fig. 3.

Blood concentration-time profiles for TNF-Au, Au and native TNF. Blood profiles of colloidal gold bound TNF (TNF-Au), gold (Au) and native TNF (Native TNF), are expressed as % injected dose/mL. The TNF concentration was determined by ELISA and gold concentration was determined by ICP-MS. Each symbol represents the mean±SD for that time point (n=4–5).
Estimates of pharmacokinetic parameters for the TNF nanoformulation were quite different than for native TNF. In comparison to Au–TNF, the estimate of native TNF peak concentration, Cmax, was almost 10 times lower (0.32±06 μg/mL vs. 3.0±0.6 μg/mL, mean±SD), and the Vd was almost 10 times higher (163±31 mL vs. 18±4 mL, mean±SD) (Table 1). Clearance, CL, was approximately 12 times greater (2.6±0.02 mL/min vs. 0.21±0.02 mL/min, mean±SD), and TNF exposure, AUC, was approximately 12 times lower (20.6±2.8 ng/mL/min vs. 248±18 μg/mL/min, mean±SD) for native TNF in comparison to the colloidal gold formulation (Table 1). Clearly, being bound to colloidal gold dramatically influenced the pharmacokinetics of the TNF molecule, causing the pharmacokinetics of gold-bound TNF to differ markedly from native TNF.
Table 1.
Pharmacokinetic parameters for Native TNF, Au-TNF, and Au. Pharmacokinetic parameters determined by noncompartmental analysis of blood time profiles. Data are presented as mean±SD (n=4–5 rats).
|
Cmax |
Vd |
AUC |
CL |
t1/2 |
|
|---|---|---|---|---|---|
| ug/ml | mL | ug/mL/min | mL/min | min | |
| Native TNF | 0.32±0.06 | 163±31 | 20.6±2.8 | 2.6±0.5 | 26±4 |
| Au-TNF | 3.0±0.6 | 18±4 | 248±18 | 0.21±0 | 182±26 |
| Au | 64±20 | 24±8 | 21474±6894 | 0.07±0.03 | 217±29 |
AUC, area under the time concentration curve; CL, clearance; Vd, apparent volume of distribution; Co, concentration at time zero; t1/2, terminal half-life.
Estimates of pharmacokinetic parameters from the blood concentration-time profiles by noncomparmental analysis were similar for the gold and Au–TNF, with volume of distribution (Vd) approximately 20 mL, and terminal half-life (t½) approximately 200 min (Table 1). The Au–TNF, however, cleared approximately 3 times faster than gold (0.21±0.02 mL/min vs. 0.07±0.03 mL/min (mean±SD)). The similar Vd for the gold and TNF components suggests the platform was initially stable, and the faster rate of Au–TNF clearance than gold clearance suggests that the formulation slowly released TNF, or TNF was slowly degraded on the platform, in vivo. Furthermore, the similar terminal t½ for the gold and Au–TNF components suggests that a portion of the TNF remained complexed with the gold at the later time points. Again, it is not known whether the eventual dissociation of the TNF profile from that of gold was the result of metabolism of the TNF or the release of TNF from the gold surface, but the TNF clearly decayed at a faster rate than gold. This study demonstrates the utility of complementary analysis in evaluating in vivo platform stability.
Another method to estimate in vivo stability is through the use of in vitro drug release assays, and the FDA has recommended such in vitro release assays for liposomal drugs [30]. One method to estimate stability that is particularly suited for the dual labeling and complementary analysis techniques is the in vitro blood partitioning assay [39]. The in vitro blood partitioning assay determines the extent of red blood cell (RBC) partitioning of a nanoplatform following incubation in whole blood. By measuring both the drug and platform components in the whole blood and plasma fractions, the extent of component partitioning into plasma and RBC fractions of whole blood can be calculated by the equation [40]:
where Cp is the concentration in plasma, Cb is the concentration in whole blood, and Hc is the Hematocrit. Fp%, the fraction in plasma, is an estimate of the percentage in the plasma fraction. Whereas, (1–Fp) would be an estimate of the percentage in the red blood cell fraction.
The Fp% values of the individual components can also be compared as a measure of platform integrity. If the platform is stable, then the component ratio in the RBC and plasma fractions should be equivalent to the ratio in the initial formulation, and Fp % should be the same for all components. However, if the drug component partitions independently of the platform, then the component ratios in the blood fractions will change and Fp% will be different for different components. The NCL has found this partitioning blood assay to be highly predictive of in vivo stability for a number of nanoplatforms (unpublished data). As an example, the stability of the ceramide-nanoliposome discussed above was also estimated by evaluating blood partitioning [39]. It was demonstrated that incubation of dual-radiolabled liposome with whole blood resulted in rapid 14C-ceramide partitioning into the red blood cell fraction independent of 3H-DSPC liposome, while 3H-DSPC liposome remained in the plasma, predicting the platform instability that was confirmed in vivo.
3.3.2. Modeling and simulation of free drug profile
Modeling and simulation can complement these previous stability indicating methods, by allowing estimation of the free drug fraction from the composite drug profiles. This technique has been used in the past for simulation of encapsulated and released drug profiles for liposomal drugs [41], and can be applied to other nanotechnology platforms as well. As an example, the NCL used modeling and simulation to predict the free TNF component of a composite TNF (encapsulated+free) profile for the gold-bound TNF nanoconstruct discussed above. The more rapid decay of the Au–TNF blood concentration in comparison to gold suggested instability of the gold/TNF complex. In order to further characterize this apparent instability, the Au–TNF/gold blood concentration ratio-time profile was examined. The change in the Au–TNF/gold ratio, expressed as (%ID Au–TNF/mL)/(%ID gold/mL), has a rectangular hyperbolic profile that fits well to a Michaelis–Menten type equation, ratio=1–(1*t/(t+t50)) (Fig. 4). The t50 parameter, the time at 50% (%ID Au–TNF/mL)/(%ID gold/mL) ratio, was estimated by nonlinear least-squares regression analysis of the pooled Au–TNF/gold ratio-time data. The t50 estimate was 58±12 min (estimate±SE).
Fig. 4.
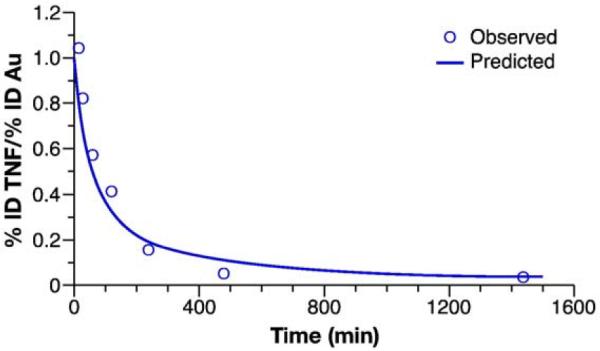
Au–TNF/Au-hyperbolic stability model. The rectangular hyperbolic Michaelis-Menten type equation, ratio=1–(1*t/(t+t50)), was fit to the pooled Au–TNF to gold (Au) concentration ratio-time profile. Data are presented as mean (n=4). Lines represent the fit of the hyperbolic stability model to the blood concentration-time data.
It is important to emphasize that the analytical methods employed in the TNF nanoformulation pharmacokinetic study above did not allow for discrimination between TNF release and TNF metabolism. If TNF loss were due to TNF release from the gold-TNF complex, it would be of interest to predict the maximal free TNF concentrations. A compartmental modeling approach was used to describe the potential release of TNF from gold, and predict the maximal free TNF blood concentrations following gold-bound TNF treatment (Fig. 5). The following is a mathematical representation of the Au–TNF release model depicted in Fig. 5:
Fig. 5.

Pharmacokinetic model for TNF release. Pharmacokinetic parameters were obtained by fitting the blood concentration-time data for gold (CAu) and Au–TNF (CT). The TNF release was estimated using the hyperbolic stability equation, CRel=CT(0)*exp (−k1*t)*(t/(t+t50). The first-order elimination constant (k2) and concentration at time zero (CN(0)) for native TNF (CN) were fixed. The first-order elimination rate for gold (k1), hyperbolic time to 50% TNF release (t50), and time zero concentrations for gold (CAu(0)) and Au–TNF (CT(0)) were obtained from fitting the kinetic model to the data.
Differential equations:
| (1) |
| (2) |
| (3) |
| (4) |
| (5) |
Constraint:
| (6) |
This is a mixed model, made up of 5 differential equations (Eqs. (1)–(5)) and one algebraic constraint (Eq. (6)). A modified version of the hyperbolic stability equation, CREL = CT(0) *exp (−k1*t)*(t/(t+t50), was used to estimate TNF release. Eq. (1) is the first-order derivative of the modified hyperbolic stability equation, CRel = CT(0)*exp(−k1*t)*(t/(t+t50). Eqs. (2) and (3) are the first-order derivatives of gold and native TNF blood concentration decay, respectively. Eqs. (4) and (5) are the derivatives describing the change in free and bound TNF blood concentration, respectively. The (CN(0)/CT(0)) term in Eq. (4) accounts for the difference in Vd for free versus bound TNF (bound TNF Vd/free TNF Vd = CN(0)/CT(0)). The algebraic Eq. (6) relates the concentration of bound (CB) and free (CF) TNF to total TNF (CT).
The pharmacokinetic model in Fig. 5 was fit simultaneously to the pooled gold and Au–TNF blood concentration-time data (Fig. 6). The input data, CAu and CT, were expressed in percent of injected dose (%ID)/mL. The native TNF elimination constant, k2, and concentration at time zero, CN(0), were fixed at 0.026 min−1 and 0.005%ID/mL, respectively, estimated from a single compartment model fit. The initial values for the nonlinear regression analysis were CB(0)=CT(0)=CAu, and CF=0. The first-order elimination rate for gold (k1), hyperbolic time to 50% TNF release (t50), and time zero concentrations for gold (CAu(0)) and Au-TNF (CT(0)) were estimated by nonlinear least-squares regression analysis, using a 1/(Y*Y) weighting scheme. The estimated values for k1, t50, and CAu(0)=CT(0) were 0.0033±0.0001 min−1, 50±9 min, and 4.7±0.4% ID/mL (mean±SE).
Fig. 6.
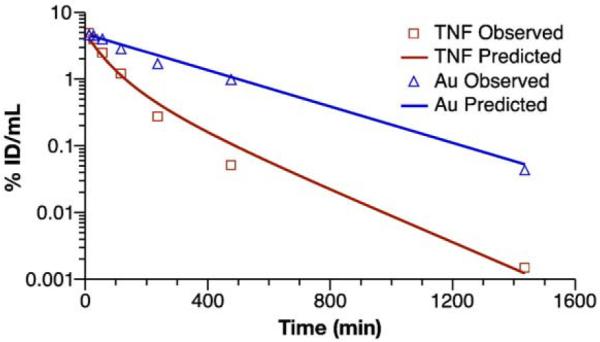
Au–TNF release model. The Au–TNF release model was fit to the pooled Au–TNF and gold(Au) blood concentration-time data, expressed as %ID/mL. Data are presented as mean (n=4–5). Lines represent the fit of the Au–TNF release model to the blood concentration time data.
The Au–TNF release model and estimated pharmacokinetic parameters were used to simulate hypothetical free TNF release from the Au–TNF complex (Fig. 7). The simulated maximal peak free TNF concentration was 25% of native TNF at 34 min post-dose. This is an example of how modeling and simulation can be used to predict the free drug profile for a nanoformulation. The modeled free drug profile can be used to relate toxicology and efficacy data to that of the unformulated drug if the toxic response and potency are caused by the free rather than the nanoparticle-bound drug component. The modeled free drug profile can inform decisions regarding the dosing regimen for preclinical efficacy and toxicology studies, as well as estimation of first-in-man dose.
Fig. 7.
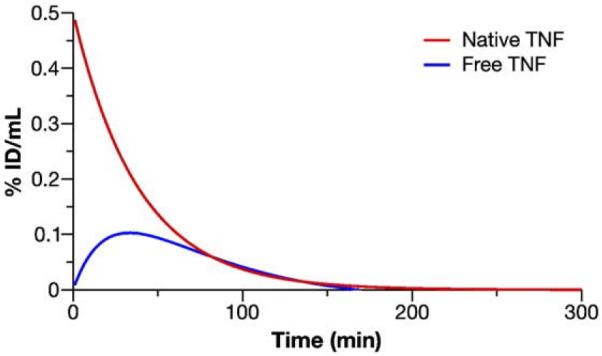
Au–TNF release model simulations. The native TNF and released free TNF blood concentration data were simulated using the Au–TNF release model and estimated pharmacokinetic parameters. Lines represent the simulated blood concentration-time data for the free TNF and native TNF comparison.
3.3.3. Extraction methods
While modeling and simulation of free drug profile is useful, analytical methods that can differentiate nanoparticle-encapsulated and free drug are still needed. Indeed, the FDA guidance for liposomal drug products specifically recommends the use of assays that can differentiate free and encapsulated drug fractions [30]. This is a challenging issue for regulators who must compare preclinical data arising from reformulated legacy drugs to preexisting data. As analytical methodology that can determine the free, and therefore active, drug component of a nanoparticle drug profile is often unavailable, regulators are left comparing composite (total=encapsulated and free) pharmacokinetics to that of the legacy's free drug profile. This makes regulatory evaluation difficult, as the existing legacy drug's preclinical and clinical data is normally relied upon to support safety of the new formulation [42].
In certain instances, researchers have been able to use previously established methods to measure free drug fraction in plasma. For example, ultracentrifugation has traditionally been used to measure the non-protein-bound fraction, and this method has been applied to the measurement of free paclitaxel fraction for Abraxane in plasma [43]. As Abraxane is a nanoformulation of paclitaxel, in which paclitaxel is complexed with nanoscale human albumin particulate, this is an instance where the non-protein-bound fraction is also a component of the non-nanoparticle-encapsulated drug fraction. It should be noted that this method does not measure total free drug, as it does not measure the protein-bound portion of the free drug fraction, which in the case of paclitaxel is greater than 90% of total free drug in plasma [44]. It is also not known how methods to measure non-protein-bound fraction, such as ultracentrifugation or equilibrium dialysis, would work for other, non-protein nanoplatforms.
Another way that researchers have overcome this issue of separation of free drug fraction is by using various extraction methods. As an example, Zamboni et al. have used reverse-phase extraction cartridges to differentiate free, bound and total drug in plasma, following administration of a nanoliposomal formulation of a comptothecin analogue to tumor bearing mice [45]. By using alternate aqueous and organic elution solvents, liposomal encapsulated and free drug, respectively, were eluted from the cartridge. These plasma extraction methods, together with tumor microdialysis, allowed comparison of free, bound and total drug profile for nanoliposome to that of the non-liposomal drug formulation, demonstrating prolonged exposure of tumor to free drug for the nanoliposomal formulation. In addition to solid phase extraction, heptane liquid–liquid extraction of plasma samples has also been used to separate free drug from polymer nanoparticle encapsulated drug [46]. Each of these extraction methods are dependent on the stability and chemistry of the platform and encapsulated drug. Further research into free drug extraction technologies, including development of more general methods that are applicable to a wide range of nanoparticles, is urgently needed.
3.4. Estimation of clinical starting dose
Currently, clinical starting doses for nanotechnology cancer drugs are estimated in a similar fashion to traditional cancer drugs. This means that the clinical starting dose is determined by dividing the estimated human equivalent dose (HED) of the rodent maximum tolerated dose (MTD) by a predetermined safety factor (see below). The reason for using the MTD in starting dose selection for oncology drugs is that chemotherapeutics are typically escalated until toxicity is observed for maximum treatment effect. As discussed above, nanoplatforms share many attributes in common with biologics, and in some cases dosing to pharmacologically appropriate blood concentration, as is often done for biologics, may be more appropriate than MTD-based dosing.
3.4.1. Fixed exponent
The HED for small molecule cancer drugs is typically determined by surface area (/m2) scaling of the rodent MTD, or the non-rodent MTD if 1/10th the rodent MTD is found to be toxic to the non-rodent species [27]. Scaling of HED from MTD by surface area assumes a body weight scaling exponent of 0.67, or HED=MTDrodent(body weighthuman/body weightrodent)(1–0.67). The reasoning for this comes from a study of traditional chemotherapeutics that observed toxicity to scale by body surface area [47]. However, reanalysis of the original Freirich et al. paper, with inclusion of additional data sets, suggests that scaling of MTD by 0.75 is more appropriate [48]. While the surface area conversion is a simple, straightforward scaling method, one should remember that the toxicity scaling by 0.75, not 0.67, is actually best justified by the available data.
The rodent MTD is generally considered the dose resulting in 10% lethality (or severe toxicity) (LD10). The standard safety factor to account for species differences between rodent and human is 10. However, this factor may be greater depending on the steepness of the dose–response curve, the novelty of the mechanism of drug action, the ability to monitor the target toxicities identified in the preclinical studies, and the reversibility of this toxicity [49]. This means that the starting dose, HED/10, is 10-fold lower than the scaled preclinical MTD, which generally corresponds to the preclinical maximum efficacious dose. Depending on the steepness of the efficacy dose–response, this 10-fold lower dose may still provide some therapeutic benefit during clinical safety trials, which is an important consideration for oncology trials. For example, in the case of hypothetical drug X (Fig. 8), the preclinical rat MTD is 100 μg/kg, the HED=MTDrat/6.2=16.1 μg/kg and the clinical starting dose=HED/10=1.61 μg/kg [49]. In this hypothetical, the clinical starting dose would still provide therapeutic benefit if the body surface area scaled clinical dose–response was similar to the preclinical dose–response, as the preclinical MTD/10 is greater than the effective dose 50%, ED50.
Fig. 8.
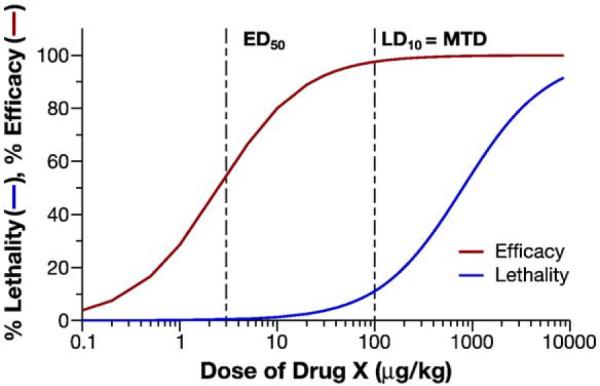
Hypothetical dose–response. Preclinical dose-efficacy/dose-toxicity profiles for hypothetical drug X are displayed: MTD, maximum tolerated dose ED50; effective dose 50=%; LD50, lethal dose 50%.
One potential problem with the above fixed exponent scaling approach is the validity of the assumption that the toxicity of nanotechnology drugs will also scale based on the surface area approximation, an assumption based on experience with small molecule cancer drugs. Macromolecular drugs, such as proteins, with molecular weights greater than 100,000 Da are generally scaled directly by body weight, in other words assuming a scaling exponent of 1 [49]. This scaling of high molecular weight drugs directly by body weight has to do with the fact that they do not undergo metabolism and often distribute into the plasma space. One might assume that nanoparticles will behave more similarly to macromolecules, as they also are not generally metabolized and distribute primarily into the plasma volume. As mentioned above, the volume of distribution for nanoplatforms is typically the plasma volume, approximately 4% of body weight. That means that interspecies doses based on body weight (mg/kg) will also achieve equivalent initial blood concentrations, as plasma space also scales directly by body weight.
Regardless of the arguments against surface area scaling, the novelty of nanotechnology platforms would dictate that the starting dose be scaled by the most conservative starting dose [49]. In other words, the clinical starting dose should be based on surface area and not direct mg/kg scaling. This means the clinical starting dose, accounting for surface area scaling and a safety factor of 10, will be ~100× lower than the preclinical MTD on a mg/kg body weight scale. Thus, the ideal clinical ED50 would have to be 100 times lower than the preclinical MTD in order to provide therapeutic benefit at the starting dose, if the assumption that dose scaling directly by body weight and not surface area is accurate. If this is not the case, and there is no therapeutic benefit at the planned clinical starting dose, a longer dose escalation would be required to evaluate efficacy and arrive at a true clinical MTD.
3.4.2. Allometric scaling
An alternative to the use of fixed-dose scaling exponents for determination of clinical starting dose for cancer drugs is by allometric scaling of MTD across species. In other words, scaling of MTD by species mass using the general powers equation, MTD=a*body weightb, where a and b are the constant and exponent of allometry, respectively, is the most accurate method [50]. As discussed above, scaling the MTD by surface area is an approximation of the true average exponent, 0.75, and even this exponent itself is an approximation. The true allometric scaling exponent of MTD for any given chemotherapeutic may not correspond to this 0.75 estimate [51]. For biologics, which are generally not dosed to MTD, the clinical starting dose can be estimated from the preclinical no-observable-adverse-effect level (NOAEL), the pharmacologically active dose, or by allometric scaling of preclinical pharmacokinetic data [49,52,53]. As mentioned above, nanoplatforms share many commonalities with biologics, and similar dosing may be appropriate. The most significant pharmacokinetic parameter influencing drug distribution is clearance, CL. Using the powers model, CL=a*body weightb, the ideal powers model scaling exponent for CL can be estimated from regression analysis of preclinical data from at least three species. The actual clinical starting dose can then be estimated from the predicted human clearance using the equation, Dosehuman=AUCanimal×CLhuman [53]. The unanswered question is: are nanoplatform pharmacokinetics scalable by allometry similar to small molecules and macromolecules? This would require that the determinants of nanoparticle disposition, such as RES sequestration, also scale by body weight. Preliminary data from NCL suggests that this may be the case.
Clearance data from pharmacokinetic studies of colloidal gold bound TNF in rabbit, rat and oncology patients were retrospectively scaled by allometric analysis, using the power model (see methods for experimental details of underlying interspecies pharmacokinetics). While the resulting powers model clearance equation, CL=2.09*BW1.43 (R2=0.957), was not predictive of human clearance (Fig. 9), following the recommendation from Mahmood's “rule of exponents” for macromolecular drugs improved predictability. Mahmood's “rule of exponents” states that for power model CL exponents >1.0, the brain weight×CL product, CL=a*body weightb/brain weight, can improve predictability of human clearance [52,53]. Indeed, similar to macromolecular therapeutics, brain weight (BrW) × CL product scaling, CL=0.011*BW2.18/BrW (R2=1.000), dramatically improved the correlation coefficient for the interspecies clearance model (Fig. 10). Using the predicted human clearance, 92 mL/min, the estimated clinical starting dose calculated from the lowest AUC using the rabbit data was, Dosehuman=8 μg TNF*min/ml×92 mL/min=736 ug TNF, or 9.8 μg TNF/kg. This 9.8 μg TNF/kg estimated clinical starting dose falls at the midpoint of the actual clinical range that was eventually evaluated using body surface area conversion of the rabbit MTD, 1.4–16.2 μg TNF/kg.
Fig. 9.

Allometric Scaling of Au–TNF by the Power Model. The clearance data for the CytImmune Au–TNF formulation in multiple species were fit to the power equations CL=a*BWb. Data points are presented as the mean (n=2) of two clinical and rabbit dose levels, and the single estimate from a single rat dose level. Lines represent the fit of the model to the preclinical data, excluding the clinical data.
Fig. 10.
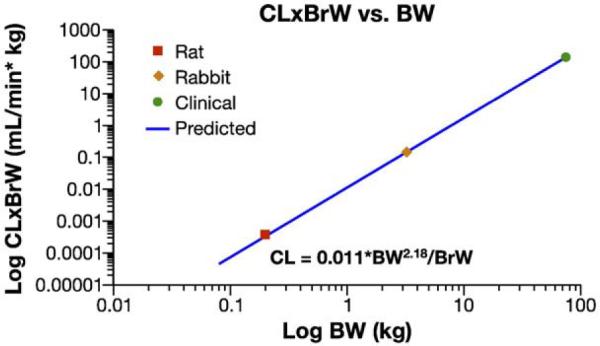
Allometric scaling of Au–TNF by the brain weight (BrW) product model. The clearance data were fit to the power equations BrW×CL=a*BWb. Data points are presented as the mean (n=2) for both human and rabbit dose levels, and the single estimate for rat. Lines represent the fit of the model to all data.
3.4.3. Physiologically based pharmacokinetic modeling
An additional method for estimation of clinical starting dose is physiologically-based pharmacokinetic (PBPK) modeling. The PBPK method has been used for both small molecules and macromolecules, such as antibodies [54–57], and could have potential for nanotechnology platforms as well. In the past, small molecule PBPK modeling has been shown to be more predictive of human pharmacokinetics than allometry [58]. At this time, the few examples of PBPK modeling of nanoparticles in the literature are limited to inhalation exposure assessment [59–61].
The PBPK approach for estimation of clinical pharmacokinetics requires extensive tissue concentration-time profile data from preclinical studies. For nanotechnology, the relevant systemic models and model parameters to apply are unknown. Unlike small molecules, and similar to macromolecules, nanoplatforms do not diffuse freely into tissues. This means tissue partitioning coefficients used for small molecule models are not likely to be relevant. As in many of the previous discussions, again it would appear that nanoparticles should be treated similar to biologics [54,55,57]: 1) tissue uptake should be diffusion limited; 2) tissue binding should have both a selective and saturable component, and a non-selective and non-saturable component; 3) multiple pore models of extravasation may be more representative. The PBPK model problems/questions may also be similar to those for macromolecules [57]: 1) how to model selective uptake and saturability (i.e., opsonization and RES saturation), as well as non-specific uptake? 2) How to model metabolism/clearance? 3) How do these model parameters vary across species? The development of necessary PBPK models to allow for estimation of clinical starting dose for nanoplatforms is going to require a much deeper understanding of nanomaterial-biological interaction than is presently available.
4. Summary
In summary, the study of nanomedicines is an active area of preclinical research, with many important aspects that are not widely appreciated. While selective biodistribution is the primary basis for improvements in therapy and imaging by nanomedicines over small molecules, this can also result in altered toxicity profiles and present challenges for pharmacokinetic evaluation. These issues must be considered when designing and interpreting preclinical studies. Biologics, which have more in common with nanomedicines than with small molecules, appear to offer clues as to how to approach some of these issues, such as biologic potency and interspecies dose scaling. Platform stability is an issue that is unique to nanomedicine, and very important for both preclinical development and clinical translation. Greater research focus should be applied to this area, as the current methods are often inadequate, allowing for only approximations and estimates. With an ever increasing number of nanomedicines entering clinical study, a consensus as to what are the important preclinical issues and how to best address these issues is taking shape.
Acknowledgements
This project has been funded in whole or in part with federal funds from the National Cancer Institute, National Institutes of Health, under contract HHSN261200800001E. The content of this publication does not necessarily reflect the views or policies of the Department of Health and Human Services, nor does mention of trade names, commercial products, or organizations imply endorsement by the U.S. Government.
Abbreviations
- (API)
active pharmaceutical ingredient
- (EPR)
enhanced permeability and retention effect
- (ADME)
absorption distribution metabolism excretion
- (RES)
reticuloendothelial system
- (PIM)
pulmonary intravascular macrophage
References
- [1].McNeil SE. Nanotechnology for the biologist. J. Leukoc. Biol. 2005;78:585–594. doi: 10.1189/jlb.0205074. [DOI] [PubMed] [Google Scholar]
- [2].Sandanaraj BS, Gremlich HU, Kneuer R, Dawson J, Wacha S. Fluorescent nanoprobes as a biomarker for increased vascular permeability: implications in diagnosis and treatment of cancer and inflammation. Bioconjugate Chem. 2010;21:93–101. doi: 10.1021/bc900311h. [DOI] [PubMed] [Google Scholar]
- [3].Akiyama Y, Mori T, Katayama Y, Niidome T. The effects of PEG grafting level and injection dose on gold nanorod biodistribution in tumor-bearing mice. J. Control. Release. 2009;139:81–84. doi: 10.1016/j.jconrel.2009.06.006. [DOI] [PubMed] [Google Scholar]
- [4].Thomas TP, Ye JY, Chang YC, Kotlyar A, Cao Z, Majoros IJ, Norris TB, Baker JR. Investigation of tumor cell targeting of a dendrimer nanoparticle using a double-clad optical fiber probe. J. Biomed. Opt. 2008;13:014024. doi: 10.1117/1.2870105. [DOI] [PubMed] [Google Scholar]
- [5].Hussain S, Pluckthun A, Allen TM, Zangemeister-Wittke U. Antitumor activity of an epithelial cell adhesion molecule targeted nanovesicular drug delivery system. Mol. Cancer Ther. 2007;6:3019–3027. doi: 10.1158/1535-7163.MCT-07-0615. [DOI] [PubMed] [Google Scholar]
- [6].Niihara R, Balakrishnan K. Bringing nanomedicines to market: regulatory challenges, opportunities, and uncertainties. Nanomedicine. 2006;2:127–136. doi: 10.1016/j.nano.2006.04.005. [DOI] [PubMed] [Google Scholar]
- [7].Zolnik BS, Sadrieh N. Regulatory perspective on the importance of ADME assessment of nanoscale material containing drugs. Adv. Drug Deliv. Rev. 2009;61:422–427. doi: 10.1016/j.addr.2009.03.006. [DOI] [PubMed] [Google Scholar]
- [8].Oberdorster G. Safety assessment for nanotechnology and nanomedicine: concepts of nanotoxicology. J. Intern. Med. 2010;267:89–105. doi: 10.1111/j.1365-2796.2009.02187.x. [DOI] [PubMed] [Google Scholar]
- [9].Patri AK, Dobrovolskaia MA, Stern ST, McNeil SE. Preclinical characterization of engineered nanoparticles intended for cancer therapeutics. In: Amiji M, editor. Nanotechnology for Cancer Therapy. CRC Press; Boca Raton, Florida: 2006. pp. 105–138. [Google Scholar]
- [10].National Research Council . Guide for Care and Use of Laboratory Animals. National Academy Press; Washington, D.C: 1996. [Google Scholar]
- [11].FDA. ICH . Guidance for Industry, S9 Nonclinical Evaluation for Anticancer Pharmaceuticals. U.S. Department of Health and Human Services, Food and Drug Administration, Center for Drug Evaluation and Research (CDER), Center for Biologics Evaluation and Research (CBER); Rockville, MD: Feb, 2009. [Google Scholar]
- [12].Johnson JI, Decker S, Zaharevitz D, Rubinstein LV, Venditti JM, Schepartz S, Kalyandrug S, Christian M, Arbuck S, Hollingshead M, Sausville EA. Relationships between drug activity in NCI preclinical in vitro and in vivo models and early clinical trials. Br. J. Cancer. 2001;84:1424–1431. doi: 10.1054/bjoc.2001.1796. [DOI] [PMC free article] [PubMed] [Google Scholar]
- [13].Igarashi E. Factors affecting toxicity and efficacy of polymeric nanomedicines. Toxicol. Appl. Pharmacol. 2008;229:121–134. doi: 10.1016/j.taap.2008.02.007. [DOI] [PubMed] [Google Scholar]
- [14].Levin AA. A review of the issues in the pharmacokinetics and toxicology of phosphorothioate antisense oligonucleotides. Biochim. Biophys. Acta. 1999;1489:69–84. doi: 10.1016/s0167-4781(99)00140-2. [DOI] [PubMed] [Google Scholar]
- [15].FDA. ICH . Guidance for Industry, S6 Preclinical Safety Evaluation of Biotechnology-Derived Pharmaceuticals. U.S. Department of Health and Human Services, Food and Drug Administration, Center for Drug Evaluation and Research (CDER), Center for Biologics Evaluation and Research (CBER); Rockville, MD: Jul, 1997. [Google Scholar]
- [16].Dobrovolskaia MA, Aggarwal P, Hall JB, McNeil SE SE. Preclinical studies to understand nanoparticle interaction with the immune system and its potential effects on nanoparticle biodistribution. Mol. Pharm. 2008;5:487–495. doi: 10.1021/mp800032f. [DOI] [PMC free article] [PubMed] [Google Scholar]
- [17].Winkler GC. Pulmonary intravascular macrophages in domestic animal species: review of structural and functional properties. Am. J. Anat. 1988;181:217–234. doi: 10.1002/aja.1001810302. [DOI] [PubMed] [Google Scholar]
- [18].Brain JD, Molina RM, DeCamp MM, Warner AE. Pulmonary intravascular macrophages: their contribution to the mononuclear phagocyte system in 13 species. Am. J. Physiol. 1999;276:L146–L154. doi: 10.1152/ajplung.1999.276.1.L146. [DOI] [PubMed] [Google Scholar]
- [19].FDA . Guidance for Industry, Single Dose Acute Toxicity Testing for Pharmaceuticals. U.S. Department of Health and Human Services, Food and Drug Administration, Center for Drug Evaluation and Research (CDER); Rockville, MD: Aug, 1996. [Google Scholar]
- [20].Gad SC. Testing guidelines and subchronic and chronic toxicity studies. In: Gad SC, editor. Drug Safety Evaluation. 1st ed. John Wiley & Sons; New York: 2002. pp. 56–59.pp. 241–243. [Google Scholar]
- [21].Current Step 4 version. Jun 11, 2009. ICH Harmonised tripartite guideline, guidance on nonclinical safety studies for the conduct of human clinical trials and marketing authorization for pharmaceuticals M3(R2) [Google Scholar]
- [22].De Jong WH, Hagens WI, Krystek P, Burger MC, Sips AI, Geertsma RE. Particle size-dependent organ distribution of gold nanoparticles after intravenous administration. Biomaterials. 2008;29:1912–1919. doi: 10.1016/j.biomaterials.2007.12.037. [DOI] [PubMed] [Google Scholar]
- [23].Cho M, Cho WS, Choi M, Kim SJ, Han BS, Kim SH, Kim HO, Sheen YY, Jeong J. The impact of size on tissue distribution and elimination by single intravenous injection of silica nanoparticles. Toxicol. Lett. 2009;189:177–183. doi: 10.1016/j.toxlet.2009.04.017. [DOI] [PubMed] [Google Scholar]
- [24].Liu D, Mori A, Huang L. Role of liposome size and RES blockade in controlling biodistribution and tumor uptake of GM1-containing liposomes. Biochim. Biophys. Acta. 1992;1104:95–101. doi: 10.1016/0005-2736(92)90136-a. [DOI] [PubMed] [Google Scholar]
- [25].Borchardt G, Brandriss S, Kreuter J, Margel S. Body distribution of 75Se-radiolabeled silica nanoparticles covalently coated with omega-functionalized surfactants after intravenous injection in rats. J. Drug Target. 1994;2:61–77. doi: 10.3109/10611869409015894. [DOI] [PubMed] [Google Scholar]
- [26].FDA . Guidance for Industry, Developing Medical Imaging Drug and Biological Products Part 1: Conducting Safety Assessments. U.S. Department of Health and Human Services Food and Drug Administration Center for Drug Evaluation and Research (CDER), Center for Biologics Evaluation and Research (CBER); Rockville, MD: Jun, 2004. [Google Scholar]
- [27].DeGeorge JJ, Ahn CH, Andrews PA, Brower ME, Giorgio DW, Goheer MA, Lee-Ham DY, McGuinn WD, Schmidt W, Sun CJ, Tripathi SC. Regulatory considerations for preclinical development of anticancer drugs. Cancer Chemother. Pharmacol. 1998;41:173–185. doi: 10.1007/s002800050726. [DOI] [PubMed] [Google Scholar]
- [28].Manil L, Couvreur P, Mahieu P. Acute renal toxicity of doxorubicin (adriamycin)-loaded cyanoacrylate nanoparticles. Pharm. Res. 1995;12:85–87. doi: 10.1023/a:1016290704772. [DOI] [PubMed] [Google Scholar]
- [29].Charrois GJ, Allen TM. Rate of biodistribution of STEALTH liposomes to tumor and skin: influence of liposome diameter and implications for toxicity and therapeutic activity. Biochim. Biophys. Acta. 2003;1609:102–108. doi: 10.1016/s0005-2736(02)00661-2. [DOI] [PubMed] [Google Scholar]
- [30].FDA . Guidance for Industry, Liposome Drug Products: Chemistry, Manufacturing, and Controls; Human Pharmacokinetics and Bioavailability; and Labeling Documentation. U.S. Department of Health and Human Services Food and Drug Administration, Center for Drug Evaluation and Research (CDER); Rockville, MD: Aug, 2002. [Google Scholar]
- [31].ASTM F750–87 Standard Practice for Evaluating Material Extracts by Systemic Injection in the Mouse. 2002. [Google Scholar]
- [32].ASTM F619–03 Standard Practice for Extraction of Medical Plastics. 2008. [Google Scholar]
- [33].FDA. ICH . Guideline for Industry Pharmacokinetics: Guidance for Repeated Dose Tissue Distribution Studies. U.S. Department of Health and Human Services, Food and Drug Administration, Center for Drug Evaluation and Research (CDER); Rockville, MD: Mar, 1995. [Google Scholar]
- [34].Trethewey J. Bio-assays for the analysis of insulin. J. Pharm. Biomed. Anal. 1989;7:189–197. doi: 10.1016/0731-7085(89)80083-4. [DOI] [PubMed] [Google Scholar]
- [35].FDA . Guidance for Industry Potency Tests for Cellular and Gene Therapy Products. U.S. Department of Health and Human Services, Food and Drug Administration, Center for Biologics Evaluation and Research (CBER); Rockville, MD: Oct, 2008. [Google Scholar]
- [36].Myc A, Douce TB, Ahuja N, Kotlyar A, Kukowska-Latallo J, Thomas TP, Baker JR., Jr. Preclinical antitumor efficacy evaluation of dendrimer-based methotrexate conjugates. Anticancer Drugs. 2008;19:143–149. doi: 10.1097/CAD.0b013e3282f28842. [DOI] [PubMed] [Google Scholar]
- [37].Bae Y, Nishiyama N, Fukushima S, Koyama H, Yasuhiro M, Kataoka K. Preparation and biological characterization of polymeric micelle drug carriers with intracellular pH-triggered drug release property: tumor permeability, controlled subcellular drug distribution, and enhanced in vivo antitumor efficacy. Bioconjug. Chem. 2005;16:122–130. doi: 10.1021/bc0498166. [DOI] [PubMed] [Google Scholar]
- [38].Purushotham S, Ramanujan RV. Thermoresponsive magnetic composite nanomaterials for multimodal cancer therapy. Acta Biomater. 2010;6(no. 2):502–510. doi: 10.1016/j.actbio.2009.07.004. [DOI] [PubMed] [Google Scholar]
- [39].Zolnik BS, Stern ST, Kaiser JM, Heakal Y, Clogston JD, Kester M, McNeil SE. Rapid distribution of liposomal short-chain ceramide in vitro and in vivo. Drug Metab. Dispos. 2008;36(no. 8):1709–1715. doi: 10.1124/dmd.107.019679. [DOI] [PubMed] [Google Scholar]
- [40].Weiss HM, Fresneau M, Camenisch GP, Kretz O, Gross G. In vitro blood distribution and plasma protein binding of the iron chelator deferasirox (ICL670) and its iron complex Fe-[ICL670]2 for rat, marmoset, rabbit, mouse, dog, and human. Drug Metab. Dispos. 2006;34:971–975. doi: 10.1124/dmd.105.006429. [DOI] [PubMed] [Google Scholar]
- [41].Harashima H, Iida S, Urakami Y, Tsuchihashi M, Kiwada H. Optimization of antitumor effect of liposomally encapsulated doxorubicin based on simulations by pharmacokinetic/pharmacodynamic modeling. J. Control. Release. 1999;61:93–106. doi: 10.1016/s0168-3659(99)00110-8. [DOI] [PubMed] [Google Scholar]
- [42].FDA . Guidance for Industry, Nonclinical Safety Evaluation of Reformulated Drug Products and Products Intended for Administration by an Alternate Route. U.S. Department of Health and Human Services, Food and Drug Administration Center for Drug Evaluation and Research (CDER); Rockville, MD: Mar, 2008. [Google Scholar]
- [43].Gardner ER, Dahut W, Figg WD. Quantitative determination of total and unbound paclitaxel in human plasma following Abraxane treatment. J. Chromatogr. B. Analyt. Technol. Biomed. Life Sci. 2008;862:213–218. doi: 10.1016/j.jchromb.2007.12.013. [DOI] [PMC free article] [PubMed] [Google Scholar]
- [44].Sonnichsen DS, Relling MV. Clinical pharmacokinetics of paclitaxel. Clin. Pharmacokinet. 1994;27:256–269. doi: 10.2165/00003088-199427040-00002. [DOI] [PubMed] [Google Scholar]
- [45].Zamboni WC, Strychor S, Joseph E, Walsh DR, Zamboni BA, Parise RA, Tonda ME, Yu NY, Engbers C, Eiseman JL. Plasma, tumor, and tissue disposition of STEALTH liposomal CKD-602 (S-CKD602) and nonliposomal CKD-602 in mice bearing A375 human melanoma xenografts. Clin. Cancer. Res. 2007;13:7217–7223. doi: 10.1158/1078-0432.CCR-07-1035. [DOI] [PubMed] [Google Scholar]
- [46].Zhao X, Mou D, Wan J, Xu H, Yang X. A novel method for the separation and determination of non-encapsulated pyrene in plasma and its application in pharmacokinetic studies of pyrene-loaded MPEG-PLA based nanoparticles. Nanotechnology. 2009;20:12570. doi: 10.1088/0957-4484/20/12/125701. [DOI] [PubMed] [Google Scholar]
- [47].Freireich EJ, Gehan EA, Rall DP, Schmidt LH, Skipper HE. Quantitative comparison of toxicity of anticancer agents in mouse, rat, hamster, dog, monkey, and man. Cancer Chemother. 1966;50(no. 4):219–244. [PubMed] [Google Scholar]
- [48].Travis CC, White RK. Interspecific scaling of toxicity data. Risk Anal. 1988;8:119–125. doi: 10.1111/j.1539-6924.1988.tb01158.x. [DOI] [PubMed] [Google Scholar]
- [49].FDA . Guidance for Industry, Estimating the Maximum Safe Starting Dose in Initial Clinical Trials for Therapeutics in Adult Healthy Volunteers. U.S. Department of Health and Human Services, Food and Drug Administration, Center for Drug Evaluation and Research (CDER); Rockville, MD: Jul, 2005. [Google Scholar]
- [50].Mahmood I. Interspecies scaling of maximum tolerated dose of anticancer drugs: relevance to starting dose for phase I clinical trials. Am. J. Ther. 2001;8:109–116. doi: 10.1097/00045391-200103000-00005. [DOI] [PubMed] [Google Scholar]
- [51].Watanabe K, Bois FY, Zeise L. Interspecies extrapolation: a reexamination of acute toxicity data. Risk Anal. 1992;12:301–310. doi: 10.1111/j.1539-6924.1992.tb00677.x. [DOI] [PubMed] [Google Scholar]
- [52].Mahmood I. Interspecies scaling of protein drugs: prediction of clearance from animals to humans. J. Pharm. Sci. 2004;93:177–185. doi: 10.1002/jps.10531. [DOI] [PubMed] [Google Scholar]
- [53].Mahmood I. Pharmacokinetic allometric scaling of antibodies: Application to the first-in-human dose estimation. J. Pharm. Sci. 2009;98(no. 10):3850–3861. doi: 10.1002/jps.21682. [DOI] [PubMed] [Google Scholar]
- [54].Baxter LT, Zhu H, Mackensen DG, Butler WF, Jain RK. Biodistribution of monoclonal antibodies: Scale-up from mouse to human using a physiologically based pharmacokinetic model. Cancer Res. 1995;55:4611–4622. [PubMed] [Google Scholar]
- [55].Davda JP, Jain M, Batra SK, Gwilt PR, Robinson DH. A physiologically based pharmacokinetic (PBPK) model to characterize and predict the disposition of monoclonal antibody CC49 and its single chain Fv constructs. Int. Immunopharmacol. 2008;8:401–413. doi: 10.1016/j.intimp.2007.10.023. [DOI] [PubMed] [Google Scholar]
- [56].Luttringer O, Theil FP, Poulin P, Schmitt-Hoffmann AH, Guentert TW, Lavé T. Physiologically based pharmacokinetic (PBPK) modeling of disposition of epiroprim in humans. J. Pharm. Sci. 2003;92:1990–2007. doi: 10.1002/jps.10461. [DOI] [PubMed] [Google Scholar]
- [57].Heiskanen T, Kairemo K. Development of a PBPK model for monoclonal antibodies and simulation of human and mice PBPK of a radiolabelled monoclonal antibody. Curr. Pharm. Des. 2009;15:988–1007. doi: 10.2174/138161209787581968. [DOI] [PubMed] [Google Scholar]
- [58].Parrott N, Jones JH, Paquereau N, Lavé T. Application of full physiological models for pharmaceutical drug candidate selection and extrapolation of pharmacokinetics to man. Basic Clin. Pharmacol. Toxicol. 2005;96:193–199. doi: 10.1111/j.1742-7843.2005.pto960308.x. [DOI] [PubMed] [Google Scholar]
- [59].Liao CM, Chiang YH, Chio CP. Model-based assessment for human inhalation exposure risk to airborne nano/fine titanium dioxide particles. Sci. Total. Environ. 2008;407:165–177. doi: 10.1016/j.scitotenv.2008.09.028. [DOI] [PubMed] [Google Scholar]
- [60].Liao CM, Chiang YH, Chio CP. Assessing the airborne titanium dioxide nanoparticle-related exposure hazard at workplace. J. Hazard Mater. 2009;162:57–65. doi: 10.1016/j.jhazmat.2008.05.020. [DOI] [PubMed] [Google Scholar]
- [61].Shelley ML, Wagner AJ, Hussain SM, Bleckmann C. Modeling the in vivo case with in vitro nanotoxicity data. Int. J. Toxicol. 2008;27:359–367. doi: 10.1080/10915810802503487. [DOI] [PubMed] [Google Scholar]