

Abstract
Arfs (ADP ribosylation factors) are N-myristoylated GTP/GDP switch proteins playing key regulatory roles in vesicle transport in eukaryotic cells. ARFs execute their roles by anchoring to membrane surfaces where they interact with other proteins to initiate budding and maturation of transport vesicles. However, existing structures of Arf•GTP are limited to non-myristoylated and truncated forms with impaired membrane binding. We report a high resolution NMR structure for full-length myristoylated yeast (Saccharomyces cerevisiae) Arf1 in complex with a membrane mimic. The two domain structure, in which the myristoylated N-terminal helix is separated from the C-terminal domain by a flexible linker, suggests a level of adaptability in binding modes for the myriad of proteins with which Arf interacts, and allows predictions of specific lipid binding sites on some of these proteins.
Arf (ADP ribosylation factor) family proteins are N-myristoylated GDP/GTP switches that are intimately involved in the regulation of vesicular transport of lipids and proteins between sites of synthesis in the endoplasmic reticulum, sites of posttranslational modification in the Golgi, and sites of action at virtually all other membranes in eukaryotes1–4. In the course of this activity they must interact sequentially (or perhaps simultaneously) with combinations of (i) guanine nucleotide exchange factors (GEFs) and lipids that catalyze their activation5, (ii) protein adaptors that modulate recruitment of cargo into nascent buds6, (iii) lipid modifying enzymes, and (iv) GTPase activating proteins (GAPs)7, each of which are required for the budding and maturation of transport carriers. The basic structural changes in ARFs resulting from GDP/GTP exchange, and some structural aspects of Arf association with effector, activator, and adaptor proteins have been established by X-ray crystallography over the past two decades8–12. However, all data have been collected in the absence of the membrane structures on which Arfs act, and in the absence of the myristoylated N-terminal peptide responsible for membrane interaction. This leaves unanswered many key aspects of how GDP/GTP exchange promotes membrane association of Arf and how specific interactions with membrane lipids and membrane resident proteins are regulated.
We report here a high-resolution structure of myristoylated yeast Arf1•GTP in association with a membrane mimetic. The mimetic is a lipid bilayer-like micelle (often called a bicelle) composed of dimyristoylphosphatidylcholine (DMPC) and dihexanoylphosphatidylcholine (DHPC), which, unlike many commonly used single-chain detergents, maintains a native structure for the cytosolic domain of Arf and allows structural investigation of an otherwise insoluble myristoylated Arf•GTP. The procedures used to determine the structure and dynamics of the resulting 70 kDa complex rely on modern high-resolution NMR methodology. Comparison of the resulting membrane associated structure to our recently reported structure of soluble myristoylated yeast Arf1•GDP13 gives new insight into structural consequences of GDP/GTP exchange at the myristoyl binding site in Arf. The structure also provides a rationalization for the long suspected tendency of GTP loaded Arfs to promote and stabilize the curved surfaces of budding vesicles, and the positioning of the C-terminal domain on the membrane surface provides a structural basis for known interactions with activators, adaptors, other effectors, and GAP proteins.
RESULTS
General structural and dynamic features
The structure of activated (GTP-bound) yeast myr-Arf1 bound to a membrane mimetic was determined by solution NMR methodologies. The primary data included nuclear Overhauser effects (NOEs) on perdeuterated preparations with site-specific protonation, residual dipolar couplings (RDCs) from 15N-1H, 15N-13C′, and certain phenyl 13C-1H bonded pairs, and torsional constraints from backbone chemical shift data. Details relating to these data along with structure quality statistics are detailed in Table 1. Examples of NMR data are given in Supplementary Figures 1 and 2. Figure 1a of the main text shows a superposition of 20 structures produced by a simulated annealing protocol using these data as constraints. The C terminus (Glu17-Leu177) shows a compact α plus β fold as seen in previously reported Arf•GTP structures 9,12. The N terminus, which was absent in previous GTP-liganded structures, shows a well formed α-helix (residues Leu3-Phe13) that was not observed in myr-yArf1•GDP 13 and is longer than the short helix observed in the crystal structure of non-myristoylated yArf2•GDP (PDB: 1mr3) 14.
Table 1.
NMR and refinement statistics for myr-yARF1•GTP
| myr-yARF1•GTP | ||
|---|---|---|
| NMR distance and dihedral constraints | ||
| Distance constraints | ||
| Total NOE | 649 | |
| Intra-residue | 68 | |
| Inter-residue | ||
| Sequential (|i – j| = 1) | 196 | |
| Medium-range (|i – j| < 5) | 143 | |
| Long-range (|i – j| > 4) | 159 | |
| Ambiguous | 58 | |
| Arf-myristoyl | 19 | |
| Arf-GTPγS | 6 | |
| PREsa | 401 | |
| Hydrogen bond restraints | 154 | |
| Total dihedral angle restraints | ||
| φ | 120 | |
| ψ | 121 | |
| RDCs (neutral, negative, positive)b | 124, 219, 178 | |
| Structure statistics | ||
| Violations (mean ± s.d.) | ||
| Distance constraints (Å) | 0.028 ± 0.002 | |
| Dihedral angle constraints (°) | 0.700 ± 0.045 | |
| Max. dihedral angle violation (°) | 4.638 ± 0.549 | |
| Max. distance constraint violation (Å) | 0.307 ± 0.092 | |
| Deviations from idealized geometry | ||
| Bond lengths (Å) | 0.002 ± 0.000 | |
| Bond angles (°) | 0.402 ± 0.007 | |
| Impropers (°) | 0.313 ± 0.008 | |
| Q factorsc | ||
| PRE | 0.306 ± 0.005 | |
| RDC | N terminusd | C terminusd |
| Neutral gel | 0.21 ± 0.01 | 0.26 ± 0.01 |
| Negative gel | 0.23 ± 0.02 | 0.26 ± 0.00 |
| Positive gel | 0.31 ± 0.05 | 0.26 ± 0.01 |
| Average pairwise r.m.s. deviatione (Å) | N terminusd | C terminusd |
| Heavy | 0.331 | 0.463 |
| Backbone | 1.207 | 1.437 |
Only PREs on the C-terminal protons are summarized in the table. See Figure 4 for PREs on the N terminus and their fitting qualities.
RDCs collected in neutral, negatively-charged, and positively charged poly-acrylamide gels are separately summarized in the table.
Definitions of PRE and RDC Q factors are given in the literature26,50. NC′ and CH RDCs are scaled to NH RDCs for the calculation of Q factors.
N terminus contains Gly2-Phe13; C terminus contains Glu17-Leu177.
Pairwise r.m.s. deviation was calculated among 20 refined structures.
Figure 1.

Structure of myr-yArf1•GTP in a bicelle solution. (a) Twenty lowest-energy structures of myr- yArf1•GTP out of 60 calculations are superimposed through the C terminus (Glu17 to Leu177). The primary sequence of yeast Arf1 is displayed on top with residues corresponding to the important structural landmarks such as N terminus, linker, switches, and secondary structural elements colored in the same scheme as in the superimposed structures. (b) Structural overlay of the C terminus (residues 18–181) of myr-yArf1•GTP (red), Arf1•GTP-Δ17-Q71L (blue, PDB: 1o3y), and myr-yArf1•GDP (yellow, PDB: 2k5u), highlighting the conformational differences of Switch I, Switch II, and the inter-switch loopλ3. (c) Solvent accessible surface representations of myr-yArf1•GDP (left) and myr-yArf1•GTP (right). The residues lining the myristoyl binding pocket of myr-yArf1•GDP are colored yellow. (d) Left: N-terminal structures of myr-yArf1•GTP (red) and yArf2•GDP (blue, PDB: 1mr3). The helix of myr-yArf1•GTP is significantly longer than that of yArf2•GDP, despite the small difference in primary sequence, i.e. Phe4 of yArf1 is replaced by a tyrosine in yArf2. The myristoyl group is shown in purple and phenylalanine side chains in yellow. Middle and right: Surface representations of the amphipathic N terminus of myr-yArf1•GTP highlighting the hydrophobic (yellow) and hydrophilic (blue) surfaces.
Several pieces of evidence suggest that the N terminus behaves as a dynamic domain, moving surprisingly independently of the C-terminal domain. The absence of NOEs between N- and C-terminal residues suggests this and is the primary reason for the non-converging N-terminal distribution shown in Figure 1a. RDCs, which are normally able to constrain domain positions in the absence of NOEs, also prove to be incompatible with a single relative orientation of the two domains. When RDCs for the two domains are analyzed separately, the order tensors for the C- and N-terminal domains have different principal order and asymmetry parameters indicating that the two domains have different mobilities. The values are −8×10⁻⁴/0.43 and −4.4×10⁻⁴/0.91, respectively for bicelle associated Arf oriented in a negatively charged gel; these convert to NH RDC amplitudes and rhombicities commonly used in structure determination programs, of 8.6Hz/0.29 and 4.7Hz/0.61. The RDCs, in fact, had to be treated separately for the two regions during the structural calculations that produced the results shown in Figure 1a.
Before discussing in detail the N- and C-terminal structures as illustrated in Figure 1 some motional time scale evidence further supporting inter-domain motion, as well as lipid association through the N-terminus, can be provided. In particular, residue-specific motional correlation times (τcs) associated with the reorientation of 1H-15N amide bonds15 show different mobilities for the N- and C-termini (see Fig. 2). In the presence of a 10% (w/v) DMPC/DHPC mixture with [DMPC]:[DHPC] = 0.25 (q) the N-terminal domain shows an average τc of 21ns while the C-terminal domain shows an average τc of 30ns (Fig. 2, circles). Even shorter correlation times are observed for the linker region that connects the N- and C-termini (Gly14, Asn15, and Lys16), which further supports weak coupling of the two domains. Given the expected membrane association through the N terminus and myristoyl chain16,17 one might have expected longer correlation times for the N-terminal domain. However, bicelles can be quite small; ideal bicelle models predict a bicelle disk with a radius of 24 Å and thickness of 40 Å at q = 0.2518, but recent NMR studies suggest that the actual size could be substantially smaller19. Also, interiors of lipid bilayers can be quite fluid. This could easily facilitate rapid movement of the N terminus, even when associated with the bicelle.
Figure 2.

Lipid interaction of myr-yArf1 studied through rotational correction times (τc). The residual specific correlation times myr-yArf1•GTP with bicelles of [DMPC]:[DHPC] (q) = 0.25, 0.5 and 1.0 are plotted with open circles, solid triangles, and open squares. The total DMPC/DHPC content is fixed at 10% (w/v) in all assays to minimize viscosity differences.
To confirm bicelle association through the N-terminal domain, the size of the bicelle was systematically increased by raising the ratio of DMPC to DHPC (q) from 0.25 to 1.0 (Fig. 2, circles and squares). The correlation times of both the N- and C-termini increase with bicelle size, as expected on binding of Arf to the bicelles, but the increase is more pronounced for the N-terminal domain. At a q = 1.0, the τcs are nearly equal for the N- and C-terminal domains (41 and 46 ns respectively). The higher sensitivity of the N terminus to the bicelle size confirms that Arf•GTP primarily makes use of the myristoyled N terminus to bind lipids.
Bicelle associated structure of the C terminus
Given the dynamic separation of Arf1•GTP into an N-terminal, bicelle-associated domain and a C-terminal catalytic domain, it is logical to present further structural details for these domains separately. At a more detailed level the C-terminal domain of myr-yArf1•GTP (Fig. 1b, red) is found to adopt a conformation markedly different from the corresponding part of myr- yArf1•GDP 13 (Fig. 1b, yellow, backbone RMSD: 4.6Å). However, the structure is quite similar to that found in the crystal structure of mouse Arf1•GTP-Δ17-Q71L 9 (Fig. 1b, blue, backbone RMSD: 1.5 Å). The structural differences between GDP- and GTP-bound forms are mostly seen in the Switch I, Switch II and inter-switch λ3-loop regions. These differences are similar to those that have been described in the literature based on crystal structures of the non-myristoylated and N-terminal truncated human ARF1 12.
The presence of the myristoyl group in our previous structure of yArf1•GDP and the GTP form reported here allow a more detailed assessment of the coupling of Switch I and Switch II movements to displacement of the myristoyl chain. Figure 1c (left) shows the surface of residues contacted by the myristoyl chain in the GDP form (highlighted in yellow). These residues are covered by the N-myristate which may be further covered by residues from the N-terminal segment. However, resonances from the N-terminal segment are not observed in myr-Arf•GDP samples, very likely due to broadening from exchange between multiple, poorly structured conformational forms. In myr-Arf•GTP samples, resonances from the N-terminal segment are observable and indicate the presence of a well-formed helix, but the helix does not make contact with the surface groove (see below). Instead, the groove is partially closed by the protrusion of loop γ3, leaving few of the myristoyl contact residues exposed (Fig. 1c, right). This loop has previously been suggested to displace the myristoyl chain, a suggestion now confirmed by experimental data.
Bicelle associated structure of the N terminus
The extended helix from Leu3 to Phe13 formed by the N terminus of myr-yArf1•GTP in the presence of bicelles is shown in Figure 1d. The helix clearly has a hydrophobic face consisting of Leu3, Phe4, Ala5, Leu8, Phe9, Leu12, and Phe13 (Fid 1d, middle), and a hydrophilic face consisting of Ser6, Lys7, Ser10, and Asn11 (Fig. 1d, right). The phenylalanine residues on the N terminus had previously been implicated in membrane interaction 17. RDCs from phenyl CH vectors measured in positive and negative gels for a [Phe-13C,15N, u-15N,2H] sample helped to position phenyl side chains. In the resulting model, Phe9 and Phe13 are located on one side of the hydrophobic face while Phe4 is located on the other side along with Leu8 (Fig. 1d, middle).
Unexpectedly, numerous contacts are observed in NOE studies between the myristoyl protons and protein amide, methyl, and phenyl protons of the N terminus. If a rigid myristoyl conformation is assumed, the structure shows at least the first 8 methylenes of the myristate to be folded back along the N-terminal helix and binding to a hydrophobic surface enclosed by Phe4, Ala5, Leu8, and Phe9 (Fig. 1d, left and middle). The data cannot rule out the possibility that the myristate also samples conformations more distal to the N terminus, but the conformation depicted is in sharp contrast to the common model in which the myristoyl group extends away from protein segments and inserts perpendicularly into the membrane bilayer.
Relative orientation of C- and N-terminal domains
Describing the structural relationship of two protein domains undergoing relative motion is challenging, but can be done with complementary types of data and adequate motional models. RDCs from proteins in anisotropic media such as stretched or compressed polyacrylamide gels, can be used to give relative orientation of domains in the presence of small-scale motion 20–22, but relative motions may be more substantial in the case of myr-Arf1•GTP. RDCs also provide no translational information. Structural data were, therefore, supplemented with long range distance constraints coming from paramagnetic relaxation enhancement (PRE) as a result of site directed spin labeling23,24. Several sets of PREs were employed. The single, native cysteine (Cys159) in yArf1 was mutated to a serine and the following additional changes were introduced: T55C, K59C, R83C, R117C, and S176C. The single cysteines in each construct were then labeled with the nitroxide carrying MTSL (methanethiosulfonate spin labeling) reagent, and PREs for amide proton transverse relaxation in both N- and C-termini were measured as described in Methods.
RDCs and PREs are assumed to be averaged by the same dynamic model and therefore can be treated simultaneously in fitting back-calculated data to experimental data. In the model employed here for back-calculation, the C-terminal domain (Glu17 to Leu177) was treated as an entity fixed in space and the N terminus (myr to Phe13) was treated as a rigid body jumping within an ensemble of equally populated states. Different ensemble states are allowed to overlap in spatial position so that motions involving unequally populated states can be represented. Because the actual number of existing states is unknown, we aimed at describing the dynamic system with the smallest ensemble size (N) that agrees within error limits of experimental observables.
In the model adopted, RDCs of the N terminus, but not the C terminus, are subject to ensemble averaging. This treatment requires that the C terminus is the main source of molecular alignment in the anisotropic media used for RDC measurement. As the N terminus is actually attached to a bicelle of considerable size, this assumption is not necessarily valid. Indeed, the N terminus aligns slightly more strongly than the C-domain in a neutral gel. Thus, these RDCs were excluded from ensemble fitting. However, in positive and negative gels, in which the protein apparently aligns primarily by electrostatic interactions, the N terminus anchored to the electrostatically neutral bicelle is substantially less ordered than the C terminus. This makes inclusion of data from the charged gels more appropriate. Two levels of distance averaging are considered for PREs: averaging over different ensemble states25 and averaging over 3 conformers for an MTSL side chain26. PRE is assumed to be averaged as <r−6> by direct application of the Solomon-Bloembergen equation27. This is actually an approximation that is violated when the inter-domain motion, or motion of the MTSL chain, is faster than overall molecular tumbling28,29. A more rigorous representation of motional averaging is available from the Solomon-Bloembergen equations extended with the model-free formalism (SBMF)26. But application of SBMF is computationally expensive and requires independent determination of additional variables, i.e. the internal motion time scales. Furthermore, because of the steep distance dependence, the propagated error in the distance is usually quite small even with the original SB equation as used in this study. For both RDCs and PREs of the C terminus (Fig. 3, red), the agreement between experimental and back-calculated data is quite good and quite similar as N goes from 1 to 3. This is due to the fact that the experimental data are over-weighted by this domain. In contrast, significant improvement is seen for the N terminus (blue), with nearly all data falling within experimental error limits only at N equal to 3.
Figure 3.

Ensemble structural fitting to RDCs and PREs. (a) Agreement between experimental and back- calculated RDCs for a 1-state ensemble (left) and a 3-state ensemble (right). Data include NH, NC′, and phenyl CH (the latter two are normalized to NH). RDCs are collected in positive and negative gels (b) Agreement between experimental and back-calculated PREs for a 1-state ensemble (left) and a 3-state ensemble (right). Data include PREs from T55C, K59C, R83C, R117C, and S176C.
Repeated calculations based on the N=3 model produce structures with a certain level of positional variation, just as do the calculations of structures normally superimposed in presenting NOE-based NMR structures. A conventional representation with the N-terminal domains superimposed and a distribution of C-terminal conformations as backbone tracings is given in Supplementary Figure 3. It should be pointed out that whereas the 3 members of the averaged ensemble are meant to represent different dynamic states, the variations among structures of the same ensemble member do not necessarily represent dynamics, but different solutions consistent with the experimental restraints. Structural solutions for the three members of the averaging ensemble are presented in a different format in Figure 4 of the main text. Here, the space that the C-terminal domain occupies is depicted using 3 different colors, each corresponding to one of the 3 dynamic states (pale blue, pale green, and pink). The distribution of structures within each member of the ensemble is statistically visualized using reweighted atomic density maps 30. These individual structures are derived from 44 lowest-energy N=3 structures out of 200 calculations. Density is given by the probability of atomic occupancy in each volume element when the different solutions are superimposed, and contour surfaces are drawn at 40% of the maximum occupancy. The total space that the C-terminal domain can sample is represented by the sum of these three surfaces. To denote particular regions of interest, additional maps have been superimposed, corresponding to Switch I (Val42-Val53) and Switch II (Arg73-Tyr81) (darker blue, green, and red for the three dynamic states), which are the primary interfaces through which Arf•GTP is believed to bind other proteins. In the figure, a model membrane is docked onto the hydrophobic side of the N-terminal helix that is assumed to lie horizontally on the membrane surface. Despite sampling of different dynamic states, the C terminus is clearly confined to the aqueous space above the lipid head groups in all low-energy solutions. Note that convergence between different calculations is particularly good for the blue state as suggested by its narrower distribution. Clearly the switch regions are accessible for effector/adaptor interactions in this model and the membrane can become a site of nucleation for protein complex assembly as required for the role of Arfs in membrane traffic.
Figure 4.
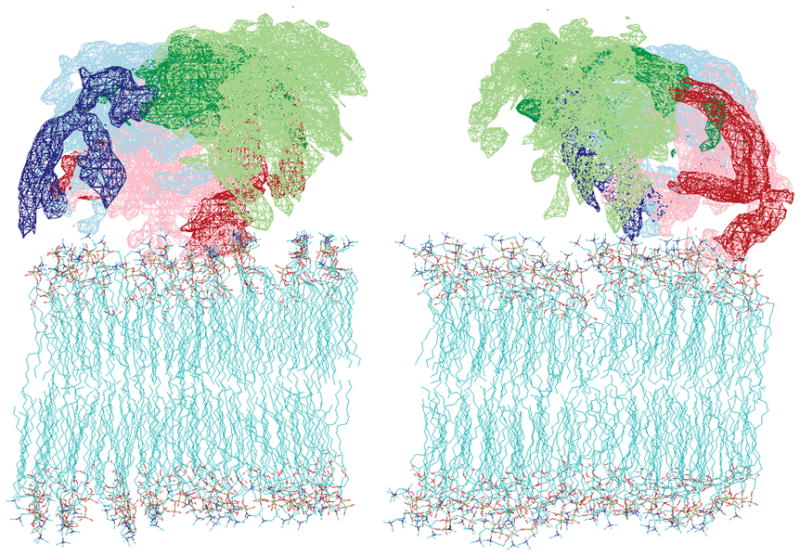
Reweighted atomic density maps of the C-terminal domain (Glu17 to Leu177) showing the space on the membrane surface that is sampled by the 3 dynamic states. The maps are created from the 44 lowest-energy N=3 structures from 200 calculations. Only backbone atoms are used for density calculation. The all-backbone-atom maps for the 3 states are colored in light blue, light green, and pink. The switch region densities for the corresponding states are colored in darker blue, green, and red. The right and left views are related by a 90° rotation around the bicelle norm.
DISCUSSION
The structural details shown above provide useful starting points for discussion of the types of interaction that Arfs must have in the course of their biological functions. Although the molecules in cells that recruit Arf•GDP to specific sites of vesicle budding are largely unknown, the insolubility of myr-Arf1•GTP and its affinity for membrane interaction suggest that a GEF will only catalyze guanine nucleotide exchange at a membrane surface where the membrane can act as an acceptor for the myristoylated N-terminal helix. Once the resulting Arf•GTP is tightly bound to the membrane, it is proposed to serve as an important contributor to carrier biogenesis through the interaction with and recruitment of other components of the budding carrier.
The formation of a membrane coat during carrier genesis is likely to generate sufficient surface curvature to stress normal packing of lipid chains. The ability of Arf•GTP to have its myristoyl chain occupy a position parallel to its membrane-anchored amphipathic helix is quite interesting. While it is possible that this position is promoted by the high curvature of the small bicelles used in this study, it could also easily play an important role in stabilizing budding structures that might otherwise expose hydrophobic surface defects to an aqueous environment. The inner surface of a curved bilayer is likely to be tightly packed compared to the outer surface which is likely to have exposed hydrophobic patches, much as the outer surface of a bicelle. If the amphipathic helix were to lie parallel to a budding vesicle surface, both the helix and the associated myristoyl chain could play a role in filling these defects and stabilizing the budding structure. It is interesting to note that a recent article by Ambroggio et al.31 documents a significant concentration of Arf1•GTP in highly curved bilayer regions, although the extent of concentration appears small compared to that of the GTPase activating protein, ArfGAP1. Once GTP is hydrolyzed, Arf•GDP is recycled to the cytosol. Newly exposed defects may play further roles in recruiting fission or fusion machinery, or even contribute directly to the eventual fusion of the released vesicle. Surface defects in vesicle structures have long been suggested to play a direct role in fusion of model vesicle systems 32,33.
The models depicted in Figure 4, which show that Arf undergoes appreciable internal motion at the membrane surface, but keeps regions needed for protein-protein interaction accessible, provide a basis for examining modes of membrane interaction of Arf binding partners. Among the Arf binding partners, Arf GAPs up-regulate Arf’s GTPase activity and adaptors are involved in cargo selection and coat formation. These proteins interact with Arf through a variety of structural motifs, including a zinc-finger motif in the case of Arf GAPs, a helix-loop-helix motif in the case of the N-GAT domain of GGAs, and a PH (pleckstrin homology) motif in the case of the ArfBD (Arf-binding domain) of ARHGAP21 9,10,34,35. In many cases these proteins are also directly membrane anchored and their binding sites on Arf must be positioned to allow these additional membrane interactions. Interestingly, Arf interacts with most of these proteins mainly through the switch regions and sometimes the inter-switch strand. In Figure 5 modeled membrane bound complexes of Arf1•GTP bound to the N-GAT domain of GGA1 and the Arf binding domain (ArfBD) of ARHGAP21 are shown using the blue state of Arf1•GTP. This was done through superposition of the C-terminal domain in our structure and the Arf parts of the complexes as determined by crystallography 9,10 (Fig. 5a,b). Note that docking can occur in both cases without domains clashing with the membrane.
Figure 5.
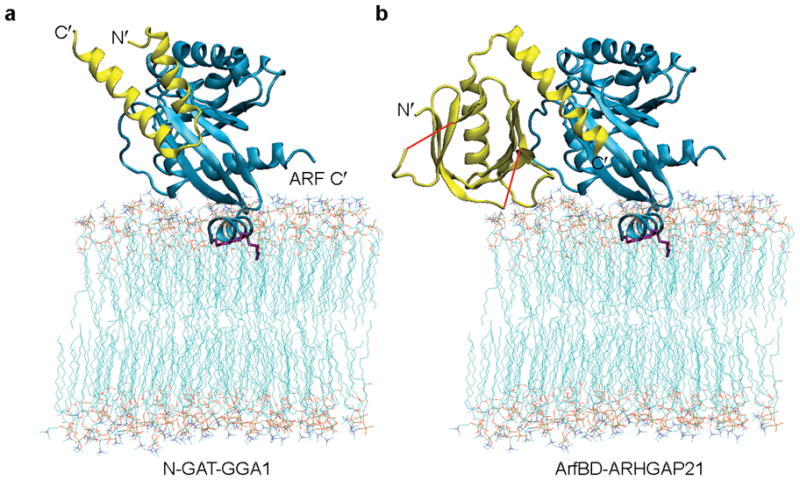
Modeling of Arf complexes on the membrane. (a) Arf/N-GAT complex modeled by superimposing the structure of myr-yArf1•GTP with that of mouse Arf1•GTP-Δ17-Q71L in the crystal structure of the Arf1•GTP-Δ17-Q71L/N-GAT complex (PDB: 1j2j). The structure of mouse Arf1•GTP-Δ17-Q71L is not displayed. (b) Arf/ArfBD-ARHGAP21 complex modeled by superimposing the structure of myr-yArf1•GTP with that of mouse Arf1•GTP-Δ17 in the crystal structure of the Arf1•GTP-Δ17/ArfBD-ARHGAP21 complex (PDB: 2j59). Segments of ArfBD-ARHGAP21 separated by loops of missing electron densities are connected by red lines. The structure of mouse Arf1•GTP is not displayed. In (a) and (b), Arf is shown in blue and the binding partners are shown in yellow.
The structure and structure determination methods presented here will obviously provide a good starting point for the study of other interactions occurring at membrane surfaces. These include interactions with both other proteins and specific lipids components. For example, FAPPs (four phosphate adapter proteins) are essential components of the complexes regulating budding at the trans-Golgi network which bind to both ARF (through a PH domain) and a lipid component of the membrane, phosphatidylinositol-4-phosphate (PtdIns(4)P) 35,36. The phosphatidylinositol binding site of PH-FAPP1 can be predicted based on homology with sites in the PH domain of Bruton’s tyrosine kinase 37 (PDB: 1b55), and with membrane association and ARF interaction data similar to that presented here, the predictions can be tested. Interestingly, certain positively charged residues on the linker (Lys15, Lys16) and near the very C terminus (Arg178, Lys181) of human ARF1 have also been suggested to interact with phosphatidylinositolphosphates on the basis of both mutational and NMR data 38,39. Human ARF1 and the yeast ortholog studied here are 76% identical in sequence and expected to be identical in core structure. While there are fewer positivity charged residues in the linker and C terminus of yeast Arf1, Lys16 and Lys178 of the yeast protein, corresponding to Lys16 and Arg178 of the human protein, are suitably near the membrane surface in the model presented to form interactions with negatively charged lipids. The presence of these lipids at sites of budding may play an additional role in recruiting both Arf and its adapter/effector proteins to sites of action.
Given the consistency with suggested interactions and mechanisms of action, it is likely that the structures represented as blue in Figure 4 do represent the orientation Arf adopts in binding certain proteins and lipids. Interactions with structures of ARF displayed in green and red can be examined as well, although the larger positional deviations of these two states make it harder to evaluate individual models. Arf structures depicted in green always allow docking without clashing with the membrane, while results vary for those depicted in red (state with the widest distribution of structural solutions). Whether the specific conformations represented by the green and red states actually play biological roles, or they are partially dictated by the small size of the bicelle employed in this study requires further study. However, the orientational plasticity of Arf is likely to be a general requirement for the accommodation of the large number of binding partners Arf accommodates on the membrane surface. A clearer picture about the role of Arf dynamics should emerge when the architectures of high molecular weight Arf complexes are elucidated.
One important cautionary note arises from consideration of the location of the C terminus of Arf. In biochemical and cell biology assays the C terminus of Arf is sometimes fused to tracers such as GFP or short epitope tags. As indicated in Figure 5a, the C terminus of Arf is actually right on top of the membrane. A short charged or bulky protein on the C terminus, particularly if attached by a short linker, is likely to alter Arf/membrane interaction and ARF’s orientation plasticity. This change may affect Arf’s interaction with certain factors but not others, leading to contradicting and confusing results40.
METHODS
Protein expression, spin-labeling, and purification
Expression and purification of myristoylated Arf followed a previously published protocol 13. The production of [Phe- 1H, 13C,15N, u-15N,2H] Arf was based on a slightly modified protocol as detailed in Supplementary Methods. To produce spin-labeled Arf, several additional steps were taken after Q-Sepharose purification of the protein.. MTSL (1-oxyl-2,2,5,5-tetramethyl-η3-pyrroline-3-methyl)methanethiosulfonate (Toronto Research Chemicals Inc.) was used as the spin-labeling reagent following published procedures 41,42. Production procedures for both oxidized and reduced forms of spin-labeled Arf (MTSL-ox) and MTSL-red) are further detailed in Supplementary Methods.
NMR sample preparation
Bacterially produced Arf is normally loaded with GDP on expression. Guanine nucleotide exchange with GTPγS was achieved following a previously described procedure 43. Refer to Supplementary Methods for detailed variations. The final NMR sample contained: ~0.8 mM yArf1, 5 mM GTPγS, 10% (w/v) DMPC/DHPC (q = 0.25), 3U CIP, 10 mM K2HPO4-KH2PO4 (pH 7), 50 mM NaCl, 10 mM K2SO4, 4 mM MgCl2, 2 mM EDTA, 5% D2O, and 5 mM dithiothreitol. For MTSL-ox and MTSL-red samples, dithiothreitol was not added in any buffer after spin labeling, and the final protein concentration was kept low (0.2–0.3 mM) to avoid inter-molecular relaxation enhancements.
NMR Spectroscopy
All spectra were collected at 25°C on 600, 800 and 900MHz Varian spectrometers equipped with cryo-probes. Backbone resonances were assigned to 96% using a standard set of TROSY-based triple resonance experiments (HNCA, HN(CA)CB and HN(CO)CA, 5–6.5ms 13C acquisition time). VI(δ2) and L methyl groups were assigned to 98% using a doubly enhanced, 13C- excited CCmHm-TOCSY experiment modified based on published pulses 44,45. Due to the large molecular size, a non-constant time methyl 13C evolution of 15ms proved beneficial in terms of S/N and provided sufficient resolution. Phenyl CH groups were assigned with the HCCH-TOCSY experiment. NOEs involving amide, methyl, and phenyl protons were acquired from NOESY-15N,1H-TROSY (100ms/120ms mixing time), NOESY-13C,1H-HMQC (100ms mixing time), and NOESY-13C,1H-TROSY (150ms mixing time) experiments.
Three independent sets of RDCs were obtained from a compressed negative gel polymerized with 2.5% 2-acrylamido-2-methyl-1-propanesulfonic acid and 2.5% acrylamide, a compressed positive gel polymerized with 2.5% (3-acrylamidopropyl)-trimethylammonium chloride and 2.5% acrylamide, and a stretched neutral gel polymerized with 5% acrylamide. The preparation of poly-acrylamide gels followed published procedures 46. N-H RDCs were measured from interleaved TROSY-HSQC pairs (50ms 15N acquisition time) of acquisitions for negative and neutral gels, and from a TROSY-based J-modulated experiment for the positive gel. All NC’ RDCs were measured from a previously published TROSY-based J-modulated experiment 43. Phenyl C-H RDCs were measured from a 13C-constant-timeTROSY, 1H-IPAP experiment.
Rotational correlation times were extracted from spin relaxation measurements that detect relaxation interference between 15N CSA (chemical shift anisotropy) and 15N-1H dipolar relaxation 15. R2 relaxations of the MTSL-red sample were measured with a published pulse sequence47. PREs were further derived from fast-HSQC (2s recycling delay) peak intensities ratios of MTSL-ox and MTSL-red samples (Iox/Ired). This approach is not suitable for PRE measurement from lanthanides or transition metals because of the significant R1 enhancement effects from these ions. In contrast, the R1 enhancement from a nitroxide is negligible for large molecules at high fields due to the long electronic life-time, and therefore magnetization recovery during the recycling delay is similar for MTSL-ox and MTSL-red samples and Iox/Ired provides a more reliable R2 PRE measurement. Estimation based on Iox/Ired of HSQC spectra is also less susceptible to incomplete spin labeling than R2 measurement of MTSL-ox from an exponential decay. Two sources of error in PRE are considered: i) uncertainty in referencing of the intensity ratio; ii) spectral signal-to-noise. The former was estimated from Iox/Ired variations among sites predicted to have no measurable PREs. These 2 sources of error were propagated by 500 Monte Carlo simulations to yield error bars in Figure 2.
Structural calculation and ensemble structural fitting
Structural calculations were conducted using restraints including NOEs, dihedral angles derived from chemical shifts, RDCs, and PREs as implemented in the Xplor-NIH software 48,49. Binding of GTPγS was confirmed by NOEs between guanine H1 (13.4ppm) and H8 protons (7.7ppm) and protons on the protein. To constrain other parts of the nucleotide during structure determination,10 additional pseudo-restraints were added derived from the crystal structure of mouse Arf1•GTP(−Δ17-Q71L). The myristoyl group is positioned by NOEs connecting myristoyl protons to protons of the N-terminal protein domain. These NOEs are related to the N-myristate instead of lipids as confirmed by studies in acyl deuterated DMPC and DHPC preparations. The solution structure of myr-yArf1•GDP (2k5u) was used as an initial template for simulated annealing using the CHARMM force field. The simulated annealing steps are detailed in Supplementary Methods. In the final structures, the percentages of residues among G2-F13 and E17-L177 that reside in “most favored”, “additionally allowed”, and “generously allowed” regions of Ramachandran diagram are 89.7%, 9%, and 1.3% respectively.
The ensemble structural calculation was also conducted with the Xplor-NIH software. The mobility of the MTSL chain for PRE calculations was represented by a pseudo-residue consisting of a cysteine conjugated to 3 non-interfering MTSL molecules. The C-terminal domain (Glu17 to Leu177) was fixed while the N terminus (myr to Phe13) was free to move as described in the text. The linker region (Gly14 to Lys16) and the very C terminus (Lys178-Thr181) were unrestrained based on their short rotational correlation times. For RDCs, the order tensor axis system was allowed to rotate while the principal values were fixed to numbers determined from the C-terminal structure. The simulated annealing protocol for ensemble structural calculation is described in Supplementary Methods.
Supplementary Material
Acknowledgments
The authors thank Dr. Mari Demarco, Complex Carbohydrate Research Center, the University of Georgia, for kindly providing the model membrane structure and Dr. Charles Schwieters, Center for Information Technology, NIH, for kindly providing the pre-release version of Xplor-NIH that supports ambiguous RDC assignment. This work was supported by a grant from the National Institutes of Health (GM61268).
Footnotes
Supplementary Information is available on the Nature Structural & Molecular Biology website.
Accession codes: The coordinates and constraint files have been deposited in the Protein Data Bank under accession number 2ksq.
AUTHOR CONTRIBUTIONS
Y.L. produced the samples and collected and analyzed all data. J.P. and R.K. devised the project and jointly contributed interpretation of data and drafting of the manuscript.
COMPETING INTERESTS STATEMENT
The authors declare that they have no competing financial interests
References
- 1.Kahn RA. Toward a model for Arf GTPases as regulators of traffic at the Golgi. FEBS Lett. 2009;583:3872–9. doi: 10.1016/j.febslet.2009.10.066. [DOI] [PMC free article] [PubMed] [Google Scholar]
- 2.Luo R, Ha VL, Hayashi R, Randazzo PA. Arf GAP2 is positively regulated by coatomer and cargo. Cell Signal. 2009;21:1169–79. doi: 10.1016/j.cellsig.2009.03.006. [DOI] [PMC free article] [PubMed] [Google Scholar]
- 3.Pucadyil TJ, Schmid SL. Conserved functions of membrane active GTPases in coated vesicle formation. Science. 2009;325:1217–20. doi: 10.1126/science.1171004. [DOI] [PMC free article] [PubMed] [Google Scholar]
- 4.D’Souza-Schorey C, Chavrier P. ARF proteins: roles in membrane traffic and beyond. Nature Reviews Molecular Cell Biology. 2006;7:347–358. doi: 10.1038/nrm1910. [DOI] [PubMed] [Google Scholar]
- 5.Casanova JE. Regulation of arf activation: the sec7 family of guanine nucleotide exchange factors. Traffic. 2007;8:1476–1485. doi: 10.1111/j.1600-0854.2007.00634.x. [DOI] [PubMed] [Google Scholar]
- 6.Gillingham AK, Munro S. The small G proteins of the arf family and their regulators. Annual Review of Cell and Developmental Biology. 2007;23:579–611. doi: 10.1146/annurev.cellbio.23.090506.123209. [DOI] [PubMed] [Google Scholar]
- 7.Inoue H, Randazzo PA. Arf GAPs and their interacting proteins. Traffic. 2007;8:1465–1475. doi: 10.1111/j.1600-0854.2007.00624.x. [DOI] [PubMed] [Google Scholar]
- 8.Renault L, Guibert B, Cherfils J. Structural snapshots of the mechanism and inhibition of a guanine nucleotide exchange factor. Nature. 2003;426:525–30. doi: 10.1038/nature02197. [DOI] [PubMed] [Google Scholar]
- 9.Shiba T, et al. Molecular mechanism of membrane recruitment of GGA by ARF in lysosomal protein transport. Nat Struct Biol. 2003;10:386–93. doi: 10.1038/nsb920. [DOI] [PubMed] [Google Scholar]
- 10.Menetrey J, et al. Structural basis for ARF1-mediated recruitment of ARHGAP21 to Golgi membranes. EMBO J. 2007;26:1953–62. doi: 10.1038/sj.emboj.7601634. [DOI] [PMC free article] [PubMed] [Google Scholar]
- 11.Amor JC, Harrison DH, Kahn RA, Ringe D. Structure of the human ADP-ribosylation factor 1 complexed with GDP. Nature. 1994;372:704–8. doi: 10.1038/372704a0. [DOI] [PubMed] [Google Scholar]
- 12.Goldberg J. Structural basis for activation of ARF GTPase: mechanisms of guanine nucleotide exchange and GTP-myristoyl switching. Cell. 1998;95:237–48. doi: 10.1016/s0092-8674(00)81754-7. [DOI] [PubMed] [Google Scholar]
- 13.Liu Y, Kahn RA, Prestegard JH. Structure and membrane interaction of myristoylated ARF1. Structure. 2009;17:79–87. doi: 10.1016/j.str.2008.10.020. [DOI] [PMC free article] [PubMed] [Google Scholar]
- 14.Amor JC, et al. Structures of yeast ARF2 and ARL1: distinct roles for the N terminus in the structure and function of ARF family GTPases. J Biol Chem. 2001;276:42477–84. doi: 10.1074/jbc.M106660200. [DOI] [PubMed] [Google Scholar]
- 15.Liu Y, Prestegard JH. Direct measurement of dipole-dipole/CSA cross-correlated relaxation by a constant-time experiment. J Magn Reson. 2008;193:23–31. doi: 10.1016/j.jmr.2008.03.013. [DOI] [PMC free article] [PubMed] [Google Scholar]
- 16.Losonczi JA, Prestegard JH. Nuclear magnetic resonance characterization of the myristoylated, N-terminal fragment of ADP-ribosylation factor 1 in a magnetically oriented membrane array. Biochemistry. 1998;37:706–16. doi: 10.1021/bi9717791. [DOI] [PubMed] [Google Scholar]
- 17.Losonczi JA, Tian F, Prestegard JH. Nuclear magnetic resonance studies of the N-terminal fragment of adenosine diphosphate ribosylation factor 1 in micelles and bicelles: influence of N-myristoylation. Biochemistry. 2000;39:3804–16. doi: 10.1021/bi9923050. [DOI] [PubMed] [Google Scholar]
- 18.Vold RR, Prosser RS. Magnetically oriented phospholipid bilayered micelles for structural studies of polypeptides. Does the ideal bicelle exist? J Magn Reson. 1996;113:267–271. [Google Scholar]
- 19.Lee D, et al. Bilayer in small bicelles revealed by lipid-protein interactions using NMR spectroscopy. J Am Chem Soc. 2008;130:13822–3. doi: 10.1021/ja803686p. [DOI] [PubMed] [Google Scholar]
- 20.Fischer MWF, Losonczi JA, Weaver JL, Prestegard JH. Domain orientation and dynamics in multidomain proteins from residual dipolar couplings. Biochemistry. 1999;38:9013–9022. doi: 10.1021/bi9905213. [DOI] [PubMed] [Google Scholar]
- 21.Tolman JR, Ruan K. NMR residual dipolar couplings as probes of biomolecular dynamics. Chem Rev. 2006;106:1720–36. doi: 10.1021/cr040429z. [DOI] [PubMed] [Google Scholar]
- 22.Tolman JR, Al-Hashimi HM, Kay LE, Prestegard JH. Structural and dynamic analysis of residual dipolar coupling data for proteins. J Am Chem Soc. 2001;123:1416–24. doi: 10.1021/ja002500y. [DOI] [PubMed] [Google Scholar]
- 23.Hubbell WL, Altenbach C. Investigation of Structure and Dynamics in Membrane-Proteins Using Site-Directed Spin-Labeling. Current Opinion in Structural Biology. 1994;4:566–573. [Google Scholar]
- 24.Clore GM, Tang C, Iwahara J. Elucidating transient macromolecular interactions using paramagnetic relaxation enhancement. Curr Opin Struct Biol. 2007;17:603–16. doi: 10.1016/j.sbi.2007.08.013. [DOI] [PMC free article] [PubMed] [Google Scholar]
- 25.Tang C, Iwahara J, Clore GM. Visualization of transient encounter complexes in protein-protein association. Nature. 2006;444:383–6. doi: 10.1038/nature05201. [DOI] [PubMed] [Google Scholar]
- 26.Iwahara J, Schwieters CD, Clore GM. Ensemble approach for NMR structure refinement against (1)H paramagnetic relaxation enhancement data arising from a flexible paramagnetic group attached to a macromolecule. J Am Chem Soc. 2004;126:5879–96. doi: 10.1021/ja031580d. [DOI] [PubMed] [Google Scholar]
- 27.Solomon I, Bloembergen N. Nuclear Magnetic Interactions in the Hf Molecule. Journal of Chemical Physics. 1956;25:261–266. [Google Scholar]
- 28.Bruschweiler R, et al. Influence of Rapid Intramolecular Motion on Nmr Cross-Relaxation Rates -a Molecular-Dynamics Study of Antamanide in Solution. Journal of the American Chemical Society. 1992;114:2289–2302. [Google Scholar]
- 29.Lipari G, Szabo A. Model-Free Approach to the Interpretation of Nuclear Magnetic-Resonance Relaxation in Macromolecules. 1. Theory and Range of Validity. Journal of the American Chemical Society. 1982;104:4546–4559. [Google Scholar]
- 30.Schwieters CD, Clore GM. Reweighted atomic densities to represent ensembles of NMR structures. Journal of Biomolecular Nmr. 2002;23:221–225. doi: 10.1023/a:1019875223132. [DOI] [PubMed] [Google Scholar]
- 31.Ambroggio E, et al. ArfGAP1 generates an Arf1 gradient on continuous lipid membranes displaying flat and curved regions. Embo Journal. 29:292–303. doi: 10.1038/emboj.2009.341. [DOI] [PMC free article] [PubMed] [Google Scholar]
- 32.Prestegard JH, Obrien MP. Membrane and Vesicle Fusion. Annual Review of Physical Chemistry. 1987;38:383–411. [Google Scholar]
- 33.Cevc G, Richardsen H. Lipid vesicles and membrane fusion. Advanced Drug Delivery Reviews. 1999;38:207–232. doi: 10.1016/s0169-409x(99)00030-7. [DOI] [PubMed] [Google Scholar]
- 34.Cukierman E, Huber I, Rotman M, Cassel D. The ARF1 GTPase-activating protein: zinc finger motif and Golgi complex localization. Science. 1995;270:1999–2002. doi: 10.1126/science.270.5244.1999. [DOI] [PubMed] [Google Scholar]
- 35.Godi A, et al. FAPPs control Golgi-to-cell-surface membrane traffic by binding to ARF and PtdIns(4)P. Nat Cell Biol. 2004;6:393–404. doi: 10.1038/ncb1119. [DOI] [PubMed] [Google Scholar]
- 36.D’Angelo G, et al. Glycosphingolipid synthesis requires FAPP2 transfer of glucosylceramide. Nature. 2007;449:62–U43. doi: 10.1038/nature06097. [DOI] [PubMed] [Google Scholar]
- 37.Baraldi E, et al. Structure of the PH domain from Bruton’s tyrosine kinase in complex with inositol 1,3,4,5-tetrakisphosphate. Structure. 1999;7:449–60. doi: 10.1016/s0969-2126(99)80057-4. [DOI] [PubMed] [Google Scholar]
- 38.Seidel RD, Amor JC, Kahn RA, Prestegard JH. Structural perturbations in human ADP ribosylation factor-1 accompanying the binding of phosphatidylinositides. Biochemistry. 2004;43:15393–15403. doi: 10.1021/bi0490385. [DOI] [PubMed] [Google Scholar]
- 39.Randazzo PA. Functional interaction of ADP-ribosylation factor 1 with phosphatidylinositol 4,5-bisphosphate. Journal of Biological Chemistry. 1997;272:7688–7692. [PubMed] [Google Scholar]
- 40.Jian X, Cavenagh M, Gruschus JM, Randazzo PA, Kahn RA. Modifications to the C-terminus of Arf1 alter cell functions and protein interactions. Traffic. 2010 doi: 10.1111/j.1600-0854.2010.01054.x. in press. [DOI] [PMC free article] [PubMed] [Google Scholar]
- 41.Battiste JL, Wagner G. Utilization of site-directed spin labeling and high-resolution heteronuclear nuclear magnetic resonance for global fold determination of large proteins with limited nuclear overhauser effect data. Biochemistry. 2000;39:5355–65. doi: 10.1021/bi000060h. [DOI] [PubMed] [Google Scholar]
- 42.Liang B, Bushweller JH, Tamm LK. Site-directed parallel spin-labeling and paramagnetic relaxation enhancement in structure determination of membrane proteins by solution NMR spectroscopy. J Am Chem Soc. 2006;128:4389–97. doi: 10.1021/ja0574825. [DOI] [PMC free article] [PubMed] [Google Scholar]
- 43.Liu Y, Prestegard JH. Measurement of one and two bond N-C couplings in large proteins by TROSY-based J-modulation experiments. J Magn Reson. 2009;200:109–18. doi: 10.1016/j.jmr.2009.06.010. [DOI] [PMC free article] [PubMed] [Google Scholar]
- 44.Permi P, Tossavainen H, Hellman M. Efficient assignment of methyl resonances: enhanced sensitivity by gradient selection in a DE-MQ-(H)CC(m)Ht (m)-TOCSY experiment. J Biomol NMR. 2004;30:275–82. doi: 10.1007/s10858-004-3222-2. [DOI] [PubMed] [Google Scholar]
- 45.Yang D, Zheng Y, Liu D, Wyss DF. Sequence-specific assignments of methyl groups in high-molecular weight proteins. J Am Chem Soc. 2004;126:3710–1. doi: 10.1021/ja039102q. [DOI] [PubMed] [Google Scholar]
- 46.Cierpicki T, Bushweller JH. Charged gels as orienting media for measurement of residual dipolar couplings in soluble and integral membrane proteins. J Am Chem Soc. 2004;126:16259–66. doi: 10.1021/ja046054g. [DOI] [PubMed] [Google Scholar]
- 47.Iwahara J, Tang C, Marius Clore G. Practical aspects of (1)H transverse paramagnetic relaxation enhancement measurements on macromolecules. J Magn Reson. 2007;184:185–95. doi: 10.1016/j.jmr.2006.10.003. [DOI] [PMC free article] [PubMed] [Google Scholar]
- 48.Schwieters CD, Kuszewski JJ, Clore GM. Using Xplor-NIH for NMR molecular structure determination. Progress in Nuclear Magnetic Resonance Spectroscopy. 2006;48:47–62. [Google Scholar]
- 49.Schwieters CD, Clore GM. Internal coordinates for molecular dynamics and minimization in structure determination and refinement. J Magn Reson. 2001;152:288–302. doi: 10.1006/jmre.2001.2413. [DOI] [PubMed] [Google Scholar]
- 50.Cornilescu G, Marquardt JL, Ottiger M, Bax A. Validation of protein structure from anisotropic carbonyl chemical shifts in a dilute liquid crystalline phase. Journal of the American Chemical Society. 1998;120:6836–6837. [Google Scholar]
Associated Data
This section collects any data citations, data availability statements, or supplementary materials included in this article.