Abstract
Desorption electrospray ionization (DESI), a relatively new ambient ionization technique used in mass spectrometry (MS), allows for the direct analysis of samples such as thin tissue sections, to be conducted outside of vacuum in the ambient environment and often without sample preparation. DESI-MS has been used in order to systematically characterize phospholipids, which are abundant species in biological tissue samples. Lipids play important biological roles and differences in lipid compositions have been seen in diseases such as cancer and Alzheimer’s disease. Imaging of thin tissue sections exploits the ability of DESI-MS to study these lipids directly in the biological matrix. In imaging MS (IMS), a mass spectrum is recorded at each pixel while moving the surface containing the sample so that the entire sample area is covered. The information in these mass spectra can be combined to create a 2D chemical image of the sample, combining information on spatial distribution with information on chemical identity from the characteristic ions in the mass spectra. DESI-MS has been used to image a variety of tissue samples including human liver adenocarcinoma, rat brain, human breast tissue and canine abdominal tumor tissue. Comparisons between diseased and normal tissue are made in these studies.
Keywords: Ambient ionization, Imaging, Lipidomics, Mass spectrometry
1. Introduction
Lipids are a structurally diverse group of molecules and that diversity is necessary for the broad range of roles that they play in cellular processes. These diverse functions include maintaining an electrochemical gradient, subcellular partitioning, cell signaling, energy storage, and protein trafficking and membrane anchoring [1]. The most widely recognized role of lipids is to form the lipid bilayer of cellular and organelle membranes. Although the membranes are made up mostly of glycerol-based phospholipids, a variety of other lipids are present in order to provide the adaptability and flexibility necessary for cell membranes [2]. The membrane also supports a variety of proteins that are involved in many cellular processes; as many as 20–30% of all proteins are integral membrane proteins, and many more function near a cellular or organelle membrane [2]. The properties of the membranes and therefore the lipids have a direct effect on many cellular processes; lipids do much more than simply providing a flexible, permeable cell barrier. Each membrane also has many subdomains such as lipid rafts, lipid domains, and organizations of membrane associated complexes [2]. Lipids can also affect proteins by holding protein complexes together, providing the interface between proteins subunits, providing the hydrophobic–hydrophilic solvent where proteins can fold, and directing proteins to their locations of action [2]. The diverse and sometimes multiple roles lipids play within a cell can make determining lipid function difficult, but determining the function is important for understanding cellular processes. Understanding what role lipids play in normal cells can lead to an understanding of how lipids function in a disease state [2]. Even empirical information on differences in lipid composition between healthy and diseased tissue can be valuable. It has already been reported that alterations in the phospholipid composition of tissue are seen in certain diseases, including cancer and Alzheimer’s disease [3,4]. Lipids have also been found to play a role in the underlying biological processes of cardiovascular diseases such as atherosclerosis [5–7]. Malignant transformations in some tissues have been characterized by an abundance of certain phospholipids and their enzymatic by-products [8,9]. Findings such as these emphasize the importance of determining the compositions of phospholipids in biological tissues, because they may have prognostic value for determining disease.
Mass spectrometry (MS) is an increasingly powerful analytical tool in the field of lipidomics, allowing for the identification, characterization, and quantitation of various lipid species. A variety of ionization techniques have been used to study the various classes of lipids, including chemical ionization (CI) [10,11], fast atom bombardment (FAB) [12,13], electrospray ionization (ESI) [14–16], secondary ion mass spectrometry (SIMS) [17–19], and matrix-assisted laser desorption/ionization (MALDI) [20–22]. Techniques such as atmospheric pressure CI and ESI require that the sample be in an aqueous solution, which requires extensive sample preparation when the sample is in the form of a tissue section or a cell culture. MALDI and SIMS allow for more direct analysis of tissue samples, but MALDI requires the application of a matrix to the sample and with both techniques the samples are typically examined after introduction into the high vacuum region of the mass spectrometer. With the sample under vacuum, ready chemical or physical manipulation is difficult. Some of the disadvantages of these methods are overcome with the ambient ionization technique of desorption electrospray ionization (DESI) although in other respects it too has limitations as discussed herein.
DESI is an ambient ionization technique that allows for the direct analysis of biological samples, such as tissue. DESI offers the advantages of little or no sample preparation; it does not require the addition of a matrix and it is conducted outside the mass spectrometer at atmospheric pressure [23]. In DESI, a pneumatically assisted electrospray produces charged droplets that are directed at a surface, see schematic in Fig. 1. As the charged droplets collide with the sample surface they wet it and analytes are extracted into the liquid film; impact of subsequent primary droplets releases secondary microdroplets giving rise to the term, droplet pick-up [24]. Following this analyte pick-up mechanism, the standard electrospray solvent evaporation processes occur, followed finally by the production of dry ions of analyte in the interface either by the field desportion (FDM) [25] or charge residue process (CRM) [26]. DESI has been used for many different applications, including, forensics [27–29], imaging [30,31], metabolomics [32–34], pharmaceutics [35,36], the characterization of natural products [23,35,37], bacteria [38], polymers [39,40], proteins [23,36,41], and explosives detection [35,42,43].
Fig. 1.
Desorption electrospray ionization (DESI). (a) Schematic of DESI; (b) schematic of tissue imaging analysis using DESI.
2. Analysis of lipids by desorption electrospray ionization mass spectrometry
DESI-MS has been successfully used to ionize and detect lipids and has been evaluated systematically for the characterization of phospholipids [44]. Among the parameters investigated were the effects of surface and solvents, and experiments were conducted in the full scan mode in addition to the fragmentation patterns being studied by collision induced dissociation [44]. These studies focused on phospholipids because these particular classes of lipids were observed in past DESI experiments conducted on tissue [30,31,45,46]. Lipid standard solutions were dissolved in chloroform or a mixture of chloroform and methanol and spotted onto various surfaces such as glass, polymethyl methacrylate (PMMA), flat polytetrafluoroethylene (PTFE), PTFE printed glass, and subsequently analyzed by DESI-MS [44]. These studies allowed the determination of the best surface, PTFE printed glass, and the optimal spray solvent, a 1:1 methanol/water (vol:vol) for lipid analysis [44]. Experiments conducted on the lipid standards in the full scan mode and in the MS/MS mode showed that DESI-MS could be used to correctly characterize those lipid species [44].
In order to establish the ability of DESI-MS to analyze the lipids present in complex biological matrices such as tissue samples, total lipid extract from porcine brain was subjected to analysis in both positive and negative ion mode and an example mass spectrum collected in the negative ion modeis shown in Fig. 2. Phosphatidylserines, phosphatidylinositols and sulfatides dominate the spectrum in the negative mode. In order to positively identify particular ions present in the mass spectrum, tandem mass spectrometry can be used, as was done with the lipid standards. Fig. 2 shows the MS/MS spectrum recorded for the sulfatide sphingolipid at m/z 888 [44]. The fragmentation pattern shown is sufficient to identify m/z 888 as a sulfatide with a 24:1 nonhydroxylated fatty acid chain. This same experiment can be conducted for any peak present in the lipid profile. In the positive mode the primary species present are phosphatidylcholines, and as was demonstrated in negative ion mode, tandem mass spectrometry can be used to identify particular ions [44]. The same methodology used for the brain extract can be applied to direct tissue analysis of thin rat brain tissue sections [44].
Fig. 2.
(a) Lipid profile of porcine brain extract in negative mode spraying 1:1 methanol/water. (b) MS/MS of m/z 888 from (a); (1) [M−H–galactose sulfate–C16H30O]−; (2) [M−H–H2O–C22H43CH=C=O]−; (3) [M−H–C16H30O]−. Adapted from original figure by Manicke et al. [44] with permission from Elsevier, copyright 2008.
3. Imaging mass spectrometry
Imaging MS (IMS) is a powerful resource in the biological sciences. Using IMS an image can be created from the individual mass spectra collected for a sample showing the distribution of particular compounds over the sample area. In this way the chemical information obtained from the mass spectra is combined with the spatial information from the imaging experiments. This ability to record spatial and molecular information simultaneously on surfaces is a particularly powerful approach, especially with DESI-MS which requires limited preparation and the sample is under ambient conditions.
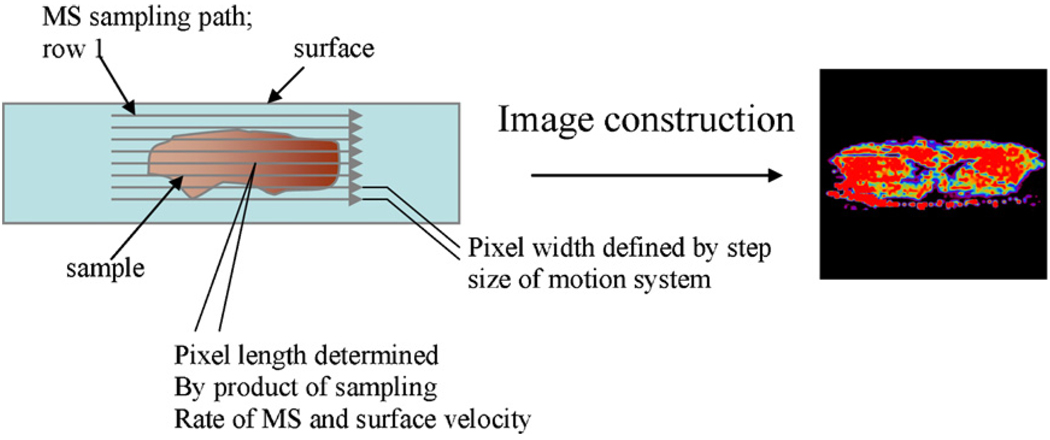
In typical DESI imaging experiments, the collected tissue sample is flash frozen in liquid nitrogen and stored at −80 °C and is subsequently cut in micron thin sections using a cryostat-microtome and the thin tissue slices are thaw mounted onto glass microscope slides for analysis, see Fig. 3 for a schematic. As in other MS experiments, in IMS ions are transported from surfaces, including tissue samples, to the gas-phase for mass analysis as the surface is being moved in order to cover the entire sample area. A mass spectrum is generated for each pixel on the surface, and ion images of the area sampled are constructed to show the spatial distribution of the intensity of selected ion, see Fig. 3. In this manner, a chemical image of a particular compound or a particular lipid present in the tissue section can be constructed. So the distribution of a particular lipid can be visualized and differences noted between different tissue samples, such as in tumor and normal tissue. IMS is becoming a powerful technique for analyzing histological sections of biological tissue [47,48], because it has the potential to provide more information and to provide it much faster than traditional methods.
Fig. 3.
Schematic representation of imaging experiment. Each pixel on the tissue surface results in a unique MS spectrum.
In the field of IMS, both MALDI and SIMS have been used extensively. MALDI IMS can achieve resolution of ≥25 µm [49] although 100 µm is routinely achieved, but experiments are for the most part conducted in the high vacuum region of the instrument [21,50]. Atmospheric pressure MALDI (AP-MALDI) has been introduced to allow ionization to occur at atmospheric pressure with comparable performance to conventional MALDI [51,52]. AP-MALDI facilitates the coupling of the source to alternative mass analyzers such as the linear ion trap and the Fourier transform mass spectrometer, expanding the applications of the technique [53–55]. AP-MALDI has been used to analyze peptides, proteins, oligosaccharides, small molecules, and tryptic digests and has the potential to expand into IMS [51,52]. Both conventional MALDI and AP-MALDI require sample preparation steps including the application of an organic matrix to the sample for ionization. These sample preparation steps can influence the spatial integrity of the analytes as well as influence the degradation of the analytes prior to analysis [56,57]. The choice of the matrix is key for signal quality and intensity and must be targeted to the analytes of interest, the matrix must also be applied uniformly for optimal signal intensity over the entire sample and also for maintaining the spatial integrity [57]. Laser ablation electrospray ionization (LAESI) has been recently used for two-dimensional imaging as well as depth profiling, with the potential for in vivo applications [58,59]. Electrospray assisted laser desorption ionization (ELDI) has also been shown to have the potential for direct tissue analysis in the ambient environment [60,61]. Imaging using SIMS potentially provides the advantage of very high spatial resolution of approximately 100 nm and can be performed without additional sample preparation, but SIMS imaging also cannot be conducted under ambient conditions [48,62,63] and in addition, SIMS is a harsher ionization technique that tends to produce more dissociation than DESI or MALDI. In traditional atomic ion source SIMS it was difficult to desorb ions with m/z >500, making it impossible to detect large biomolecules [64]. Now with the availability of cluster ion sources, such as Aun+, Bnx+, SF5+, and C60x+, secondary ion yields are increased allowing the detection of larger molecules [19,65–69]. SIMS also allows for molecular depth profiling using cluster ion sources therefore permitting 3D imaging [70,71]. DESI is a soft ionization method, providing intact ionized molecules [18,19,23,72]. DESI has a spatial resolution of only 250 µm [30], although recent experiments have optimized condition and achieved a resolution of 40 µm [73].
4. Imaging by desorption electrospray ionization mass spectrometry
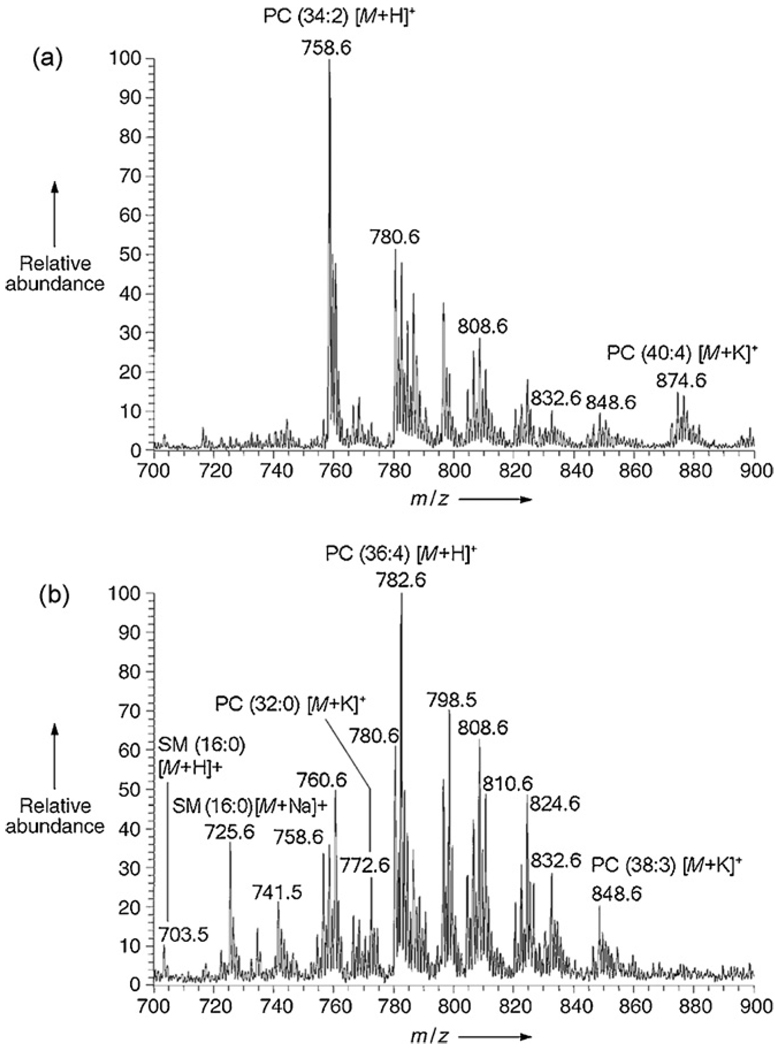
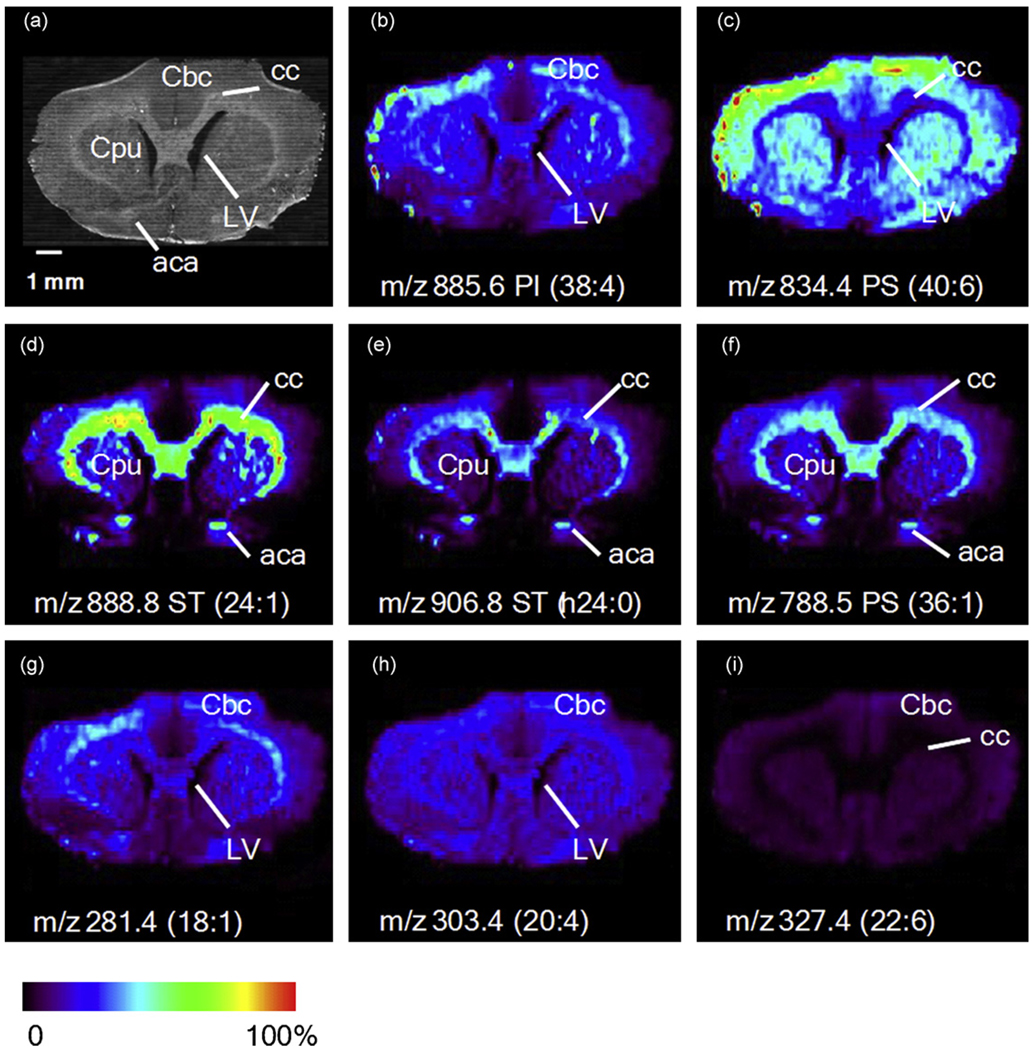
Many lipid species are easily ionized by DESI, making them attractive target molecules from which to create molecular images of thin tissue sections. To this end, DESI-MS has previously been used to construct chemical images of tissue sections [30,31,46,74,75]. The first experiments applying DESI-MS to biological tissue profiling were conducted on thin tissue sections of mouse pancreas, rat brain, and metastatic human liver adenocarcinoma, as well as whole tissue analysis of adipose tissue surrounding a chicken heart [46]. Interrogation of the mouse pancreas tissue gave strong signals from the major lipid components of biological membranes, the phosphatidylcholine species [46]. DESI-MS analysis of rat brain tissue resulted in phospholipid signals mainly from saturated fatty acids [46]. Since lipid distributions change with disease states, such as cancer, the lipid profiles were expected to differ between the cancerous and adjacent normal tissue of the human liver adenocarcinoma, and this was found to be true, as shown in Fig. 4 [46]. Dominant signals from palmitic acid containing phospholipids were present in the non-cancerous tissue, with unsaturated fatty acids containing phospholipids making up the transition area of the tissue, and sphingomyelin was elevated in the tumor tissue [46]. As an early proof of concept, intact adipose tissue in situ surrounding a chicken heart was analyzed by DESI-MS, resulting in signals from the free fatty acids present on the tissue surface [46]. Further imaging experiments were conducted using rat brain tissue sections in order to create the first two-dimensional DESI ion images [31]. The ion images constructed from the distributions of the phospholipids, phosphatidylinositol (PI), phosphatidylserine (PS), and sulfatide (ST), in the negative ion mode are shown in Fig. 5 [31]; structural confirmation comes from tandem mass spectrometry information. An optical image of the rat brain section is also shown and it is evident that the structural features of the brain are also seen using imaging DESI-MS [31]. The results for the ion intensities of the lipid species seen in the rat brain are in good agreement with reported literature information of the composition and distribution of lipids in the brain tissue [31,76].
Fig. 4.
Positive ion DESI mass spectra for metastatic human liver adenocarcinoma tissue, spraying methanol/water (1:1, v/v) with 0.1% NH4OH added. (a) Representative DESI mass spectrum from nontumor region of the tissue. (b) Representative DESI mass spectrum from cancerous region of the tissue. Adapted from original figure by Wiseman et al. [46] with permission from Wiley–VHC, copyright 2005.
Fig. 5.
Images of selected lipid molecular ions [M−H]− from a rat brain tissue section. (a) Optical image of the coronal section of the rate brain. cc = corpos callosum; CPu = striatum; Cbc = celebral cortex; LV= lateral ventricle; aca = anterior part of anterior commissure. (b–i) Ion images of selected lipid species. Reprinted from Wiseman et al. [31] with permission from Wiley–VCH, copyright 2006.
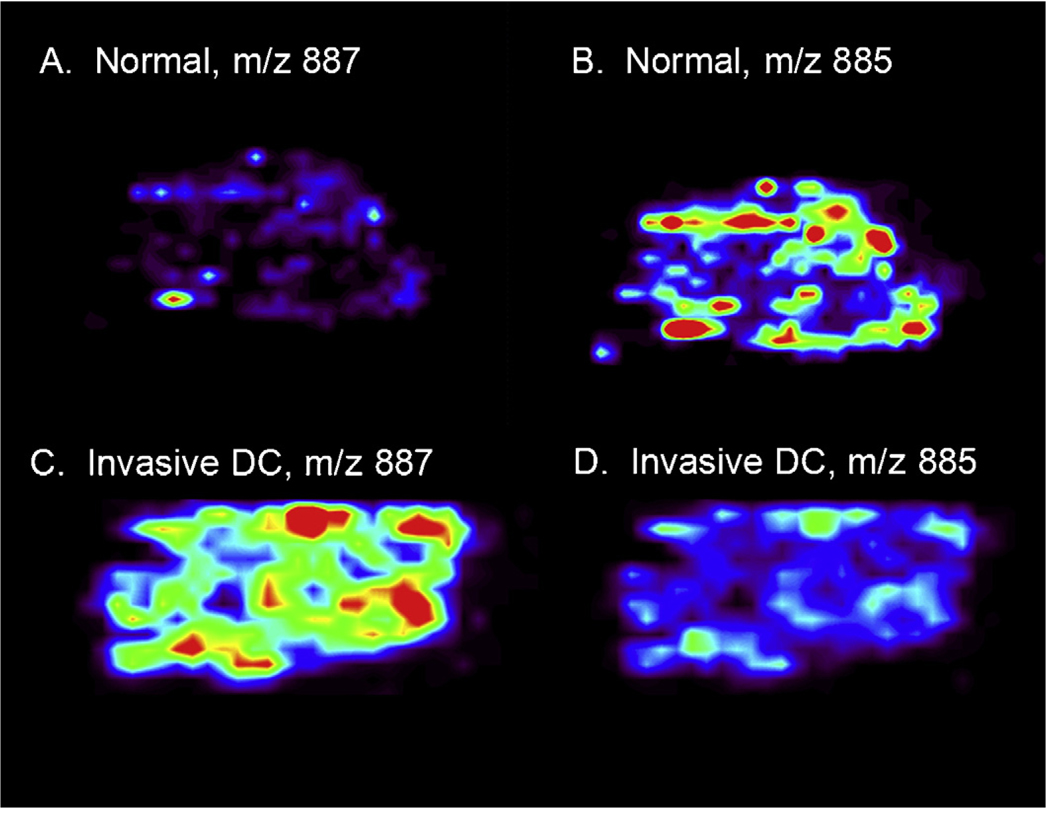
Preliminary data from a small set of breast tissue sample shows the potential of DESI tissue imaging to distinguish between normal or benign, ductal carcinoma in situ (DCIS), and invasive ductal carcinoma (DC) specimens. The distribution of two lipid ions, ionized in the negative mode, at m/z 863 and m/z 818, were seen in benign breast tissue, DCIS, and DC. The intensities of the two ions are vastly different between the tissue samples and are tentatively identified as a phosphatidylinositol and a phosphotidylserine. Neither lipid species is present in the benign breast tissue at levels greater than the spectral noise, but both species are present in the DC tissue samples. In contrast the DCIS sample displays significant signal for the molecule at m/z 863, but virtually no signal for the molecule at m/z 818. These results show promise for the use of DESI IMS to distinguish between not only cancerous and non-cancerous tissue, but also to identify the specific type and stage of the cancer. Other lipid ions, at m/z 887 and m/z 885 also show differences between benign tissue and invasive ductal carcinoma as seen in Fig. 6. Normal tissue shows high signal intensity for m/z 885, but no signal for m/z 887, where in contrast DC tissue shows high signal intensity for m/z 887 and virtually no signal at m/z 885. The instrument and associated parameters used for this experiment are described previously, with additional parameters of a volumetric flow rate of 1.5 µL min−1, a spray solvent of acetonitrile/water (40:60, v/v), the tissue cut to a thickness of 12 µm, a stage velocity of 180 µm min−1 during data acquisition, and a spatial resolution of 200 µm [46]. Further work mapping more ion signals in both positive and negative mode are anticipated to allow for increased specificity of disease diagnosis.
Fig. 6.
Human breast tissue section showing negative ion mass spectrometry images. (A) Distribution of m/z 887 in normal tissue. (B) Distribution of m/z 885 in normal tissue. (C) Distribution of m/z 887 in invasive DC. (D) Distribution of m/z 885 in invasive DC. Unpublished data; false colors show intensity; tissue shown is approx. 6 mm by 4.2 mm by 10 µm.
The data collection process for DESI IMS is completely automated using XCalibur 2.0 software from Thermo Fisher Scientific, San Jose, CA, USA, an in-house program allows the conversion of these raw files into a format acceptable for use in the BioMap (freeware, www.msi.maldi.org) software. BioMap is an image analysis software platform allowing for the generation of the spatial intensity distributions of selected ions as seen in the images presented in this paper. With an assembled library of compounds denoting benign versus cancerous tissue the bioinformatics of the process could also be automated. This would provide healthcare workers with an automated, reliable process for diagnosis.
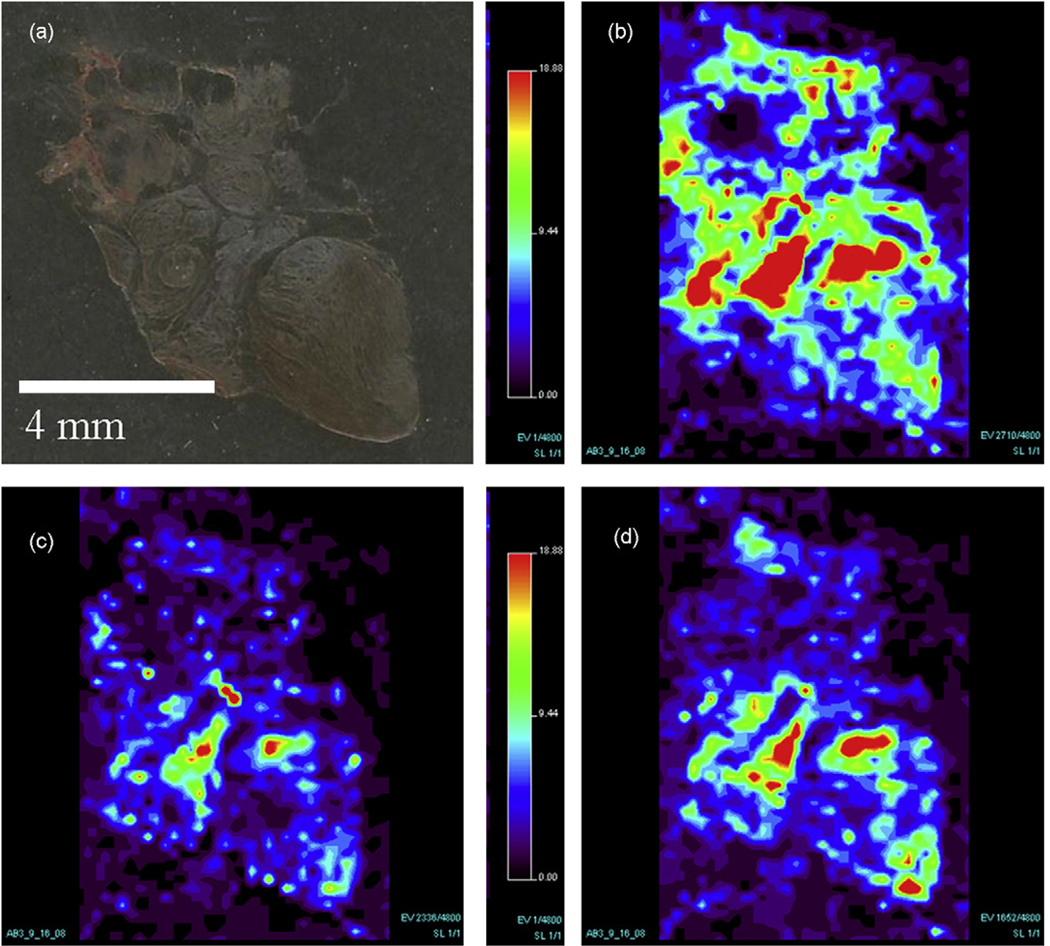
A wide range of tissue types, as evidenced by the experiments conducted on rat brain [31], human liver adenocarcinoma [46], and human breast cancer tissue have been successfully imaged by DESI-MS. Preliminary studies have shown that DESI can be used to successfully image canine tumor tissue. Fig. 7 shows the optical image as well as the molecular images of a canine abdominal tumor. The instrument and associated parameters used for this experiment are as described previously, with additional parameters of a volumetric flow rate of 1.5 µL min−1, a spray solvent of acetonitrile/water (50:50, v/v), the tissue cut to a thickness of 15 µm, a stage velocity of 229 µm min−1 during data acquisition, and a spatial resolution of 250 µm [46]. The compounds present in the mass spectra have not yet been positively identified, but can be described as phospholipids species.
Fig. 7.
Canine abdominal tumor tissue showing (a) optical image of tissue section and (b)–(d) the negative ion mass spectrometry images of the molecules. (b) Molecular ion m/z 826. (c) Molecular ion m/z 795. (d) Molecular ion m/z 738.
5. Conclusion
The ability of DESI-MS to successfully image lipid species in thin tissue sections with little sample preparation is proving to be a potentially useful approach in the biological sciences. The diagnostic value of the lipids in many different disease states opens up the possibility for many applications of this technology and for this approach to have an impact in a clinical as well as a research setting. With these experiments serving as a foundation for future experiments under ambient conditions both in vitro and in vivo, it paves the way for a real time surgical tool to detect changes in lipid composition and distribution providing diagnostic value.
Acknowledgments
The authors would like to thank Dr. Lynetta Freeman for supplying the canine abdominal tumor tissue specimen and Dr. Robert Hickey at the School of Medicine of Indiana University for supplying the breast tissues. The authors acknowledge support from the National Science Foundation, Prosolia, Inc., Indianapolis, IN, Indiana Twenty-First Century Technology and Research fund, Office of Naval Research, and NIH/NIGMS Grant No. 5R01 GM58008-07.
Footnotes
This paper is part of the special issue “Lipidomics: Developments and Applications”, X. Han (Guest Editor).
References
- 1.Watson AD. J. Lipid Res. 2006;47:2101. doi: 10.1194/jlr.R600022-JLR200. [DOI] [PubMed] [Google Scholar]
- 2.Vance DE, Vance JE. Biochemistry of Lipids, Lipoproteins and Membranes. New York: Elsevier; 2002. [Google Scholar]
- 3.Montine TJ, Neely MD, Quinn JF, Beal MF, Markesbery WR, Roberts LJ, Morrow JD. Free Radic. Biol. Med. 2002;33:620. doi: 10.1016/s0891-5849(02)00807-9. [DOI] [PubMed] [Google Scholar]
- 4.Athar M. Indian J. Exp. Biol. 2002;40:656. [PubMed] [Google Scholar]
- 5.Polidori MC, Pratico D, Savino K, Rokach J, Stahl W, Mecocci P. J. Card. Fail. 2004;10:334. doi: 10.1016/j.cardfail.2003.11.004. [DOI] [PubMed] [Google Scholar]
- 6.Pratico D, Iuliano L, Mauriello A, Spagnoli L, Lawson JA, Maclouf J, Violi F, FitzGerald GA. J. Clin. Invest. 1997;100:2028. doi: 10.1172/JCI119735. [DOI] [PMC free article] [PubMed] [Google Scholar]
- 7.Morrow JD. Arterioscler. Thromb. Vasc. Biol. 2005;25:279. doi: 10.1161/01.ATV.0000152605.64964.c0. [DOI] [PubMed] [Google Scholar]
- 8.Aboagye EO, Bhujwalla ZM. Cancer Res. 1999;59:80. [PubMed] [Google Scholar]
- 9.Glunde K, Jie C, Bhujwalla ZM. Cancer Res. 2004;64:4270. doi: 10.1158/0008-5472.CAN-03-3829. [DOI] [PubMed] [Google Scholar]
- 10.Crawford CG, Plattner RD. J. Lipid Res. 1983;24:456. [PubMed] [Google Scholar]
- 11.Jungalwala FB, Evans JE, McCluer RH. J. Lipid Res. 1984;25:738. [PubMed] [Google Scholar]
- 12.Jensen NJ, Tomer KB, Gross ML. Lipids. 1987;22:480. doi: 10.1007/BF02540363. [DOI] [PubMed] [Google Scholar]
- 13.Murphy RC, Harrison KA. Mass Spectrom. Rev. 1994;13:57. [Google Scholar]
- 14.Kerwin JL, Tuininga AR, Ericsson LH. J. Lipid Res. 1994;35:1102. [PubMed] [Google Scholar]
- 15.Kim HY, Wang TCL, Ma YC. Anal. Chem. 1994;66:3977. doi: 10.1021/ac00094a020. [DOI] [PubMed] [Google Scholar]
- 16.Berry KAZ, Murphy RC. J. Am. Soc. Mass Spectrom. 2004;15:1499. doi: 10.1016/j.jasms.2004.07.009. [DOI] [PubMed] [Google Scholar]
- 17.Ostrowski SG, Van Bell CT, Winograd N, Ewing AG. Science. 2004;305:71. doi: 10.1126/science.1099791. [DOI] [PMC free article] [PubMed] [Google Scholar]
- 18.Sjovall P, Lausmaa J, Johansson B. Anal. Chem. 2004;76:4271. doi: 10.1021/ac049389p. [DOI] [PubMed] [Google Scholar]
- 19.Brunelle A, Touboul D, Laprevote O. J. Mass Spectrom. 2005;40:985. doi: 10.1002/jms.902. [DOI] [PubMed] [Google Scholar]
- 20.Harvey DJ. J. Mass Spectrom. 1995;30:1333. [Google Scholar]
- 21.Rujoi M, Estrada R, Yappert MC. Anal. Chem. 2004;76:1657. doi: 10.1021/ac0349680. [DOI] [PubMed] [Google Scholar]
- 22.Schiller J, Arnhold J, Benard S, Muller M, Reichl S, Arnold K. Anal. Biochem. 1999;267:46. doi: 10.1006/abio.1998.3001. [DOI] [PubMed] [Google Scholar]
- 23.Takats Z, Wiseman JM, Gologan B, Cooks RG. Science. 2004;306:471. doi: 10.1126/science.1104404. [DOI] [PubMed] [Google Scholar]
- 24.Venter A, Sojka PE, Cooks RG. Anal. Chem. 2006;78:8549. doi: 10.1021/ac0615807. [DOI] [PubMed] [Google Scholar]
- 25.Iribarne JV, Thomson BA. J. Chem. Phys. 1976;64:2287. [Google Scholar]
- 26.Dole M, Mack LL, Hines RL, Mobley RC, Ferguson LP, Alice MB. J. Chem. Phys. 1968;49:2240. [Google Scholar]
- 27.Ifa DR, Manicke NE, Dill AL, Cooks G. Science. 2008;321:805. doi: 10.1126/science.1157199. [DOI] [PubMed] [Google Scholar]
- 28.Ifa DR, Gumaelius L, Eberlin LS, Manicke N, Cooks RG. Analyst. 2007;132:461. doi: 10.1039/b700236j. [DOI] [PubMed] [Google Scholar]
- 29.D’Agostino PA, Hancock JR, Chenier CL, Lepage CRJ. J. Chromatogr. A. 2006;1110:86. doi: 10.1016/j.chroma.2006.01.083. [DOI] [PubMed] [Google Scholar]
- 30.Ifa DR, Wiseman JM, Song QY, Cooks RG. Int. J. Mass Spectrom. 2007;259:8. [Google Scholar]
- 31.Wiseman JM, Ifa DR, Song Q, Cooks RG. Angew. Chem., Int. Ed. 2006;45:7188. doi: 10.1002/anie.200602449. [DOI] [PubMed] [Google Scholar]
- 32.Chen HW, Pan ZZ, Talaty N, Raftery D, Cooks RG. Rapid Commun. Mass Spectrom. 2006;20:1577. doi: 10.1002/rcm.2474. [DOI] [PubMed] [Google Scholar]
- 33.Pan ZZ, Gu HW, Talaty N, Chen HW, Shanaiah N, Hainline BE, Cooks RG, Raftery D. Anal. Bioanal. Chem. 2007;387:539. doi: 10.1007/s00216-006-0546-7. [DOI] [PubMed] [Google Scholar]
- 34.Chen HW, Li M, Zhou JG, Fei Q, Jiang J, Jin QH, Zhang TM, Zhang X. Chem. J. Chin. Univ. 2006;27:1439. [Google Scholar]
- 35.Mulligan CC, Talaty N, Cooks RG. Chem. Commun. 1709;2006 doi: 10.1039/b517357d. [DOI] [PubMed] [Google Scholar]
- 36.Hu QZ, Talaty N, Noll RJ, Cooks RG. Rapid Commun. Mass Spectrom. 2006;20:3403. doi: 10.1002/rcm.2757. [DOI] [PubMed] [Google Scholar]
- 37.Talaty N, Takats Z, Cooks RG. Analyst. 2005;130:1624. doi: 10.1039/b511161g. [DOI] [PubMed] [Google Scholar]
- 38.Song YS, Talaty N, Tao WA, Pan ZZ, Cooks RG. Chem. Commun. 2007:61. doi: 10.1039/b615724f. [DOI] [PubMed] [Google Scholar]
- 39.Nefliu M, Venter A, Cooks RG. Chem. Commun. 2006:888. doi: 10.1039/b514057a. [DOI] [PubMed] [Google Scholar]
- 40.Jackson AT, Williams JP, Scrivens JH. Rapid Commun. Mass Spectrom. 2006;20:2717. doi: 10.1002/rcm.2660. [DOI] [PubMed] [Google Scholar]
- 41.Shin YS, Drolet B, Mayer R, Dolence K, Basile F. Anal. Chem. 2007;79:3514. doi: 10.1021/ac062451t. [DOI] [PMC free article] [PubMed] [Google Scholar]
- 42.Cotte-Rodriguez I, Cooks RG. Chem. Commun. 2006:2968. doi: 10.1039/b606020j. [DOI] [PubMed] [Google Scholar]
- 43.Takats Z, Cotte-Rodriguez I, Talaty N, Chen HW, Cooks RG. Chem. Commun. 2005:1950. doi: 10.1039/b418697d. [DOI] [PubMed] [Google Scholar]
- 44.Manicke NE, Wiseman JM, Ifa DR, Cooks RG. J. Am. Soc. Mass Spectrom. 2008;19:531. doi: 10.1016/j.jasms.2007.12.003. [DOI] [PubMed] [Google Scholar]
- 45.Song Y, Talaty N, Tao WA, Pan Z, Cooks RG. Chem. Commun. 2006:61. doi: 10.1039/b615724f. [DOI] [PubMed] [Google Scholar]
- 46.Wiseman JM, Puolitaival SM, Takats Z, Cooks RG, Caprioli R. Angew. Chem., Int. Ed. 2005;44:7094. doi: 10.1002/anie.200502362. [DOI] [PubMed] [Google Scholar]
- 47.Caprioli RM, Farmer TB, Gile J. Anal. Chem. 1997;69:4751. doi: 10.1021/ac970888i. [DOI] [PubMed] [Google Scholar]
- 48.Pacholski ML, Winograd N. Chem. Rev. 1999;99:2977. doi: 10.1021/cr980137w. [DOI] [PubMed] [Google Scholar]
- 49.Stoeckli M, Chaurand P, Hallahan DE, Caprioli RM. Nat. Med. 2001;7:493. doi: 10.1038/86573. [DOI] [PubMed] [Google Scholar]
- 50.Chen YF, Allegood J, Liu Y, Wang E, Cachon-Gonzalez B, Cox TM, Merrill AH, Sullards MC. Anal. Chem. 2008;80:2780. doi: 10.1021/ac702350g. [DOI] [PubMed] [Google Scholar]
- 51.Doroshenko VM, Laiko VV, Taranenko NI, Berkout VD, Lee HS. Int. J. Mass Spectrom. 2002;221:39. [Google Scholar]
- 52.Laiko VV, Baldwin MA, Burlingame AL. Anal. Chem. 2000;72:652. doi: 10.1021/ac990998k. [DOI] [PubMed] [Google Scholar]
- 53.Kellersberger KA, Tan PV, Laiko VV, Doroshenko VM, Fabris D. Anal. Chem. 2004;76:3930. doi: 10.1021/ac0498415. [DOI] [PubMed] [Google Scholar]
- 54.Moyer SC, Marzilli LA, Woods AS, Laiko VV, Doroshenko VM, Cotter RJ. Int. J. Mass Spectrom. 2003;226:133. [Google Scholar]
- 55.Laiko VV, Moyer SC, Cotter RJ. Anal. Chem. 2000;72:5239. doi: 10.1021/ac000530d. [DOI] [PubMed] [Google Scholar]
- 56.Seeley EH, Oppenheimer SR, Mi D, Chaurand P, Caprioli RM. DESORPTION 2006 Meeting; Kifissia, Greece: Elsevier Science Inc.; 2006. p. 1069. [Google Scholar]
- 57.Schwartz SA, Reyzer ML, Caprioli RM. J. Mass Spectrom. 2003;38:699. doi: 10.1002/jms.505. [DOI] [PubMed] [Google Scholar]
- 58.Nemes P, Barton AA, Li Y, Vertes A. Anal. Chem. 2008;80:4575. doi: 10.1021/ac8004082. [DOI] [PubMed] [Google Scholar]
- 59.Nemes P, Vertes A. Anal. Chem. 2007;79:8098. doi: 10.1021/ac071181r. [DOI] [PubMed] [Google Scholar]
- 60.Shiea J, Huang MZ, HSu HJ, Lee CY, Yuan CH, Beech I, Sunner J. Rapid Commun. Mass Spectrom. 2005;19:3701. doi: 10.1002/rcm.2243. [DOI] [PubMed] [Google Scholar]
- 61.Huang MZ, Hsu HJ, Lee LY, Jeng JY, Shiea LT. J. Proteome Res. 2006;5:1107. doi: 10.1021/pr050442f. [DOI] [PubMed] [Google Scholar]
- 62.Touboul D, Halgand F, Brunelle A, Kersting R, Tallarek E, Hagenhoff B, Laprevote O. Anal. Chem. 2004;76:1550. doi: 10.1021/ac035243z. [DOI] [PubMed] [Google Scholar]
- 63.Todd PJ, Schaaff TG, Chaurand P, Caprioli RM. J. Mass Spectrom. 2001;36:355. doi: 10.1002/jms.153. [DOI] [PubMed] [Google Scholar]
- 64.Walker AV. Anal. Chem. 2008;80:8865. doi: 10.1021/ac8013687. [DOI] [PubMed] [Google Scholar]
- 65.Benguerba M, Brunelle A, Dellanegra S, Depauw J, Joret H, Lebeyec Y, Blain MG, Schweikert EA, Benassayag G, Sudraud P. Nucl. Instrum. Methods Phys. Res., Sect. B. 1991;62:8. [Google Scholar]
- 66.Kollmer F. 14th International Conference on Secondary Ion Mass Spectrometry (SIMS 14); San Diego, CA: Elsevier Science; 2003. p. 153. [Google Scholar]
- 67.Kersting R, Hagenhoff B, Kollmer F, Mollers R, Niehuis E. 14th International Conference on Secondary Ion Mass Spectrometry (SIMS 14); San Diego, CA: Elsevier Science Inc.; 2003. p. 261. [Google Scholar]
- 68.Nagy G, Walker AV. Int. J. Mass Spectrom. 2007;262:144. [Google Scholar]
- 69.Carado A, Passarelli MK, Kozole J, Wingate JE, Winograd N, Loboda AV. Anal. Chem. 2008;80:7921. doi: 10.1021/ac801712s. [DOI] [PMC free article] [PubMed] [Google Scholar]
- 70.Fletcher JS, Lockyer NP, Vaidyanathan S, Vickerman JC. Anal. Chem. 2007;79:2199. doi: 10.1021/ac061370u. [DOI] [PubMed] [Google Scholar]
- 71.Mahoney CM, Fahey AJ, Gillen G, Xu C, Batteas JD. Anal. Chem. 2007;79:837. [Google Scholar]
- 72.Sjovall P, Lausmaa J, Nygren H, Carlsson L, Malmberg P. Anal. Chem. 2003;75:3429. doi: 10.1021/ac0207675. [DOI] [PubMed] [Google Scholar]
- 73.Kertesz V, Van Berkel GJ. Rapid Commun. Mass Spectrom. 2008;22:2639. doi: 10.1002/rcm.3662. [DOI] [PubMed] [Google Scholar]
- 74.Wiseman JM, Ifa DR, Cooks RG, Venter A. Nat. Protoc. 2008;3:517. doi: 10.1038/nprot.2008.11. [DOI] [PubMed] [Google Scholar]
- 75.Kertesz V, Van Berkel GJ, Vavrek M, Koeplinger KA, Schneider BB, Covey TR. Anal. Chem. 2008;80:5168. doi: 10.1021/ac800546a. [DOI] [PubMed] [Google Scholar]
- 76.Argonoff BW, Benjamins JA, Hajra AK. Basic Neurochemistry: Molecular, Cellular, and Medical Aspects. Philadelphia: Lippincott-Raven Publishers; 1994. p. 48. [Google Scholar]


