

Abstract
Objective
To identify differences in amount and distribution of fat and lean soft tissue in subjects with and without type 2 diabetes and to determine whether any differences are affected by race/ethnicity or sex.
Design
Overweight and obese (body mass index, BMI≥25 kg/m2) Black, White and Hispanic men (490) and women (825) with type 2 diabetes ([mean±SD] age 58.5±6.6; BMI 35.3±5.3) who had a baseline dual energy x-ray absorptiometry whole body scan at the time of enrollment in the Look Ahead clinical trial, and 242 healthy controls, 91 males and 151 females (age 55.3±8.6 y, BMI 30.7±4.2 kg/m2) who were participating in unrelated research and were scanned on the same densitometers.
Results
Adjusted for covariates, total fat mass was smaller in persons with type 2 diabetes than in controls (−1.4±0.3[SE]; 34.5 vs 35.8 kg, p<0.001) while trunk fat was larger (1.3±0.2[SE]; 19.9 vs 18.6 kg, p<0.001) and leg fat was smaller (−1.5±0.2[SE]; 10.7 vs 12.3 kg, p<0.001). The arms of subjects with type 2 diabetes did not have significantly less fat compared to controls. Adjusted trunk lean mass was larger in type 2 diabetes by 0.6 kg (28.4 vs 27.8 kg, p<0.001) while leg lean was smaller by 0.5 kg (18.1 vs 18.6 kg, p<0.001).
Conclusions
Type 2 diabetes is associated with less total fat, leg fat and leg lean mass and more truncal fat and lean mass than controls. The physiological processes producing these deviations in tissue distribution and their metabolic significance warrant further investigation.
(ClinicalTrials.gov number, NCT00017953)
Keywords: type 2 diabetes, body composition, lean mass, fat mass, obesity
Introduction
Fat distribution, as well as total adiposity, has important associations with diabetes and risk of cardiovascular disease (CVD) and may play a causal role in their development (1-4). Alternatively, body composition may be altered by the disease process. In either case, a clear understanding of the nature and degree of the alterations is necessary to provide a basis for further investigation into the underlying physiological processes.
Several studies have used dual energy x-ray absorptiometry (DXA) to study fatness and fat distribution in persons with type 2 diabetes mellitus compared with healthy controls. The results have not been entirely consistent. Svendsen & Hassager reported more total body fat (TBF) in premenopausal but not postmenopausal women with type 2 diabetes compared with healthy controls (5). Maiolo et al., in a study of body composition and pulmonary function in matched type 2 diabetes and control groups of women reported more lean mass and non-significantly less fat mass in type 2 diabetes (6). Poynten et al. observed no difference in percent TBF between weight and BMI-matched controls and subjects with type 2 diabetes (7). Studies that report fat as a proportion of total body weight often find subjects with type 2 diabetes to have higher percent fat (8).
Many, but not all, studies have observed larger abdominal fat deposits in type 2 diabetes (6, 9). Stoney et al. found no differences in overall fatness between matched groups of postmenopausal women but observed less lower body (leg) fat in the group with type 2 diabetes (10). Tafeit et al. made subcutaneous adipose tissue measures at sites distributed over the entire body of subjects with type 2 diabetes and controls using an optical device (lipometer). They documented more upper trunk and less leg subcutaneous adipose tissue in women with type 2 diabetes than in control women (11).
Although larger fat masses are generally associated with greater risk, it has been proposed that greater amounts of leg and thigh fat may be associated with less CVD risk or may be protective against CVD (10, 12-14). Recently, Snijder et al. found smaller amounts of leg fat to have independent positive associations with elevated fasting and 2-hr glucose levels in a sample of normal glucose tolerant, impaired glucose tolerant and diabetic subjects (15). In another study, Snijder et al. reported positive associations of leg fat mass with less peripheral arterial stiffness (16).
Many of the published reports of such alterations in body composition were limited in the ethnic composition of the sample, were studied an elderly population, or had low power to detect small differences and interactions. There are also unanswered questions about the amount and distribution of lean soft tissue in relation to disease status and whether arm fat or arm lean mass as well as leg fat or leg lean mass may have independent associations with type 2 diabetes.
A substudy of the Look Ahead clinical trial provided an opportunity to investigate these questions using DXA in a large sample of well characterized patients with type 2 diabetes and to compare amounts and distributions of body tissue with a sample of healthy control subjects. The objective of this substudy were to identify differences in total amount and distribution of tissues in subjects with and without type 2 diabetes after controlling for potential confounders, and to determine whether any differences observed are modified by race/ethnicity or sex.
Methods
A subset of the subjects enrolling in the Look Ahead study, an NIH-sponsored multi-center randomized clinical trial of the effects of intentional weight loss interventions on the incidence of major cardiovascular events in overweight and obese persons diagnosed with type 2 diabetes (17), underwent baseline whole body DXA scans at one of five clinical study sites (Baton Rouge, Boston, Houston, Los Angeles, Seattle). Enrollment criteria included age (≥45 y), overweight and obese (BMI ≥25 kg/m2) and diagnosed type 2 diabetes. A complete description of enrollment criteria is found elsewhere (17).
All sites used Hologic QDR4500A densitometers except for Boston (Hologic Delphi A). Any software upgrades during the study were approved and monitored by the central DXA reading center (Prevention Sciences Group, University of California at San Francisco). Participant scans were centrally monitored for quality. A set of traveling phantoms (spine, hip, linearity and whole body) was scanned on all densitometers to assess differences across machines. A quality control program was in place that included regular scans of spine and whole body phantoms and air scans at all sites. The records of these QC scans were reviewed and monitored by the DXA reading center. The regions of interest used in this study (leg, trunk, arm) are those provided by the software default, adjusted by the DXA operator in those cases where the software obviously failed to achieve the intended anatomical demarcations. The principles of the DXA methodology provide a 2-compartment measurement of fat and fat-free mass on the molecular level, and the fat-free component can be subdivided into bone mineral and soft tissue. The term lean tissue as used in our text and tables refers to lean soft tissue.
In addition to the subjects with type 2 diabetes, data were available from a sample of healthy men and women participating in unrelated research at two of the five clinical sites (Baton Rouge and Los Angeles) who were scanned on the same densitometers as used for the Look Ahead subjects. Control subjects were selected to meet the same age and BMI minimum values as Look AHEAD subjects.
Relevant biographical and medical data for Look AHEAD study subjects were obtained from the coordinating center for the Look Ahead study (Wake Forest University Baptist Medical Center). Race/ethnicity was classified as Hispanic, non-Hispanic White (White) and non-Hispanic Black (Black) according to self-report. Our study sample was restricted to Black, White and Hispanic race/ethnicity groups because adequate numbers of control subjects were not available for other groups.
Statistical Analysis
General linear models were used to evaluate the independent associations of diabetes status with whole body fat and lean tissue, and fat/lean tissue distribution in the trunk, leg, and arm regions. A dummy variable for clinical site was included in all models. Variables entered in the models along with diabetes status and site included weight (in whole body analyses) or whole body fat/lean mass (in models of fat/lean distribution), height, age, gender and race/ethnicity group. All outcome variables were tested for normality, and no transformations were found to be necessary. Correlations between covariates were checked to be sure that all variables could be appropriately adjusted for simultaneously. Potential non-linear trends between all continuous covariates and outcome variables were assessed and none were found. All 2 and 3-way interaction terms of categorical variables, and all 2-way interactions with continuous variables were tested for significance and were removed if found non-significant. Residuals were checked for normality and homoscedasticity.
Analyses were carried out using SAS v 9.1 (Cary, NC). P<0.05 was set as the significance level. Multiple comparisons were Tukey-Kramer adjusted.
Results
Subject characteristics
Characteristics of subjects in this study are listed in Tables 1 (men) and 2 (women). Mean duration since diagnosis of diabetes in the Look Ahead participants was 6.7±6.5 years. Despite the same BMI and age eligibility cut-off values for the control and type 2 diabetes samples, the control group was younger, weighed less and was of smaller body habitus as assessed by BMI (p<005), although the range of data points was similar (type 2 diabetes, age 45-76 y, BMI 25-54, weight 58-160 kg; controls age 45-75 y, BMI 25-49, weight 58-142 kg). Because of these differences in mean values we do not present unadjusted comparisons of any body composition compartments.
Table 1.
Subject Characteristics, Mean±SD (Range): Men
| Black | Hispanic | White | ||||
|---|---|---|---|---|---|---|
| Type 2 Diabetes | Control | Type 2 Diabetes | Control | Type 2 Diabetes | Control | |
| N | 29 | 17 | 97 | 10 | 366 | 64 |
| Age, yr | 60±7 (46-73) | 52±6 (45-69) | 59±6 (46-70) | 59±4 (54-66) | 61±7 (45-76) | 58±10 (45-74) |
| Weight, kg | 107±16 (78-150) | 92±13 (69-113) | 98±15 (65-140) | 81±7 (72-94) | 106±14 (73-160) | 95±14 (71-132) |
| Height, cm | 175±7 (162-189) | 175±7 (165-189) | 169±6 (151-185) | 170±5 (162-175) | 176±6 (159-194) | 178±7 (159-195) |
| BMI, kg/m2 | 35±5 (27-51) | 30±4 (25-37) | 34±4 (27-46) | 28±2 (26-32) | 34±5 (25-50) | 30±4 (25-41) |
| Fat, kg | 31±9 (19-54) | 24±8 (12-43) | 31±9 (17-64) | 21±4 (15-29) | 33±9 (16-64) | 26±8 (16-55) |
| % Fat | 29±6 (17-41) | 25±6 (17-40) | 31±5 (22-49) | 26±3 (22-34) | 31±5 (20-47) | 27±5 (18-44) |
| Lean, kg | 71±9 (51-88) | 66±6 (54-76) | 64±7 (46-84) | 57±6 (48-68) | 69±7 (51-89) | 66±8 (50-84) |
| BMC, kg | 3.0±0.4 (2.3-3.9) | 2.8±0.3 (2.4-3.4) | 2.5±0.4 (1.6-3.4) | 2.5±0.5 (1.8-3.6) | 2.8±0.4 (1.6-4.2) | 2.7±0.4 (1.7-3.9) |
Because control subjects weigh less and are of lower BMI than corresponding type 2 diabetes subjects (both p<0.005), we do not present statistical comparisons of unadjusted body compartment
Table 2.
Subject Characteristics, Mean±SD (Range): Women
| Black | Hispanic | White | ||||
|---|---|---|---|---|---|---|
| Type 2 Diabetes | Control | Type 2 Diabetes | Control | Type 2 Diabetes | Control | |
| N | 118 | 46 | 282 | 11 | 426 | 94 |
| Age, yr | 57±6 (45-74) | 50±6 (45-73) | 57±6 (45-73) | 60±6 (47-69) | 58±7 (45-75) | 56±8 (45-75) |
| Weight, kg | 100±16 (63-140) | 85±13 (68-142) | 84±14 (58-133 | 75±9 (58-87) | 97±16 (63-137) | 82±14 (59-130) |
| Height, cm | 163±7 (150-180) | 163±6 (148-174) | 156±6 (137-171) | 155±6 (143-161) | 163±6 (146-180) | 163±6 (147-177) |
| BMI, kg/m2 | 38±6 (27-54) | 32±4 (26-48) | 35±5 (27-53) | 32±3 (28-37) | 36±6 (26-53) | 31±5 (25-49) |
| Fat, kg | 43±11 (24-67) | 36±8 (23-69) | 35±9 (20-71) | 31±4 (22-37) | 42±10 (20-70) | 34±9 (20-67) |
| % Fat | 43±5 (28-55) | 41±4 (32-51) | 41±4 (29-54) | 41±2 (38-43) | 43±5 (27-55) | 41±4 (34-53) |
| Lean, kg | 54±6 (36-71) | 48±6 (38-70) | 47±6 (34-63) | 43±5 (34-49) | 52±7 (34-75) | 46±6 (34-68) |
| BMC, kg | 2.5±0.3 (1.6-3.6) | 2.2±0.3 (1.5-2.9) | 2.0±0.3 (1.1-2.9) | 1.8±0.3 (1.4-2.3) | 2.2±0.3 (1.3-4.0) | 2.1±0.3 (1.5-2.9) |
Because control subjects weigh less and are of lower BMI than corresponding type 2 diabetes subjects (both p<0.005), we do not present statistical comparisons of unadjusted body compartment
Since our analyses compare fatness adjusted for weight between subjects with type 2 diabetes and controls it was important to verify that a similar relationship existed between weight and fat mass in the two groups. Scatter plots of fat mass vs weight showed that over the observed range the relationships were linear in both groups and that the regression coefficients of fat mass on weight in the two groups were not different (p=0.24) (Figure 1).
Figure 1.

Relationship of whole body fat mass to body weight in type 2 diabetes (left panel) and control (right panel) groups.
Total body fat and lean mass in diabetic and control subjects
In a multiple regression model, total body fat mass was independently associated with diabetes status as well as with weight, gender, height, race/ethnicity, and age (all p<0.001). After adjustment for covariates, persons with type 2 diabetes had 1.36 (SE 0.28) kg less fat mass than controls (means 34.5 vs 35.8 kg, p<0.001) (Table 3). There was no interaction of diabetes status with race/ethnicity or gender indicating that the finding of less fat mass in type 2 diabetes held across all race/ethnicity and gender combinations. A significant 2-way race/ethnicity by gender interaction (p<0.001) indicated that adiposity varied by gender and race/ethnicity. Adjusted for weight, height, age and clinical site, Black men had the least total body fat (27.8 kg; SE 0.5) and Hispanic men the most (31.2 kg; SE 0.4), while among women, Hispanics had the least total body fat (40.3 kg; SE 0.4) and Whites had the most (40.8 kg; SE 0.2).
Table 3.
Whole body fat, lean soft tissue and bone mineral, regression coefficients (±s.e.)
| Diabetes status (D) |
Gender (G) | Race (R) | Weight kg |
Height cm |
Age yr |
Interactions | R2 | |
|---|---|---|---|---|---|---|---|---|
| Fat, kg | −1.36±0.28 | 10.64±0.29 | Black −2.33±0.52 Hisp. 1.06±0.46* White Reference |
0.63±0.01 | −0.28±0.02 | 0.09±0.01 | GxR, p<0.001 | 0.90 |
| Lean, kg | 1.31±0.28 | −10.23±0.29 | Black 1.92±0.52 Hisp. −1.70±0.46* White Reference |
0.32±0.01 | 0.29±0.02 | −0.09±0.01 | GxR, P<0.001 | 0.91 |
| Bone mineral, g |
1.0±23 ns | −176±22 | Black 178±22 Hisp −27±30 ns White Reference |
6±1 | 24±1 | −2±1 ns | none | 0.66 |
Diabetes status coded as control subject 0, type 2 diabetes 1; gender: male 0, female 1
Coefficients for sites and intercept not shown
Unless otherwise indicated coefficients are different from zero at p<0.001
not significant
0.001≤p≤0.05
GxR Gender by race/ethnicity interaction
The finding of less total fat mass in diabetic subjects was confirmed by an analysis with whole body lean mass as the dependent variable. Adjusted for race, gender, age, height, weight, clinical site and interactions, as in the model for fat mass, subjects with diabetes had 1.3 kg (SE 0.28) more lean body mass than healthy controls (p<0.001) (Table 3).
Trunk fat and lean mass in diabetic and control subjects
Although subjects with type 2 diabetes had relatively less fat mass than controls, a second question was how fat mass was distributed along the truncal/peripheral dimension as measured by DXA. Regression models showed independent associations of trunk fat adjusted for total fat with diabetes status, gender, race/ethnicity (all p<0.001), height (p=0.02), age (p=0.08) and clinical site. After adjustment for these other variables, the diabetes group had a mean of 1.28 (SE 0.16) kg more trunk fat than controls (19.9 vs 18.6 kg, p<0.001) (Table 4). Trunk lean mass adjusted for total lean mass was greater in the diabetes group by 0.61 kg (28.4 vs 27.8 kg, p<0.001). Therefore both fat and lean masses are relatively larger in the truncal region of subjects with type 2 diabetes compared to controls. There were no interactions with race/ethnicity or gender.
Table 4.
Regional distribution of fat and lean soft tissue: regression coefficients (±s.e.)
| Diabetes status (D) |
Gender (G) | Race (R) | Total fat / lean1, kg |
Height Cm |
Age yr |
Interactions | R-sq | |
|---|---|---|---|---|---|---|---|---|
| Trunk | ||||||||
| Fat, kg | 1.28±0.16 | −2.25±0.16 | Black −1.35±0.15 Hisp. −0.01±0.21 ns White Reference |
0.55±0.01 | −.019±0.01* | −.013±0.01ns | none | 0.90 |
| Lean, kg | 0.61±0.08 | 0.76±0.09 | Black −1.78±0.08 Hisp. −0.11±0.11 ns White Reference |
0.49±0.00 | 0.01±0.01 ns | 0.02±0.00 | none | 0.97 |
| Legs | ||||||||
| Fat, kg | −1.51±0.16 | 1.93±0.17 | Black 1.29±0.16 Hisp. −0.13±0.21 ns White Reference |
0.33±0.01 | 0.03±0.01 | 0.01±0.01ns | none | 0.80 |
| Lean, kg | −0.49±0.08 | 0.72±0.09 | Black 1.12±0.08 Hisp. −0.10±0.10 ns White Reference |
0.37±0.00 | −0.01±0.01 ns | −0.02±0.00 | none | 0.94 |
| Arms | ||||||||
| Fat, kg | −0.01±0.09ns | 0.18±0.11 ns | Black 0.01±0.06 ns Hisp. 0.19±0.05 White Reference |
0.11±0.00 | −0.01±0.00 | 0.01±0.00* | DxG, p<0.001 |
0.77 |
| Lean, kg | −0.05±0.05 ns | −1.33±0.06 | Black 0.58±0.09 Hisp. −0.07±0.08 ns White Reference |
0.11±0.00 | −0.00±0.00 ns | −0.00±0.00 ns | 0.89 |
Diabetes status coded as control subject 0, type 2 diabetes 1; gender: male 0, female 1; Coefficients for sites and intercept not shown
Unless otherwise indicated coefficients are different from zero at p<0.001
not significant
0.001≤p≤0.05
Leg and arm fat in diabetic and control subjects
Further analyses explored whether the larger amount of trunk fat observed in the diabetes subjects occurred at the expense of peripheral fat in general or whether it was specifically lower extremity fat that was depleted. In general linear regression models leg fat was found to be independently and significantly related to diabetes status, gender, height, total fat mass and race (all p≤0.001) (Table 4). Subjects with diabetes had 1.5 kg (SE 0.16) less leg fat than controls (10.7 vs 12.3 kg; p<0.001). For arm fat, there was a gender by diabetes status interaction: women with type 2 diabetes had more arm fat than controls (4.7 vs 4.3 kg, p<0.001) while men did not differ from controls (4.1 vs 4.1 kg, p=0.99). These results indicate a relative depletion of fat in the legs of subjects with type 2 diabetes that is not seen in the arms and that, in fact, women, although not men with diabetes, have more peripheral arm fat than controls.
Analysis of lean mass found ~0.5 (SE 0.08) kg less leg lean mass in diabetes cases than controls, indicating depletion of lean as well as fat mass compared to controls (18.1 vs 18.6 kg, p<0.001). For lean mass in the arm, subjects with diabetes did not differ from controls (6.5 vs 6.6 kg, p=0.30).
Whole body bone mineral in diabetic and control subjects
For completeness we also report the results of whole body bone mineral content analysis. Regression models of whole body bone mineral content (BMC) found no association of type 2 diabetes with BMC after adjustment for race, gender, height, weight (all p<0.001), age (p=0.03) and clinical site (Table 4). There were no significant interactions among variables.
Discussion
In this study we observed a smaller fat mass (~1.4 kg) in subjects with type 2 diabetes compared to healthy controls after adjustment for weight, height, age, gender, race/ethnicity and clinical site. This fat mass was distributed more centrally, with larger deposits in the trunk region and smaller deposits in the leg region. The arm region had marginally larger amounts of fat in women but did not differ from controls in men. The distribution of lean tissue in type 2 diabetes compared to controls followed a similar pattern to that of fat: more in the trunk region, less in the leg, except that the larger fat mass seen in the arm region of women with diabetes was not matched by more lean tissue in the arm (Figure 2).
Figure 2.
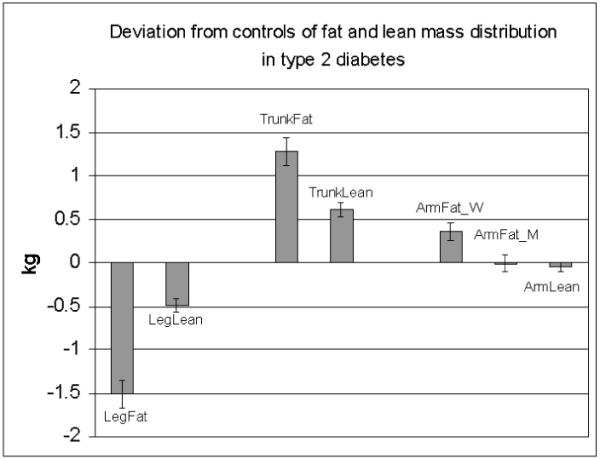
Mean differences between fat and lean masses adjusted for covariates (gender, race, total fat or lean mass, height, age and 2 and 3-way interactions, if any) in leg, trunk and arm regions of type 2 diabetes and control subjects, with control values as the zero reference. ArmFat_W and ArmFat_M is arm fat for women and men, respectively.
Previous studies reported total body fat to be either greater or not different in type 2 diabetes premenopausal women compared to controls (some studies matched for age, others for weight and BMI)(5-7). Studies that report fat as a proportion of total weight often find subjects with type 2 diabetes to have a higher proportion of body weight as fat (8). In contrast, we found that after adjustment by regression for weight, height, race/ethnicity, sex and age, subjects with type 2 diabetes had less total fat mass and more lean mass than controls. Some of the inconsistency in findings may be the result of low power to detect differences, of expressing fat mass as a percent of body weight rather than using weight as a covariate, and possibly also of not adjusting for other relevant variables such as age and height. It may be noted that in each of the within-race comparisons in our sample the fat mass expressed as a percentage of weight was higher in the diabetes subjects than in controls (Tables 1 and 2). There are well-documented hazards in comparing groups using ratio measures such as fat mass divided by body weight (18).
While a difference of 1.4 kg of total fat mass given a mean total fat mass of 30-40 kg is small, the direction of the difference is unexpected in that, other factors being equal, greater fatness is usually positively related to metabolic disturbances (19). It appears that in this sample of diabetes subjects an adverse pattern of fat distribution is more strongly associated with the disease than is the total amount of fat.
The finding of a larger amount of fat in the trunk region in type 2 diabetes (~1.3 kg) compared with controls is consistent with some but not all other studies (6, 9-11). We find that this enlarged truncal adiposity extends across race/ethnicity and sex groupings in our sample. The relative contribution of subcutaneous and intra-abdominal deposits to the differences in truncal fat seen in this study cannot be determined from DXA measures, however, studies using other body composition measures such as CT have investigated the distinct roles of subcutaneous and intra-abdominal compartments of truncal fat and their independent associations with metabolic variables (1,2). Differences in metabolic activity (lipolysis, adipokines) in the subcutaneous and intra-abdominal compartments have been reported but the roles of other, more specific, adipose subcompartments (omental, mesenteric, pelvic, epicardial, deep vs superficial subcutaneous, inter- and intramuscular) remain to be investigated and characterized.
In addition to having more of their fat in the truncal region, subjects with type 2 diabetes had less leg fat (~1.5 kg) and this finding also held across race/ethnicity and sex groups in our sample. A graded difference in amount of leg fat has also been observed in impaired glucose tolerant and diabetic subjects compared to healthy controls (20). Recently, the notion that fat deposits in the femoral/gluteal region may be protective for the development of diabetes and risk for CVD have been advanced with studies showing positive associations of these fat deposits with better glucose metabolism (15) and lower arterial stiffness (16, 21). Although leg fat may be subdivided into subcutaneous, inter-muscular and intra-muscular fat, the subcutaneous deposit, which is the major component, is likely to be responsible for any beneficial associations.
The arm regions of subjects with type 2 diabetes did not have less fat compared to controls suggesting that the fat distribution differences are mainly trunk vs leg rather than central vs peripheral or upper vs lower body. The metabolic significance of a reduced capacity to deposit or conserve leg fat, or an enhanced capacity to store fat centrally in type 2 diabetes remains to be elucidated. It has been proposed that subcutaneous abdominal fat contributes to higher non-esterified fatty acid levels whereas subcutaneous fat on the thigh may act as a metabolic sink for these circulating fatty acids, or that regional differences in the secretion of adipokines and inflammatory/ fibrinolytic proteins may be accounting for the different associations of these fat depots with glucose and lipid levels and with arterial stiffness (16, 21). Future studies might look at whether weight loss in subjects with type 2 diabetes tends to normalize fat distribution towards that of controls.
An interesting, previously unreported observation is that the excess amount of truncal fat in type 2 diabetes compared to controls is mirrored by an excess of lean tissue of about one third the size, and the deficit of fat in the legs has a corresponding deficit of lean tissue, again of about one third or one quarter the size of the fat deviations. These proportions of fat to lean tissue are approximately similar to those reported in studies of weight loss or gain. The significance of these regional excesses and deficits of lean tissue is not known at present. Independent associations of the fat and lean tissues with metabolic variables will be difficult to investigate because of their high collinearity.
There were relatively few statistical interactions in these analyses. One involved women with type 2 diabetes who had significantly more arm fat (0.4 kg) than controls whereas men did not differ. All other interactions were gender by race, reflecting different fat patterns in men than women across race/ethnic groups. Black men had the least and Hispanic men the most total fat, while among women, Hispanics had the least and Whites had the most total fat. The other interaction was on arm lean mass where Hispanic and Black women had more arm lean mass than White women, whereas Hispanic men and White men had smaller lean arm mass than Black men.
The principal strength of our study is the large, multi-ethnic sample of well characterized subjects with type 2 diabetes who were all studied using the same protocol and similar cross-calibrated instrumentation at multiple study sites. This permitted us to carry out powerful statistical tests for differences in fat content and distribution between type 2 diabetes and controls and to determine whether these differences were affected by sex and race/ethnicity. Our study also has certain limitations. The cross-sectional design makes it impossible to examine the time course of the development of the observed differences thus limiting us to speculation on causality. The controls were a convenience sample of non-diabetic subjects from other studies and many measures which would have been useful in analyses (e.g., waist circumference) were not available. Look AHEAD is a clinical trial, and our subjects had a higher BMI, were better educated, and were less likely to smoke than the persons with diabetes in the National Health and Nutrition Examination Surveys. Our analyses may not have been able to adjust completely for confounders such as the larger weight and fat mass in diabetic subjects, different race/ethnicity proportions and sex composition of groups, and for other unknown but correlated factors, thus some of our findings could be due to residual confounding and not to true associations. DXA measures are not able to discriminate many tissue subcompartments which may be important to understanding the observed differences.
Conclusions
In multiple regression models adjusted for weight, height, age, sex and race/ethnicity, we found that subjects with type 2 diabetes had less fat mass and more lean mass than healthy controls. There were also differences in tissue distribution with an excess of fat and lean tissue in the truncal region and a deficit of fat and lean in the leg region in subjects with type 2 diabetes compared to controls. There was no deficit of fat in the arm region. The physiological processes producing these deviations in tissue distribution and their metabolic significance require further investigation.
Acknowledgments
Clinical Sites
The Johns Hopkins Medical Institutions Frederick Brancati, MD, MHS; Debi Celnik, MS, RD, LD; Jeff Honas, MS; Jeanne Clark, MD, MPH; Jeanne Charleston, RN; Lawrence Cheskin, MD; Kerry Stewart, EdD; Richard Rubin, PhD; Kathy Horak, RD
Pennington Biomedical Research Center George A. Bray, MD; Kristi Rau; Allison Strate, RN; Frank L. Greenway, MD; Donna H. Ryan, MD; Donald Williamson, PhD; Elizabeth Tucker; Brandi Armand, LPN; Mandy Shipp, RD; Kim Landry; Jennifer Perault
The University of Alabama at Birmingham Cora E. Lewis, MD, MSPH; Sheikilya Thomas MPH; Vicki DiLillo, PhD; Monika Safford, MD; Stephen Glasser, MD; Clara Smith, MPH; Cathy Roche, RN; Charlotte Bragg, MS, RD, LD; Nita Webb, MA; Staci Gilbert, MPH; Amy Dobelstein; L. Christie Oden; Trena Johnsey
Harvard Center
Massachusetts General Hospital: David M. Nathan, MD; Heather Turgeon, RN; Kristina P. Schumann, BA; Enrico Cagliero, MD; Kathryn Hayward, MD; Linda Delahanty, MS, RD; Barbara Steiner, EdM; Valerie Goldman, MS, RD; Ellen Anderson, MS, RD; Laurie Bissett, MS, RD; Alan McNamara, BS; Richard Ginsburg, PhD; Virginia Harlan, MSW; Theresa Michel, MS
Joslin Diabetes Center: Edward S. Horton, MD; Sharon D. Jackson, MS, RD, CDE; Osama Hamdy, MD, PhD; A. Enrique Caballero, MD; Sarah Ledbury, MEd, RD; Maureen Malloy, BS; Ann Goebel-Fabbri, PhD; Kerry Ovalle, MS, RCEP, CDE; Sarah Bain, BS; Elizabeth Bovaird, BSN,RN; Lori Lambert, MS, RD
Beth Israel Deaconess Medical Center: George Blackburn, MD, PhD; Christos Mantzoros, MD, DSc; Ann McNamara, RN; Heather McCormick, RD
University of Colorado Health Sciences Center James O. Hill, PhD; Marsha Miller, MS, RD; Brent VanDorsten, PhD; Judith Regensteiner, PhD; Robert Schwartz, MD; Richard Hamman, MD, DrPH; Michael McDermott, MD; JoAnn Phillipp, MS; Patrick Reddin, BA; Kristin Wallace, MPH; Paulette Cohrs, RN, BSN; April Hamilton, BS; Salma Benchekroun, BS; Susan Green; Loretta Rome, TRS; Lindsey Munkwitz, BS
Baylor College of Medicine John P. Foreyt, PhD; Rebecca S. Reeves, DrPH, RD; Henry Pownall, PhD; Peter Jones, MD; Ashok Balasubramanyam, MD; Molly Gee, MEd, RD
University of California at Los Angeles School of Medicine Mohammed F. Saad, MD; Ken C. Chiu, MD; Siran Ghazarian, MD; Kati Szamos, RD; Magpuri Perpetua, RD; Michelle Chan, BS; Medhat Botrous
The University of Tennessee Health Science Center Karen C. Johnson, MD, MPH; Abbas E. Kitabchi, PhD, MD; Helen Lambeth, RN, BSN; Leeann Carmichael, RN; Lynne Lichtermann, RN, BSN
University of Minnesota Robert W. Jeffery, PhD; Carolyn Thorson, CCRP; John P. Bantle, MD; J. Bruce Redmon, MD; Richard S. Crow, MD; Jeanne Carls, MEd; Carolyne Campbell; La Donna James; T. Ockenden, RN; Kerrin Brelje, MPH, RD; M. Patricia Snyder, MA, RD; Amy Keranen, MS; Cara Walcheck, BS, RD; Emily Finch, MA; Birgitta I. Rice, MS, RPh, CHES; Vicki A. Maddy, BS, RD; Tricia Skarphol, BS
St. Luke’s Roosevelt Hospital Center Xavier Pi-Sunyer, MD; Jennifer Patricio, MS; Jennifer Mayer, MS; Stanley Heshka, PhD; Carmen Pal, MD; Mary Anne Holowaty, MS, CN; Diane Hirsch, RNC, MS, CDE
University of Pennsylvania Thomas A. Wadden, PhD; Barbara J. Maschak-Carey, MSN, CDE; Gary D. Foster, PhD; Robert I. Berkowitz, MD; Stanley Schwartz, MD; Shiriki K. Kumanyika, PhD, RD, MPH; Monica Mullen, MS, RD; Louise Hesson, MSN; Patricia Lipschutz, MSN; Anthony Fabricatore, PhD; Canice Crerand, PhD; Robert Kuehnel, PhD; Ray Carvajal, MS; Renee Davenport; Helen Chomentowski
University of Pittsburgh David E. Kelley, MD; Jacqueline Wesche -Thobaben, RN,BSN,CDE; Lewis Kuller, MD, DrPH.; Andrea Kriska, PhD; Daniel Edmundowicz, MD; Mary L. Klem, PhD, MLIS; Janet Bonk, RN, MPH; Jennifer Rush, MPH; Rebecca Danchenko, BS; Barb Elnyczky, MA; Karen Vujevich, RN-BC, MSN, CRNP; Janet Krulia, RN,BSN,CDE; Donna Wolf, MS; Juliet Mancino, MS, RD, CDE, LDN; Pat Harper, MS, RD, LDN; Anne Mathews, MS, RD, LDN
Brown University Rena R. Wing, PhD; Vincent Pera, MD; John Jakicic, PhD; Deborah Tate, PhD; Amy Gorin, PhD; Renee Bright, MS; Pamela Coward, MS, RD; Natalie Robinson, MS, RD; Tammy Monk, MS; Kara Gallagher, PhD; Anna Bertorelli, MBA, RD; Maureen Daly, RN; Tatum Charron, BS; Rob Nicholson, PhD; Erin Patterson, BS; Julie Currin, MD; Linda Foss, MPH; Deborah Robles; Barbara Bancroft, RN, MS; Jennifer Gauvin, BS; Deborah Maier, MS; Caitlin Egan, MS; Suzanne Phelan, PhD; Hollie Raynor, PhD, RD; Don Kieffer, PhD; Douglas Raynor, PhD; Lauren Lessard, BS; Kimberley Chula-Maguire, MS; Erica Ferguson, BS, RD; Richard Carey, BS; Jane Tavares, BS; Heather Chenot, MS; JP Massaro, BS
The University of Texas Health Science Center at San Antonio Steve Haffner, MD; Maria Montez, RN, MSHP, CDE; Connie Mobley, PhD, RD; Carlos Lorenzo, MD
University of Washington / VA Puget Sound Health Care System Steven E. Kahn, MB, ChB; Brenda Montgomery, MS, RN, CDE; Robert H. Knopp, MD; Edward W. Lipkin, MD, PhD; Matthew L. Maciejewski, PhD; Dace L. Trence, MD; Roque M. Murillo, BS; S. Terry Barrett, BS
Southwestern American Indian Center, Phoenix, Arizona and Shiprock, New Mexico William C. Knowler, MD, DrPH; Paula Bolin, RN, MC; Tina Killean, BS; Carol Percy, RN; Rita Donaldson, BSN; Bernadette Todacheenie, EdD; Justin Glass, MD; Sarah Michaels, MD; Jonathan Krakoff, MD; Jeffrey Curtis, MD, MPH; Peter H. Bennett, MB, FRCP; Tina Morgan; Ruby Johnson; Cathy Manus; Janelia Smiley; Sandra Sangster; Shandiin Begay, MPH; Minnie Roanhorse; Didas Fallis, RN; Nancy Scurlock, MSN, ANP; Leigh Shovestull, RD
Coordinating Center
Wake Forest University School of Medicine Mark A. Espeland, PhD; Judy Bahnson, BA; Lynne Wagenknecht, DrPH; David Reboussin, PhD; W. Jack Rejeski, PhD; Wei Lang, PhD; Alain Bertoni, MD, MPH; Mara Vitolins, DrPH; Gary Miller, PhD; Paul Ribisl, PhD; Kathy Dotson, BA; Amelia Hodges, BA; Patricia Hogan, MS; Kathy Lane, BS; Carrie Combs, BS; Christian Speas, BS; Delia S. West, PhD; William Herman, MD, MPH
Central Resources Centers
DXA Reading Center, University of California at San Francisco Michael Nevitt, PhD; Ann Schwartz, PhD; John Shepherd, PhD; Jason Maeda, MPH; Cynthia Hayashi; Michaela Rahorst; Lisa Palermo, MS, MA
Central Laboratory, Northwest Lipid Research Laboratories Santica M. Marcovina, PhD, ScD; Greg Strylewicz, MS
ECG Reading Center, EPICARE, Wake Forest University School of Medicine
Ronald J. Prineas, MD, PhD; Zhu-Ming Zhang, MD; Charles Campbell, AAS, BS; Sharon Hall
Diet Assessment Center, University of South Carolina, Arnold School of Public Health, Center for Research in Nutrition and Health Disparities Elizabeth J Mayer-Davis, PhD; Cecilia Farach, DrPH
Federal Sponsors
National Institute of Diabetes and Digestive and Kidney Diseases: Barbara Harrison, MS; Susan Z.Yanovski, MD; Van S. Hubbard, MD PhD
National Heart, Lung, and Blood Institute: Lawton S. Cooper, MD, MPH; Eva Obarzanek, PhD, MPH, RD; Denise Simons-Morton, MD, PhD
Centers for Disease Control and Prevention: David F. Williamson, PhD; Edward W. Gregg, PhD
Funding and Support
This study is supported by the Department of Health and Human Services through the following cooperative agreements from the National Institutes of Health: DK57136, DK57149, DK56990, DK57177, DK57171, DK57151, DK57182, DK57131, DK57002, DK57078, DK57154, DK57178, DK57219, DK57008, DK57135, and DK56992. The following federal agencies have contributed support: National Institute of Diabetes and Digestive and Kidney Diseases; National Heart, Lung, and Blood Institute; National Institute of Nursing Research; National Center on Minority Health and Health Disparities; Office of Research on Women’s Health; and the Centers for Disease Control and Prevention. This research was supported in part by the Intramural Research Program of the National Institute of Diabetes and Digestive and Kidney Diseases.
Additional support was received from The Johns Hopkins Medical Institutions Bayview General Clinical Research Center (M01-RR-02719); the Massachusetts General Hospital Mallinckrodt General Clinical Research Center (M01-RR-01066); the University of Colorado Health Sciences Center General Clinical Research Center (M01 RR00051) and Clinical Nutrition Research Unit (P30 DK48520); the University of Tennessee at Memphis General Clinical Research Center (M01RR00211-40); the University of Pittsburgh General Clinical Research Center (M01 RR000056 44) and NIH grant (DK 046204); and the University of Washington / VA Puget Sound Health Care System Medical Research Service, Department of Veterans Affairs.
The following organizations have committed to make major contributions to Look AHEAD: Federal Express; Health Management Resources; Johnson & Johnson, LifeScan Inc.; Optifast-Novartis Nutrition; Roche Pharmaceuticals; Ross Product Division of Abbott Laboratories; and Slim-Fast Foods Company.
References
- 1.Cnop M, Landchild MJ, Vidal J, Havel PJ, Knowles NG, Carr DR, Wang F, Hull RL, Boyko EJ, Retzlaff BM, Walden CE, Knopp RH, Kahn SE. The concurrent accumulation of intra-abdominal and subcutaneous fat explains the association between insulin resistance and plasma leptin concentrations : distinct metabolic effects of two fat compartments. Diabetes. 2002;51:1005–15. doi: 10.2337/diabetes.51.4.1005. [DOI] [PubMed] [Google Scholar]
- 2.Wagenknecht LE, Langefeld CD, Scherzinger AL, Norris JM, Haffner SM, Saad MF, Bergman RN. Insulin sensitivity, insulin secretion, and abdominal fat: the Insulin Resistance Atherosclerosis Study (IRAS) Family Study. Diabetes. 2003;52:2490–6. doi: 10.2337/diabetes.52.10.2490. [DOI] [PubMed] [Google Scholar]
- 3.Utzschneider KM, Carr DB, Hull RL, Kodama K, Shofer JB, Retzlaff BM, Knopp RH, Kahn SE. Impact of intra-abdominal fat and age on insulin sensitivity and beta-cell function. Diabetes. 2004;53:2867–72. doi: 10.2337/diabetes.53.11.2867. [DOI] [PubMed] [Google Scholar]
- 4.Kuk JL, Katzmarzyk PT, Nichaman MZ, Church TS, Blair SN, Ross R. Visceral fat is an independent predictor of all-cause mortality in men. Obesity. 2006;14:336–41. doi: 10.1038/oby.2006.43. [DOI] [PubMed] [Google Scholar]
- 5.Svendsen OL, Hassager C. Body composition and fat distribution measured by dual-energy x-ray absorptiometry in premenopausal and postmenopausal insulin-dependent and non-insulin-dependent diabetes mellitus patients. Metabolism. 1998;47:212–216. doi: 10.1016/s0026-0495(98)90223-2. [DOI] [PubMed] [Google Scholar]
- 6.Maiolo C, Mohamed EI, Di DN, Pepe M, Perriello G, De LA. Body composition and pulmonary function in obese type 2 diabetic women. Diabetes Nutr Metab. 2002;15:20–25. [PubMed] [Google Scholar]
- 7.Poynten AM, Markovic TP, Maclean EL, Furler SM, Freund J, Chisholm DJ, Campbell LV. Fat oxidation, body composition and insulin sensitivity in diabetic and normoglycaemic obese adults 5 years after weight loss. Int J Obes. 2003;27:1212–1218. doi: 10.1038/sj.ijo.0802393. [DOI] [PubMed] [Google Scholar]
- 8.Goodpaster BH, Krishnaswami S, Resnick H, Kelley DE, Haggerty C, Harris TB, Schwartz AV, Kritchevsky S, Newman AB. Association between regional adipose tissue distribution and both type 2 diabetes and impaired glucose tolerance in elderly men and women. Diabetes Care. 2003;26:372–9. doi: 10.2337/diacare.26.2.372. [DOI] [PubMed] [Google Scholar]
- 9.Bavenholm PN, Kuhl J, Pigon J, Saha AK, Ruderman NB, Efendic S. Insulin resistance in type 2 diabetes: association with truncal obesity, impaired fitness, and atypical malonyl coenzyme A regulation. J Clin Endocrinol Metab. 2003;88:82–7. doi: 10.1210/jc.2002-020330. [DOI] [PubMed] [Google Scholar]
- 10.Stoney RM, Ireland PD, Walker KZ, Giles GG, Best JD, O’Dea K. Do postmenopausal women with NIDDM have a reduced capacity to deposit and conserve lower-body fat? Diabetes Care. 1998;21:828–830. doi: 10.2337/diacare.21.5.828. [DOI] [PubMed] [Google Scholar]
- 11.Tafeit E, Möller R, Peiber TR, Sudi K, Reibnegger G. Differences of subcutaneous adipose tissue topography in type-2 diabetic (NIDDM) women and healthy controls. Am J Phys Anthrop. 2000;113:381–388. doi: 10.1002/1096-8644(200011)113:3<381::AID-AJPA8>3.0.CO;2-T. [DOI] [PubMed] [Google Scholar]
- 12.Terry RB, Stefanick ML, Haskell WL, Wood PD. Contributions of regional adipose tissue depots to plasma lipoprotein concentrations in overweight men and women: possible protective effects of thigh fat. Metabolism. 1991;40:733–40. doi: 10.1016/0026-0495(91)90093-c. [DOI] [PubMed] [Google Scholar]
- 13.Kahn HS, Austin H, Williamson DF, Arensberg D. Simple anthropometric indices associated with ischemic heart disease. J Clin Epidemiol. 1996;49:1017–24. doi: 10.1016/0895-4356(96)00113-8. [DOI] [PubMed] [Google Scholar]
- 14.Williams MJ, Hunter GR, Kekes-Szabo T, Snyder S, Treuth MS. Regional fat distribution in women and risk of cardiovascular disease. Am J Clin Nutr. 1997;65:855–60. doi: 10.1093/ajcn/65.3.855. [DOI] [PubMed] [Google Scholar]
- 15.Snijder MB, Dekker JM, Visser M, Bouter LM, Stehouwer CD, Yudkin JS, Heine RJ, Nijpels G, Seidell JC, Hoorn study Trunk fat and leg fat have independent and opposite associations with fasting and postload glucose levels: the Hoorn study. Diabetes Care. 2004;27:372–7. doi: 10.2337/diacare.27.2.372. [DOI] [PubMed] [Google Scholar]
- 16.Snijder MB, Henry RM, Visser M, Dekker JM, Seidell JC, Ferreira I, Bouter LM, Yudkin JS, Westerhof N, Stehouwer CD. Regional body composition as a determinant of arterial stiffness in the elderly: The Hoorn Study. J Hypertens. 2004;22:2339–47. doi: 10.1097/00004872-200412000-00016. [DOI] [PubMed] [Google Scholar]
- 17.Ryan DH, Espeland MA, Foster GD, Haffner SM, Hubbard VS, Johnson KC, Kahn SE, Knowler WC, Yanovski SZ, Look AHEAD Research Group Look AHEAD (Action for Health in Diabetes): design and methods for a clinical trial of weight loss for the prevention of cardiovascular disease in type 2 diabetes. Controlled Clinical Trials. 2003;24:610–28. doi: 10.1016/s0197-2456(03)00064-3. [DOI] [PubMed] [Google Scholar]
- 18.Kronmal RA. Spurious correlation and the fallacy of the ratio standard revisited. J.R. Statist Soc A. 1993;156:379–392. [Google Scholar]
- 19.Zhu S, Wang Z, Shen W, Heymsfield SB, Heshka S. Percentage body fat ranges associated with metabolic syndrome risk: results based on the third National Health and Nutrition Examination Survey (1988-1994) Am J Clin Nutr. 2003;78:228–35. doi: 10.1093/ajcn/78.2.228. [DOI] [PubMed] [Google Scholar]
- 20.Chang CJ, Wu CH, Lu FH, Wu JS, Chiu NT, Yao WJ. Discriminating glucose tolerance status by regions of interest of dual-energy x-ray absorptiometry. Clinical implications of body fat distribution. Diabetes Care. 1999;22:1938–1943. doi: 10.2337/diacare.22.12.1938. [DOI] [PubMed] [Google Scholar]
- 21.Ferreira I, Snijder MB, Twisk JW, van Mechelen W, Kemper HC, Seidell JC, Stehouwer CD. Central fat mass versus peripheral fat and lean mass: opposite (adverse versus favorable) associations with arterial stiffness? The Amsterdam Growth and Health Longitudinal Study. J Clin Endocrinol Metab. 2004;89:2632–9. doi: 10.1210/jc.2003-031619. [DOI] [PubMed] [Google Scholar]