
Fig. 6.
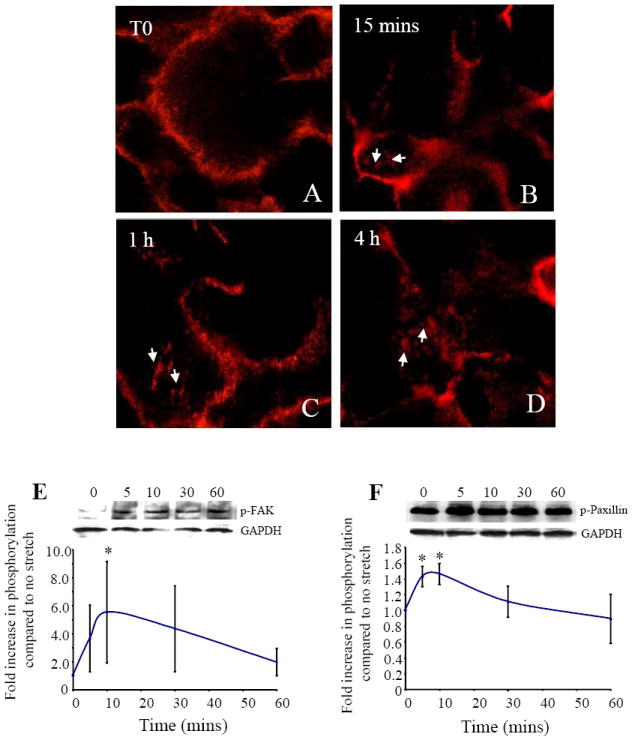
Integrins were activated in AEC by the cyclic stretch/release stimulus, shown by immunofluorescent localization of integrin β1 subunit (A-D). Clustering on the basal surface of the AEC (white arrows) can be seen after 15 mins of stimulation, maintained at both 1 h and 4 h of continued cyclic stretch/release. (E) Western blot of p-FAK with AEC lysates during 1 h of cyclic stretch/release, with GAPDH as control and quantitation (n=4) cells from different patients shown below. (F) Western blot of p-Paxillin of the same cell lysates shown during 1 h of cyclic stretch/release, with GAPDH as control and quantitation (n=4) shown below. Values are mean +/-SEM. *p<0.05 compared to no stretch control.