Abstract
Summary
This study aims at investigating the effects of age, sex, and ethnicity on five femoral neck geometric parameters (FNGPs): femoral neck periosteal diameter, cross-sectional area, cortical thickness, sectional modulus, and buckling ratio and found that the three factors would influence the FNGPs.
Introduction
Bone geometry is one of the most important predictors of bone strength and osteoporotic fractures. This study aims at investigating the effects of age, sex, and ethnicity on five femoral neck geometric parameters (FNGPs): femoral neck periosteal diameter (W), cross-sectional area (CSA), cortical thickness (CT), sectional modulus (Z), and buckling ratio (BR).
Methods
In the studied 861 Caucasian subjects and 3,021 Chinese individuals, CSA, CT, and Z displayed trends of decrease with age, but W and BR showed increasing trends with age in both Chinese and Caucasian females and males (p < 0.05). W, CSA, CT, and Z were significantly higher (p ≤ 0.001) in Caucasians than in Chinese and higher in males than in females except for BR between Chinese males and Chinese females.
Conclusion
In conclusion, the differences of FNGPs according to gender and ethnicity provide important implications in the different prevalence of osteoporotic fracture among different gender and ethnic groups.
Keywords: Age, Femoral neck geometric parameters, Race, Sex
Introduction
Osteoporosis is a systematic bone disease characterized by low bone strength, leading to increasing susceptibility to bone fracture. Hip fracture is the most serious osteoporotic fracture (OF). Bone mineral density (BMD) is widely used in estimating bone strength and predicting OF [1–4]. Other bone structural phenotypes, such as femoral neck geometric parameters (FNGPs), may also be important determinants of bone strength [5]. Patients with hip fracture had lower cross-sectional area (CSA), sectional modulus (Z), cortical thickness (CT), and higher buckling ratio (BR) than health controls [6].
The prevalence of hip fracture is different in groups classified by gender or ethnicity [7–10]. Most of studies reported higher rates of hip fracture in women than in men [11–13]. And comparing race, numerous previous studies have constantly reported that the age-adjusted annual rates of hip fracture were lower in Asians than Caucasians [12–15]. The different bone strength may be the leading factor responsible for the differences in prevalence of hip fracture in groups according to gender or ethnicity. However, currently, it is largely unknown if there are differences of bone parameters of hip in such groups, which may result in differences of bone strength.
Materials and methods
Subjects
A. The Chinese sample
The study on Chinese samples was approved by the necessary Institutional Review Board in China. The subjects were collected in Changsha, Xi’an, and Shanghai. A total of 3,021 unrelated subjects aged 19–80 years, who belong to the Chinese Han ethnic group, were recruited. After the subjects signed the informed consent document, a questionnaire was given to obtain the subject’s information on age, sex, medical history, family history, female history, physical activity, alcohol use, dietary habits, and smoking history under direction of clinician. We adopted the exclusion criteria detailed elsewhere [16] to screen and recruit “healthy” subjects. To be specific, individuals with history of diseases or therapies, such as rheumatoid arthritis or collagen disease, chronic renal disease, recent major gastrointestinal disease (within the past year), such as peptic ulcer, malabsorption, or treatment with anticonvulsant therapy for 6 months duration, which might probably influence bone mass, structure, or metabolism, have been excluded from our study.
B. The Caucasian sample
The study on Caucasian samples was approved by the Creighton University Institutional Review Board. Signed informed consent documents were obtained from all study participants before they entered the study. People with chronic diseases and conditions that might potentially affect bone mass, structure, or metabolism were excluded as detailed before [16]. The sample contains a total of 861 unrelated Caucasian subjects aged from 19 to 80 years which were selected from our previous data including 4,498 individuals from 451 pedigrees. All the Caucasian subjects were of European origin. The basic characteristics of both the Chinese and Caucasian subjects were listed in Table 1.
Table 1.
Basic characteristics of the studied samples
| Caucasians |
Chinese |
|||
|---|---|---|---|---|
| Male (n = 417) | Female (n = 445) | Male (n = 1544) | Female (n = 1477) | |
| Age (years) | 45.49 (16.63) | 47.74 (16.38) | 36.61 (16.08) | 38.37 (14.90) |
| Height (m) | 1.78 (0.07) | 1.64 (0.06) | 1.69 (0.06) | 1.57 (0.07) |
| Weight (kg) | 88.98 (14.70) | 72.55 (16.73) | 64.45 (9.60) | 54.25 (8.37) |
| FN BMD (g/cm2) | 0.87 (0.15) | 0.79 (0.14) | 0.81 (0.12) | 0.78 (0.14) |
| Bone size (cm2) | 5.92 (0.53) | 5.04 (0.39) | 5.20 (0.46) | 4.72 (0.45) |
The data were expressed as Mean (SD)
Individuals without genetic relationships are considered unrelated and selected for the present study. For example, if an individual was selected, his/her children, cousins, siblings, parents, parents’ siblings, and parents’ siblings’ children were not chosen, but the person who married the one in the pedigree was selected. In this way, 861 individuals have been picked out for our study. In order to keep the similar age range in both Caucasian and Chinese, all the 861 samples are aged between 19 and 80.
Measurements
The areal BMD (g/cm2) and bone size (cm2) at the femoral neck (FN) of all the subjects were measured by Hologic 2000+ or 4500 DXA scanners (Hologic, Bedford, MA, USA). All scanners are calibrated daily, and long-term precision is monitored with external phantoms. The coefficient of variations (CVs) of FN BMD and bone size measurement obtained on Hologic 2000+ were 1.87% and 1.94% [17–19] in our USA center and 0.8% and 1.18% in our Chinese center. Similar CVs were obtained on Hologic 4500 scanner [19]. Data obtained from different machines are transformed to a compatible measurement by an algorithm as in our previous studies [20]. What is more, technicians maintain scan-by-scan surveillance for quality control in both America and China [21], and each of them was trained and got an International Society for Clinical Densitometry certification. Therefore, BMD and bone size measurements by different scanners and technicians in our center are highly compatible with one another and are well within the precision limits [19].
The FNGPs were estimated using the FN BMD and bone size following the methods detailed well earlier [22–24]. The five estimated FNGPs are: (1) W, femoral neck periosteal diameter; (2) CSA, the area with mineralized bone tissue, excluded bone marrow space; (3) Z, an index of bending resistance; (4) CT, cortical thickness; and (5) BR, an index of bone geometric instability [14]. FNGPs were computed as follows: , where ρm is the effective density of fully mineralized bone tissue, which is assumed to be 1.05 g/cm2 [25, 26], and W, the femoral neck periosteal diameter, can be estimated by dividing the bone size by the width of the region of interest (in Hologic DXA systems, the width of the femoral neck region is standardized at 1.5 cm) [24]. , where ED is the estimated endosteal diameter. , where fc is the assumed proportion of cortical mass in the femoral neck, taken as 0.6. , where CSMI is the cross-sectional moment inertia. , pt is the trabecular porosity, which is calculated by the following formula:
Statistics analysis
The data were normally distributed. Independent-samples t tests were used to analyze the effects of race (Chinese vs. Caucasians) and sex (women vs. men) on each FNGP. Each FNGP except for BR was adjusted for age, height, and weight. The trends to change with age for each FNGP were estimated by linear regression methods, designating age as the independent variable and the FNGPs as the dependent variables, adjusted for weight and height. R squares for each covariate and overall R squares showing the proportion of FNGP variation explained by age, height, and weight and all three factors through regression analysis are listed in Table 2.
Table 2.
R squares for adjusted covariates and overall R squares
| Covariates FNGPs | Height | Weight | Age | Overall R squares |
|---|---|---|---|---|
| W | 0.15 | 0.10 | 0.04 | 0.41 |
| CSA | 0.10 | 0.10 | 0.06 | 0.52 |
| Z | 0.13 | 0.08 | 0.03 | 0.54 |
| CT | 0.03 | 0.10 | 0.12 | 0.37 |
BR has not been adjusted
The level of statistical significance was originally set at p = 0.05. However, the problem of multiple tests has arisen owning to 20 times of t tests and regression. Therefore, we have adopted the most conservative method addressing the multiple test problem—Bonferroni. As a result, the cutoff of significance was set at p = 0.05/20 = 0.0025. The SPSS software was used to perform all the statistical analyses.
Results
As shown in Table 3, compared to Caucasian, Chinese had significantly smaller W (p < 0.001 in both males and females), smaller CSA (p < 0.001 in both males and females), lower Z (p < 0.001 in both males and females), thinner CT (p = 0.001 in males; p < 0.001 in females), and lower BR (p ≤ 0.001 in both males and females). In the same ethnic group, the males have significantly higher (p ≤ 0.0025) values of FNGPs than females with an exception for BR in Chinese.
Table 3.
Comparisons of femoral neck geometric parameters in studied groups classified by gender and ethnicity
| Males |
Females |
p values |
||||||
|---|---|---|---|---|---|---|---|---|
| Caucasians (n = 416) | Chinese (n = 1544) | Caucasians (n = 445) | Chinese (n = 1477) | Caucasians vs. Chinese |
Females vs. males |
|||
| Males | Females | Caucasians | Chinese | |||||
| W | 3.79 (0.19) | 3.45 (0.15) | 3.43 (0.17) | 3.19 (0.17) | <0.001 | <0.001 | <0.001 | <0.001 |
| CSA | 3.27 (0.36) | 2.73 (0.28) | 2.64 (0.37) | 2.28 (0.26) | <0.001 | <0.001 | <0.001 | <0.001 |
| Z | 2.28 (0.32) | 1.67 (0.25) | 1.57 (0.33) | 1.20 (0.23) | <0.001 | <0.001 | <0.001 | <0.001 |
| CT | 0.17 (0.02) | 0.16 (0.01) | 0.15 (0.02) | 0.15 (0.01) | <0.001 | 0.001 | <0.001 | <0.001 |
| BR | 12.19 (2.42) | 11.13 (2.21) | 11.55 (2.61) | 11.13 (2.33) | <0.001 | 0.002 | <0.001 | 0.21 |
The data were expressed as Mean (SD); independent-samples t tests were used to analyze the effect of race (Chinese vs. Caucasians) and sex (women vs. men)
W femoral neck periosteal diameter, CSA femoral cross-sectional area, Z section modulus, CT cortical thickness, BR buckling ratio
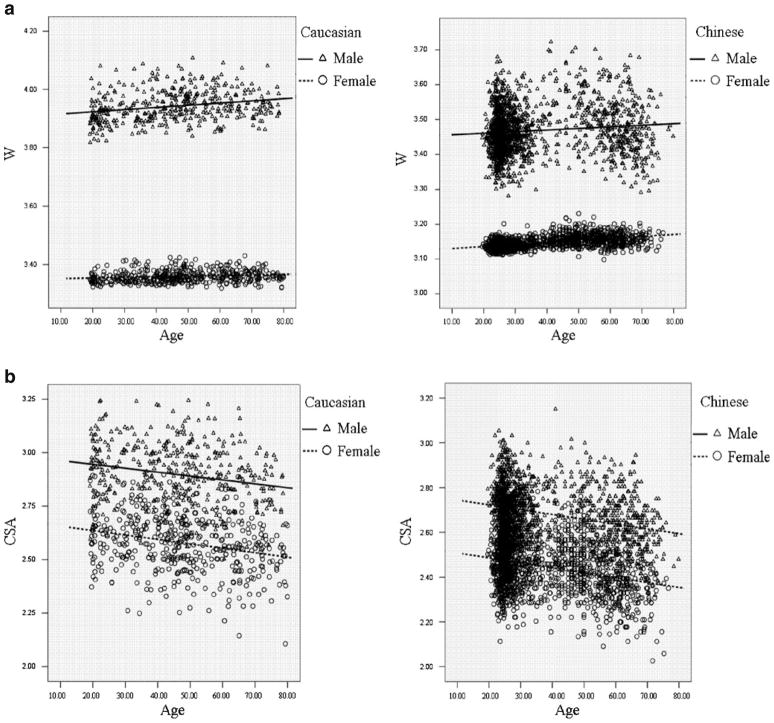
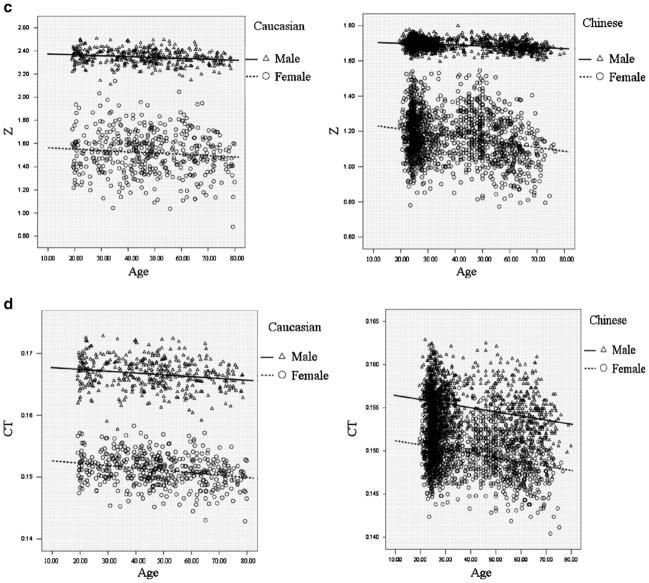
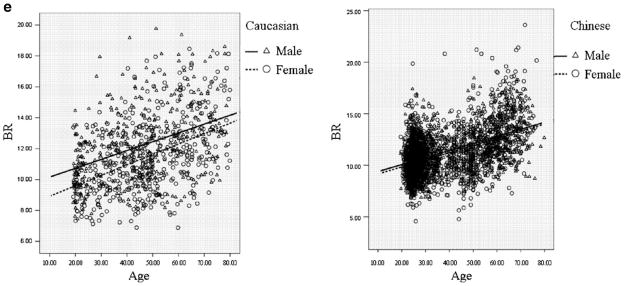
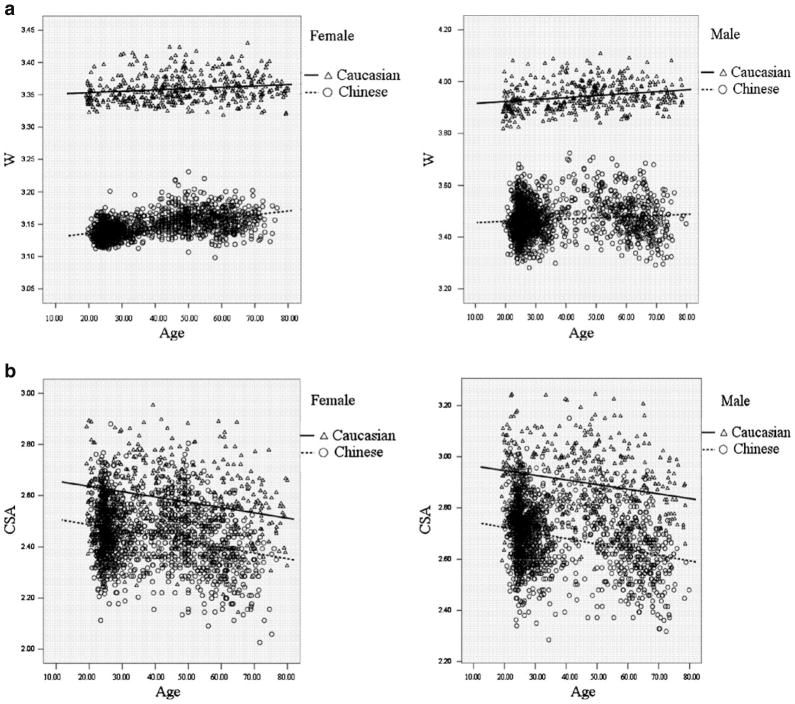
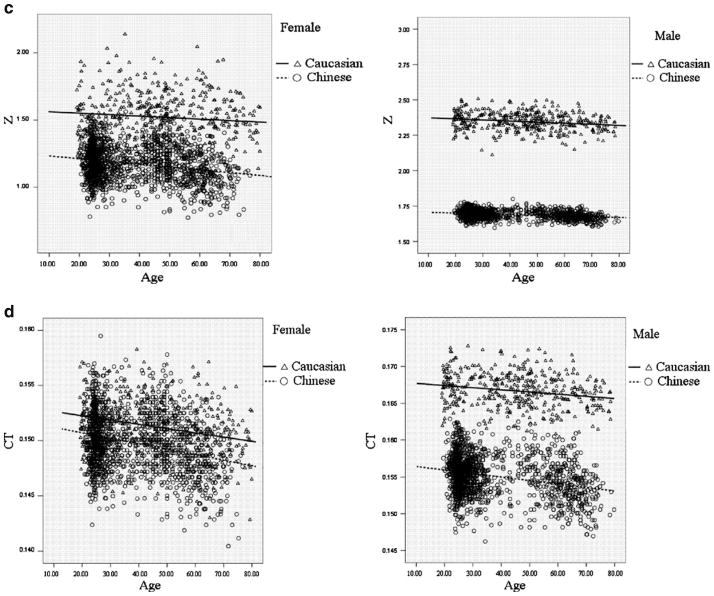
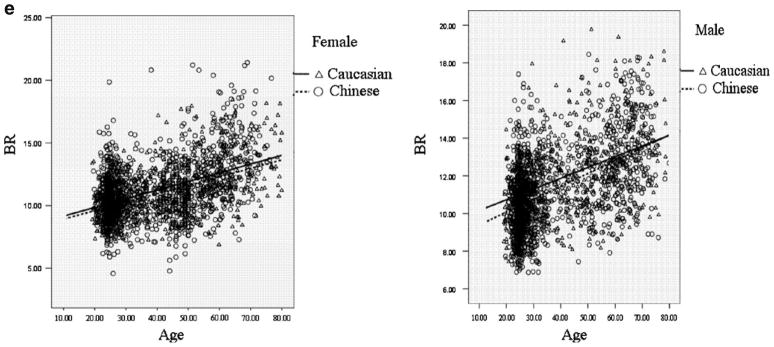
Figure 1 intuitively showed the distribution of FNGPs against age in both ethnic groups. CSA, CT, and Z decreases with age in both males and females (Fig. 1b–d), while W and BR showed increasing trends with age (Fig. 1a, e). In the same gender group (Fig. 2), all the studied FNGPs were significantly associated with age (p ≤ 0.001) in both Caucasian and Chinese except for Z in Caucasian females, which was significant at 0.05 level but not significant at the strictest level 0.0025, with increasing trends for W and BR (Fig. 2a, e) and with decrease trends for CSA, Z, and CT (Fig. 2b–d).
Fig. 1.
The distributions of FNGPs against age in both Caucasian and Chinese (black lines for males; broken lines for females). a Males vs. females, in Caucasian: p < 0.001, slope = 0.00076 vs. p = 0.001, slope = 0.00021; in Chinese: p < 0.001, slope = 0.00045 vs. p < 0.001, slope = 0.00057. b Males vs. females, in Caucasian: p < 0.001, slope = −0.0018 vs. p < 0.001, slope = −0.0021 in Chinese: p < 0.001, slope = −0.0021 vs. p < 0.001, slope = −0.0022. c Males vs. females: in Caucasian: p < 0.001, slope = −0.00077 vs. p = 0.04, slope = −0.0011 in Chinese: p < 0.001, slope = −0.00051 vs. p < 0.001, slope = −0.0021. d Males vs. females: in Caucasian: p < 0.001, slope = −0.000029 vs. p < 0.001, slope = −0.000039 in Chinese: p < 0.001, slope = −0.000048 vs. p < 0.001, slope = −0.000049. e Males vs. females: in Caucasian: p < 0.001, slope = 0.057 vs. p < 0.001, slope = 0.067 in Chinese: p < 0.001, slope = 0.068 vs. p < 0.001, slope = 0.069
Fig. 2.
The distributions of FNGPs against age in both gender group (black lines for Caucasian; broken lines for Chinese). a Caucasian vs. Chinese: in females: p = 0.001, slope = 0.00021 vs. p < 0.001, slope = 0.0057 in males: p < 0.001, slope = 0.0076 vs. p < 0.001, slope = 0.00045. b Caucasian vs. Chinese: in females: p < 0.001, slope = 0.0021 vs. p < 0.001, slope = −0.0022 in males: p < 0.001, slope = −0.0018 vs. p < 0.001, slope = −0.0021. c Caucasian vs. Chinese: in females: p = 0.04, slope = −0.0011 vs. p < 0.001, slope = −0.0021 in males: p < 0.001, slope = −0.00077 vs. p < 0.001, slope = −0.00051. d Caucasian vs. Chinese: in females: p < 0.001, slope = −0.000039 vs. p < 0.001, slope = −0.000049 in males: p < 0.001, slope = −0.000029 vs. p < 0.001, slope = −0.000048. e Caucasian vs. Chinese: in females: p < 0.001, slope = 0.067 vs. p < 0.001, slope = 0.069 in males: p < 0.001, slope = 0.057 vs. p < 0.001, slope = 0.068
Discussion
The present results represented our first efforts to investigate the differences of FNGPs in the studied groups stratified by gender and ethnicity, and the change of FNGPs against age and all the three factors have been shown to influence values of the parameters.
Compared with Caucasians, Chinese had smaller cross-sectional areas, periosteal diameter, sectional modulus, and thinner cortex, implying that the mechanical strength and resistance to bending and torsional stresses is smaller in Chinese than in Caucasian. Predicted only by the results of smaller and weaker FNs, hip fracture rates would be inferred to be higher in Chinese than in Caucasian. However, in fact, numerous studies showed that hip fracture rates were lower in Asians than Caucasians [11–13, 15, 27]. The seeming controversy between smaller and weaker FN but lower fracture rate of hip shows that except for bone geometric parameters, other risk factors such as hip axis length, femoral neck axis length [8, 28], or ratio of leg length to trunk length [8, 27] may explain less fractures occurring in Asians.
Our study also found a significant effect of age on FNGPs. CSA, CT, and Z decreased, while BR and W increased with aging. Thinning cortices and narrowing CSA with aging contribute to smaller mechanical strength and lower bending stresses along the cortical surfaces of bone. Thinning cortices may result from more endocortical bone resorption than periosteal bone apposition with aging [10]. Decline in sectional modulus, which best define resistance to bending and torsional stresses, and increment in BR which defined resistance to bending and hip bone geometric stability, revealed that bone becomes weaker and more inclined to fracture with aging.
The femoral neck structure was deteriorated with age as shown in our study and previous studies [9, 29–31]. The deterioration as well as the gradual drop in mechanical strength would be partly compensated by expansion of the neck through widening the outer diameter (W). Nevertheless, these compensatory mechanisms could only be partly effective, and bone strength finally deteriorates, as indicated by falling section modulus [32] and other FNGPs such as cross-sectional area, cortical thickness, and buckling ratio.
The deterioration may partly be caused by estrogen deficiency [33–37]. Estrogen deficiency produces increased osteoclast formation and recruitment to bone surfaces, combined with the increased osteoblast apoptosis [38–40], which results in enlarged resorption area, perforated trabecular plate and loose trabecular connectivity in cancellous bone, and subendocortical cavitation in cortical bone [41, 42], therefore degrading bone quality. Besides sex hormones, loss of muscle mass with aging, the principal cause of involutional osteoporosis [10, 43], abnormalities in the vitamin D-endocrine and growth hormone-insulin-like growth factor-I regulatory systems [44] are other important causes of bone loss giving rise to deterioration of FN structure.
The structure changes increased fracture risk in both races. However, racial difference in the speed of the changes of the FNGPs has also been seen in our study, indicating that bone quality of Chinese individuals deteriorated at a comparatively faster speed. The similar trend has been reported by studies on BMD before: the age-related decline in femoral neck aBMD seems to be faster in Asians than in Caucasians [45, 46]. Perhaps this phenomenon can be ascribed to earlier menopause in Chinese than in Caucasians, giving rising to better maintenance of estrogen in Caucasians which is the significantly important hormone in determining bone quality. But the true mechanism deserves more researches in the future. The speed of age-related changes in the FNGPs also differs by genders, implying faster speed of deterioration of bone structure in females. The earlier onset age of puberty and the great drop in estrogen after menopause in females may explained the lower values (with an exception for BR between Chinese males and females) and faster age-related deterioration of the FNGPs in females than in males [47, 48]. And the different values and age-related changes of the FNGPs between females and males partly explained the higher hip fracture incidence observed in females [25, 29, 32].
Our study has some limitations. Firstly, different fat distribution around the hip could affect the DXA measurements of the proximal femur and thus the FNGPs. Secondly, the FNGPs were not three-dimensional data since they were calculated using two-dimensional DXA data assuming that the femoral neck is a circular structure and the cortical shell has an even thickness in the entire rim. Two-dimensional data are subject to errors in modeling three dimensions. However, this method is more readily available to researchers and less costly than three-dimensional techniques (e.g., quantitative computed tomography). Thirdly, the number of Chinese, especially males, aged between 40 and 50, is limited, making the age frequency of the two ethic cohorts, to some extent, differ.
In conclusion, our study firstly reported that there were differences in FNGPs between two main ethnic groups (Caucasians vs. Chinese), and between two genders (males vs. females). Furthermore, the deterioration of bone structure is associated with age. The differences of FNGPs according to gender and ethnicity may partly explain the different prevalence of osteoporotic fracture among different gender and ethnic groups.
Acknowledgments
The study was partially supported by Natural Science Foundation of China (NSFC) (30600364), NSFC-Canadian Institutes of Health Research (CIHR) Joint Health Research Initiative Proposal (30811120436), and NSFC/RGC Joint Research Scheme. HWD was partially supported by grants from NIH (R01 AR050496, R21 AG 027110, R01 AG026564, R21 AA015973 and P50 AR055081). We also thank Fang Yang, Zihui Tang, Xiangli Wang, and Ding Ye for their kind suggestions and help.
Footnotes
Conflicts of interest None.
Contributor Information
F. Zhang, Laboratory of Molecular and Statistical Genetics, College of Life Sciences, Hunan Normal University, Changsha, Hunan 410081, People’s Republic of China
L.-J. Tan, Laboratory of Molecular and Statistical Genetics, College of Life Sciences, Hunan Normal University, Changsha, Hunan 410081, People’s Republic of China
S.-F. Lei, Laboratory of Molecular and Statistical Genetics, College of Life Sciences, Hunan Normal University, Changsha, Hunan 410081, People’s Republic of China. Departments of Orthopedic Surgery and Basic Medical Sciences, University of Missouri-Kansas City, 2411 Holmes St., Room M3-C03, Kansas City, MO 64108-2792, USA
H.-W. Deng, Email: dengh@umkc.edu, Laboratory of Molecular and Statistical Genetics, College of Life Sciences, Hunan Normal University, Changsha, Hunan 410081, People’s Republic of China. Center of Systematic Biomedical Research, Shanghai University of Science and Technology, Shanghai, China. Departments of Orthopedic Surgery and Basic Medical Sciences, University of Missouri-Kansas City, 2411 Holmes St., Room M3-C03, Kansas City, MO 64108-2792, USA
References
- 1.Melton LJ, III, Atkinson EJ, O’Fallon WM, Wahner HW, Riggs BL. Long-term fracture prediction by bone mineral assessed at different skeletal sites. J Bone Miner Res. 1993;8:1227–1233. doi: 10.1002/jbmr.5650081010. [DOI] [PubMed] [Google Scholar]
- 2.De Laet CE, Van Hout BA, Burger H, Weel AE, Hofman A, Pols HA. Hip fracture prediction in elderly men and women: validation in the Rotterdam study. J Bone Miner Res. 1998;13:1587–1593. doi: 10.1359/jbmr.1998.13.10.1587. [DOI] [PubMed] [Google Scholar]
- 3.Faulkner KG, Cummings SR, Black D, Palermo L, Gluer CC, Genant HK. Simple measurement of femoral geometry predicts hip fracture: the study of osteoporotic fractures. J Bone Miner Res. 1993;8:1211–1217. doi: 10.1002/jbmr.5650081008. [DOI] [PubMed] [Google Scholar]
- 4.Ammann P. Strontium ranelate: a novel mode of action leading to renewed bone quality. Osteoporos Int. 2005;16(Suppl 1):S11–S15. doi: 10.1007/s00198-004-1809-9. [DOI] [PubMed] [Google Scholar]
- 5.Pulkkinen P, Partanen J, Jalovaara P, Jamsa T. Combination of bone mineral density and upper femur geometry improves the prediction of hip fracture. Osteoporos Int. 2004;15:274–280. doi: 10.1007/s00198-003-1556-3. [DOI] [PubMed] [Google Scholar]
- 6.Gnudi S, Sitta E, Fiumi N. Bone density and geometry in assessing hip fracture risk in post-menopausal women. Br J Radiol. 2007;80:893–897. doi: 10.1259/bjr/37401526. [DOI] [PubMed] [Google Scholar]
- 7.Chin K, Evans MC, Cornish J, Cundy T, Reid IR. Differences in hip axis and femoral neck length in premenopausal women of Polynesian, Asian and European origin. Osteoporos Int. 1997;7:344–347. doi: 10.1007/BF01623775. [DOI] [PubMed] [Google Scholar]
- 8.Cummings SR, Cauley JA, Palermo L, Ross PD, Wasnich RD, Black D, Faulkner KG. Racial differences in hip axis lengths might explain racial differences in rates of hip fracture. Study of Osteoporotic Fractures Research Group. Osteoporos Int. 1994;4:226–229. doi: 10.1007/BF01623243. [DOI] [PubMed] [Google Scholar]
- 9.Wang XF, Duan Y, Beck TJ, Seeman E. Varying contributions of growth and ageing to racial and sex differences in femoral neck structure and strength in old age. Bone. 2005;36:978–986. doi: 10.1016/j.bone.2004.11.015. [DOI] [PubMed] [Google Scholar]
- 10.Duan Y, Turner CH, Kim BT, Seeman E. Sexual dimorphism in vertebral fragility is more the result of gender differences in age-related bone gain than bone loss. J Bone Miner Res. 2001;16:2267–2275. doi: 10.1359/jbmr.2001.16.12.2267. [DOI] [PubMed] [Google Scholar]
- 11.Xu L, Lu A, Zhao X, Chen X, Cummings SR. Very low rates of hip fracture in Beijing, People’s Republic of China the Beijing Osteoporosis Project. Am J Epidemiol. 1996;144:901–907. doi: 10.1093/oxfordjournals.aje.a009024. [DOI] [PubMed] [Google Scholar]
- 12.Zhang L, Cheng A, Bai Z, Lu Y, Endo N, Dohmae Y, Takahashi HE. Epidemiology of cervical and trochanteric fractures of the proximal femur in 1994 in Tangshan, China. J Bone Miner Metab. 2000;18:84–88. doi: 10.1007/s007740050016. [DOI] [PubMed] [Google Scholar]
- 13.Yan L, Zhou B, Prentice A, Wang X, Golden MH. Epidemiological study of hip fracture in Shenyang, People’s Republic of China. Bone. 1999;24:151–155. doi: 10.1016/s8756-3282(98)00168-9. [DOI] [PubMed] [Google Scholar]
- 14.Xu H, Long JR, Yang YJ, Deng FY, Deng HW. Genetic determination and correlation of body weight and body mass index (BMI) and cross-sectional geometric parameters of the femoral neck. Osteoporos Int. 2006;17:1602–1607. doi: 10.1007/s00198-006-0141-y. [DOI] [PubMed] [Google Scholar]
- 15.Ross PD, Norimatsu H, Davis JW, Yano K, Wasnich RD, Fujiwara S, Hosoda Y, Melton LJ., III A comparison of hip fracture incidence among native Japanese, Japanese Americans, and American Caucasians. Am J Epidemiol. 1991;133:801–809. doi: 10.1093/oxfordjournals.aje.a115959. [DOI] [PubMed] [Google Scholar]
- 16.Xiong DH, Liu YZ, Liu PY, Zhao LJ, Deng HW. Association analysis of estrogen receptor alpha gene polymorphisms with cross-sectional geometry of the femoral neck in Caucasian nuclear families. Osteoporos Int. 2005;16:2113–2122. doi: 10.1007/s00198-005-2011-4. [DOI] [PubMed] [Google Scholar]
- 17.Deng FY, Xiao P, Lei SF, Zhang L, Yang F, Tang ZH, Liu PY, Liu YJ, Recker RR, Deng HW. Bivariate whole genome linkage analysis for femoral neck geometric parameters and total body lean mass. J Bone Miner Res. 2007;22:808–816. doi: 10.1359/jbmr.070303. [DOI] [PubMed] [Google Scholar]
- 18.Deng HW, Deng H, Liu YJ, Liu YZ, Xu FH, Shen H, Conway T, Li JL, Huang QY, Davies KM, Recker RR. A genome wide linkage scan for quantitative-trait loci for obesity phenotypes. Am J Hum Genet. 2002;70:1138–1151. doi: 10.1086/339934. [DOI] [PMC free article] [PubMed] [Google Scholar]
- 19.Deng HW, Deng XT, Conway T, Xu FH, Heaney R, Recker RR. Determination of bone size of hip, spine, and wrist in human pedigrees by genetic and lifestyle factors. J Clin Densitom. 2002;5:45–56. doi: 10.1385/jcd:5:1:045. [DOI] [PubMed] [Google Scholar]
- 20.Recker R, Lappe J, Davies K, Heaney R. Characterization of perimenopausal bone loss: a prospective study. J Bone Miner Res. 2000;15(10):1965–1973. doi: 10.1359/jbmr.2000.15.10.1965. [DOI] [PubMed] [Google Scholar]
- 21.Deng HW, Chen WM, Conway T, Zhou Y, Davies KM, Stegman MR, Deng H, Recker RR. Determination of bone mineral density of the hip and spine in human pedigrees by genetic and life-style factors. Genet Epidemiol. 2000;19(2):160–177. doi: 10.1002/1098-2272(200009)19:2<160::AID-GEPI4>3.0.CO;2-H. [DOI] [PubMed] [Google Scholar]
- 22.Filardi S, Zebaze RM, Duan Y, Edmonds J, Beck T, Seeman E. Femoral neck fragility in women has its structural and biomechanical basis established by periosteal modeling during growth and endocortical remodeling during aging. Osteoporos Int. 2004;15:103–107. doi: 10.1007/s00198-003-1539-4. [DOI] [PubMed] [Google Scholar]
- 23.Kaptoge S, Dalzell N, Loveridge N, Beck TJ, Khaw KT, Reeve J. Effects of gender, anthropometric variables, and aging on the evolution of hip strength in men and women aged over 65. Bone. 2003;32:561–570. doi: 10.1016/s8756-3282(03)00055-3. [DOI] [PubMed] [Google Scholar]
- 24.Rivadeneira F, Houwing-Duistermaat JJ, Beck TJ, Janssen JA, Hofman A, Pols HA, Van Duijn CM, Uitterlinden AG. The influence of an insulin-like growth factor I gene promoter polymorphism on hip bone geometry and the risk of nonvertebral fracture in the elderly: the Rotterdam Study. J Bone Miner Res. 2004;19:1280–1290. doi: 10.1359/JBMR.040405. [DOI] [PubMed] [Google Scholar]
- 25.Duan Y, Beck TJ, Wang XF, Seeman E. Structural and biomechanical basis of sexual dimorphism in femoral neck fragility has its origins in growth and aging. J Bone Miner Res. 2003;18:1766–1774. doi: 10.1359/jbmr.2003.18.10.1766. [DOI] [PubMed] [Google Scholar]
- 26.Beck TJ, Looker AC, Ruff CB, Sievanen H, Wahner HW. Structural trends in the aging femoral neck and proximal shaft: analysis of the Third National Health and Nutrition Examination Survey dual-energy X-ray absorptiometry data. J Bone Miner Res. 2000;15:2297–2304. doi: 10.1359/jbmr.2000.15.12.2297. [DOI] [PubMed] [Google Scholar]
- 27.Lauderdale DS, Jacobsen SJ, Furner SE, Levy PS, Brody JA, Goldberg J. Hip fracture incidence among elderly Asian-American populations. Am J Epidemiol. 1997;146:502–509. doi: 10.1093/oxfordjournals.aje.a009304. [DOI] [PubMed] [Google Scholar]
- 28.Nakamura T, Turner CH, Yoshikawa T, Slemenda CW, Peacock M, Burr DB, Mizuno Y, Orimo H, Ouchi Y, Johnston CC., Jr Do variations in hip geometry explain differences in hip fracture risk between Japanese and white Americans? J Bone Miner Res. 1994;9:1071–1076. doi: 10.1002/jbmr.5650090715. [DOI] [PubMed] [Google Scholar]
- 29.Lekamwasam S, Lenora J. Age-related trends in hip geometry in Sri Lankan women: a cross-sectional study. J Bone Miner Metab. 2007;25:431–435. doi: 10.1007/s00774-007-0762-z. [DOI] [PubMed] [Google Scholar]
- 30.Yu W, Qin M, Xu L, van Kuijk C, Meng X, Xing X, Cao J, Genant HK. Normal changes in spinal bone mineral density in a Chinese population: assessment by quantitative computed tomography and dual-energy X-ray absorptiometry. Osteoporos Int. 1999;9:179–187. doi: 10.1007/s001980050133. [DOI] [PubMed] [Google Scholar]
- 31.Fujii Y, Tsutsumi M, Tsunenari T, Fukase M, Yoshimoto Y, Fujita T, Genant HK. Quantitative computed tomography of lumbar vertebrae in Japanese patients with osteoporosis. Bone Miner. 1989;6:87–94. doi: 10.1016/0169-6009(89)90026-3. [DOI] [PubMed] [Google Scholar]
- 32.Beck TJ, Oreskovic TL, Stone KL, Ruff CB, Ensrud K, Nevitt MC, Genant HK, Cummings SR. Structural adaptation to changing skeletal load in the progression toward hip fragility: the study of osteoporotic fractures. J Bone Miner Res. 2001;16:1108–1119. doi: 10.1359/jbmr.2001.16.6.1108. [DOI] [PubMed] [Google Scholar]
- 33.Yoshimura N, Hashimoto T, Sakata K, Morioka S, Kasamatsu T, Cooper C. Biochemical markers of bone turnover and bone loss at the lumbar spine and femoral neck: the Taiji study. Calcif Tissue Int. 1999;65:198–202. doi: 10.1007/s002239900682. [DOI] [PubMed] [Google Scholar]
- 34.Sone T, Miyake M, Takeda N, Fukunaga M. Urinary excretion of type I collagen crosslinked N-telopeptides in healthy Japanese adults: age- and sex-related changes and reference limits. Bone. 1995;17:335–339. doi: 10.1016/s8756-3282(95)00243-x. [DOI] [PubMed] [Google Scholar]
- 35.Tsai KS, Pan WH, Hsu SH, Cheng WC, Chen CK, Chieng PU, Yang RS, Twu ST. Sexual differences in bone markers and bone mineral density of normal Chinese. Calcif Tissue Int. 1996;59:454–460. doi: 10.1007/BF00369210. [DOI] [PubMed] [Google Scholar]
- 36.Center JR, Nguyen TV, Sambrook PN, Eisman JA. Hormonal and biochemical parameters in the determination of osteoporosis in elderly men. J Clin Endocrinol Metab. 1999;84:3626–3635. doi: 10.1210/jcem.84.10.6051. [DOI] [PubMed] [Google Scholar]
- 37.Greendale GA, Edelstein S, Barrett-Connor E. Endogenous sex steroids and bone mineral density in older women and men: the Rancho Bernardo Study. J Bone Miner Res. 1997;12:1833–1843. doi: 10.1359/jbmr.1997.12.11.1833. [DOI] [PubMed] [Google Scholar]
- 38.Hughes DE, Dai A, Tiffee JC, Li HH, Mundy GR, Boyce BF. Estrogen promotes apoptosis of murine osteoclasts mediated by TGF-beta. Nat Med. 1996;2:1132–1136. doi: 10.1038/nm1096-1132. [DOI] [PubMed] [Google Scholar]
- 39.Gilbert L, He X, Farmer P, Boden S, Kozlowski M, Rubin J, Nanes MS. Inhibition of osteoblast differentiation by tumor necrosis factor-alpha. Endocrinology. 2000;141:3956–3964. doi: 10.1210/endo.141.11.7739. [DOI] [PubMed] [Google Scholar]
- 40.Meunier PJ, Chapuy MC, Arlot ME, Delmas PD, Duboeuf F. Can we stop bone loss and prevent hip fractures in the elderly? Osteoporos Int. 1994;4(Suppl 1):71–76. doi: 10.1007/BF01623440. [DOI] [PubMed] [Google Scholar]
- 41.Eriksen EF, Langdahl B, Vesterby A, Rungby J, Kassem M. Hormone replacement therapy prevents osteoclastic hyperactivity: a histomorphometric study in early postmenopausal women. J Bone Miner Res. 1999;14:1217–1221. doi: 10.1359/jbmr.1999.14.7.1217. [DOI] [PubMed] [Google Scholar]
- 42.Pacifici R. Estrogen deficiency, T cells and bone loss. Cell Immunol. 2007;252(1–2):68–80. doi: 10.1016/j.cellimm.2007.06.008. [DOI] [PubMed] [Google Scholar]
- 43.O’Neill TW, Felsenberg D, Varlow J, Cooper C, Kanis JA, Silman AJ. The prevalence of vertebral deformity in european men and women: the European Vertebral Osteoporosis Study. J Bone Miner Res. 1996;11:1010–1018. doi: 10.1002/jbmr.5650110719. [DOI] [PubMed] [Google Scholar]
- 44.Ebbesen EN, Thomsen JS, Beck-Nielsen H, Nepper-Rasmussen HJ, Mosekilde L. Age- and gender-related differences in vertebral bone mass, density, and strength. J Bone Miner Res. 1999;14:1394–1403. doi: 10.1359/jbmr.1999.14.8.1394. [DOI] [PubMed] [Google Scholar]
- 45.Duan Y, Seeman E. Bone fragility in Asian and Caucasian men. Ann Acad Med Singap. 2002;31:54–66. [PubMed] [Google Scholar]
- 46.Liao EY, Wu XP, Deng XG, Huang G, Zhu XP, Long ZF, Wang WB, Tang WL, Zhang H. Age-related bone mineral density, accumulated bone loss rate and prevalence of osteoporosis at multiple skeletal sites in chinese women. Osteoporos Int. 2002;13:669–676. doi: 10.1007/s001980200091. [DOI] [PubMed] [Google Scholar]
- 47.Seeman E. The structural and biomechanical basis of the gain and loss of bone strength in women and men. Endocrinol Metab Clin North Am. 2003;32:25–38. doi: 10.1016/s0889-8529(02)00078-6. [DOI] [PubMed] [Google Scholar]
- 48.Lips P, Courpron P, Meunier PJ. Mean wall thickness of trabecular bone packets in the human iliac crest: changes with age. Calcif Tissue Res. 1978;26:13–17. doi: 10.1007/BF02013227. [DOI] [PubMed] [Google Scholar]


