Abstract
A single-voxel 1H-MRS filtering strategy for in vivo detection of serine (Ser) in human brain at 7T is proposed. Spectral difference of coupled resonances arising from different subecho times of triple refocusing at a constant total echo time was utilized to detect the Ser multiplet and cancel the overlapping creatine (Cr) 3.92-ppm singlet via difference editing. Dependence of the Ser signal on subecho times was investigated using density-matrix simulation incorporating the slice-selective RF pulses. The simulation indicated that the difference-edited Ser CH2 multiplet at ~3.96 ppm is maximized with (TE1, TE2, TE3) = (54, 78, 78) and (36, 152, 22) ms. The edited Ser peak amplitude was estimated, with both numerical and phantom analyses of the performance, as 83% with respect to 90°-acquisition for a localized volume, ignoring relaxation effects. From the area ratio of the edited Ser and unedited Cr 3.03-ppm peaks, assuming identical T1 and T2 between Ser and Cr, the Ser-to-Cr concentration ratio for the frontal cortex of healthy adults was estimated to be 0.8 ± 0.2 (mean ± SD, n = 6).
Keywords: Serine, Human brain, Triple refocusing, Difference editing
INTRODUCTION
Serine (Ser) is an endogenous amino acid in brain which functions as a co-agonist with glutamate at the N-methyl-D-aspartate (NMDA) receptor, modulating the activity of glutamate at the NMDA ionophore (1–4). In disorders of cognition, especially psychosis, alterations in glutamate transmission have been found, possibly including serine signaling (5–7). Pharmacologic approaches for treating schizophrenia with serine or its agonists have been proposed. A sensitive measure of serine in brain could be pivotal in defining regional tissue pathology and/or a biomarker of response.
Ser has three non-exchangeable protons from a CH2 group and a CH group, forming an ABX spin system with resonances at 3.98, 3.94 and 3.83 ppm, respectively. The spins are scalar coupled with strength of (JAB, JAX, JBX) = (−12.3, 3.6, 6.0) Hz, giving a doublet of doublet at the resonances (8). In vivo detection of Ser in the human brain remains as a challenge due to its relatively low concentration (~0.4 mM) and the spectral overlap by the large methylene resonance of creatine (Cr) at 3.92 ppm. The first attempt to measure this low-abundance metabolite in vivo was reported recently (9). This spectrally selective refocusing method employed, at 4T, a narrow-band 180° RF pulse to selectively refocus the Ser CH proton resonance at 3.83 ppm and to dephase the Cr 3.92-ppm resonance. The clinical utility of this method may be somewhat limited because the Ser signal intensity and lineshape are both sensitive to frequency drifts under the narrow-band 180° pulse, arising from subject movements during a potentially long scan time that is required to achieve an acceptable signal to noise ratio (SNR) of this low-concentration metabolite.
Here, we propose a constant-TE triple-refocusing difference editing strategy for detection of Ser without the need of spectrally-selective excitation between the proximate Ser resonances. The method utilizes difference in spectral pattern of scalar coupled resonances following a pair of subecho time sets (i.e., TE1, TE2 and TE3) at a constant total echo time (TE). Subtraction between subspectra reveals a Ser CH2 multiplet, while canceling the Cr 3.92-ppm singlet which depends on TE only. Subecho times were optimized with density matrix simulation and the performance of the editing was validated in phantom tests. A preliminary in vivo study has focused on the human frontal brain, a region with particular relevance for neuropsychiatric disorders (10,11).
METHODS and MATERIALS
RF Sequence and Echo Time Optimization by Density Matrix Simulation
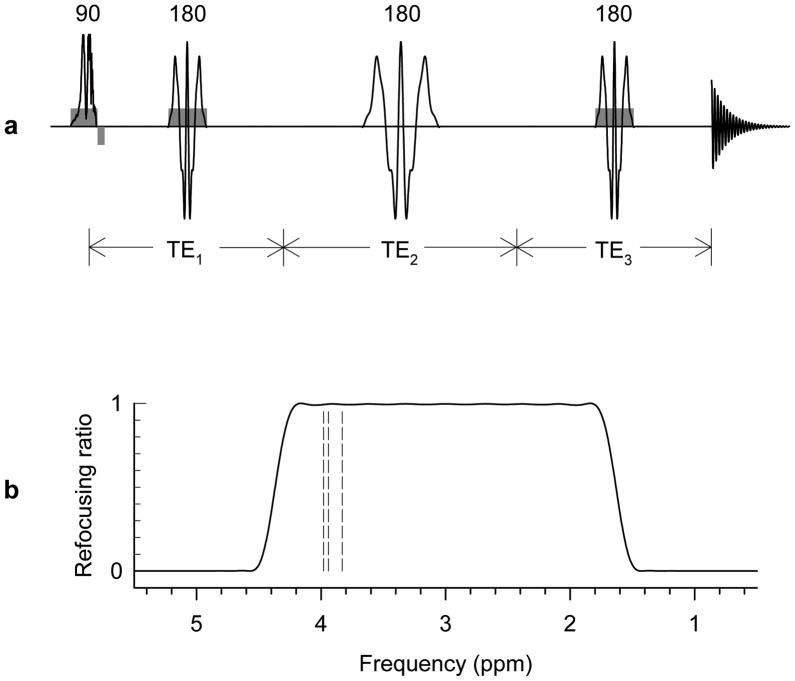
Scalar coupled resonances exhibit different spectral patterns between different sets of subecho times in a multiple refocusing sequence. Since the Cr 3.92-ppm signal intensity, which is the primary obstacle in Ser detection, depends on the total echo time only, subtraction of spectra obtained with different sets of subecho times at a constant total TE can be utilized to detect the coupled Ser resonances, while canceling the Cr methylene signal. A triple refocusing sequence was explored for detection of the CH2 proton resonances of Ser in the human brain. A 180° RF pulse was inserted within PRESS (point-resolved spectroscopy), as illustrated in Fig. 1a. This 20-ms 180° pulse (bandwidth = 816 Hz), tuned to 3.0 ppm, refocused only resonances between 1.8 4.2 ppm, thus suppressing the water signal, Fig. 1b. The spatial localization part of the triple refocusing sequence consisted of an 8.8-ms amplitude/frequency-modulated 90° RF pulse (BW = 4.7 kHz) and two 11.9-ms amplitude modulated 180° RF pulses (BW = 1.4 kHz), both designed at B1 = 15 μT.
FIG. 1.
(a) Schematic diagram of a triple refocusing sequence employed for Ser difference editing. A spectrally-selective RF pulse was applied between the 180° pulses of a PRESS sequence indicated by three RF pulses with gradients. Spoiling gradients were applied symmetrically about the 180° pulses (not drawn). (b) Refocusing profile of the 20-ms spectrally-selective 180° pulse. With bandwidth of 816 Hz, this pulse, tuned to 3.0 ppm, refocused only the resonances between 1.8 and 4.2 ppm. Three vertical dashed lines indicate the Ser resonances.
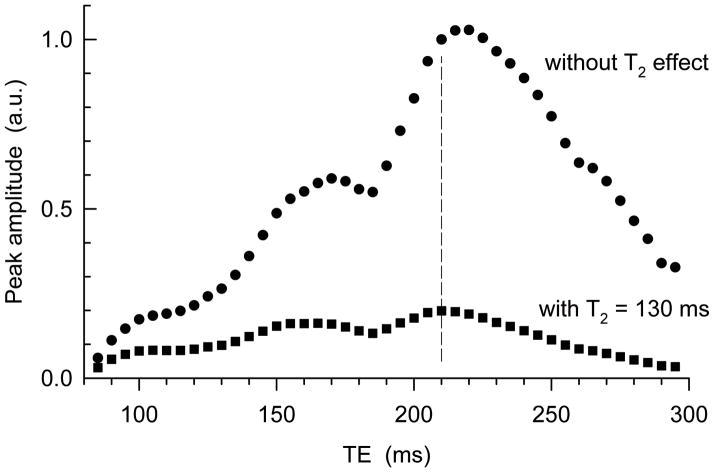
Density matrix simulation was employed to obtain a pair of optimal subecho time sets for maximum Ser editing efficiency. Published chemical shift and coupling constants (8) were used. The simulation was programmed with Matlab (The MathWorks Inc.). The density operator evolution during the 3D localization sequence was calculated incorporating slice-selective RF and gradient pulses in the simulation, as previously described (12,13). Ser spectra were obtained for subecho times TE1 = 20 300 ms, TE2 = 20 300 ms, and TE3 = 15 300 ms, with increments of 5 ms for each subecho times. Difference spectra between all possible pairs of (TE1, TE2, TE3) were calculated to obtain a pair of subecho time sets which gives the maximum difference-edited Ser signal at individual total echo times. The result of this simulation is illustrated in Fig. 2. The difference edited Ser signal intensity increases with increasing TE up to TE = 215 ms and decrease thereafter when there is no T2 effect. For an approximate Ser T2 of 130 ms, which is a mean value of published Cr and NAA T2s at 7T (14), the TE dependence of the signal amplitude is changed and as a result the TE for maximum amplitude is reduced to 210 ms. This echo time is advantageous over TE = ~160 ms for Ser T2 > 85 ms. The subecho time optimization for this TE was further carried out with smaller increments. For a 2 ms increment, 2556 sets of (TE1, TE2, TE3) were possible at this TE and the number of subecho time pairs was 3,265,290. As a result of searching among these numerous pairs, an optimum pair of subecho times was obtained as (TE1, TE2, TE3) = (54, 78, 78) and (36, 152, 22) ms. Optimization with a smaller increment was not pursued since it takes unrealistically long time and it may not enhance the editing efficiency substantially. In practice, subecho time optimization for a 2-ms increment took 1000 times longer than optimization for a 5-ms increment, but the signal enhancement was only marginal (0.2%). Therefore, the subecho time optimization with a 2-ms increment of the present study may be reasonably precise.
FIG 2.
The maximum Ser editing efficiency (obtained from numerous (TE1, TE2, TE3) subecho time sets for individual TEs of triple refocusing) is plotted versus TE (= TE1+TE2+TE3). For a metabolite T2 of 130 ms at 7T (14), the peak amplitude is maximum at TE = 210 ms, indicated by a vertical dashed line. The amplitude was obtained from the Ser CH2 multiplet broadened to 9 Hz.
Experimental
Experiments were carried out on a 7.0 T whole-body Philips scanner (Philips Medical Systems, Cleveland, Ohio, USA). A quadrature head coil was used for RF transmission and a 16-channel phased-array coil was used for signal reception. The maximum available RF field intensity (B1) was 15μT. Single-voxel localization was obtained with a 90° RF pulse (amplitude/frequency-modulated (non-adiabatic); 8.8 ms; BW = 4.7 kHz) and two 180° RF pulses (amplitude modulated; 11.9 ms; BW = 1.4 kHz).
The difference editing was tested on a spherical phantom (i.d. = 6 cm), with Ser (80 mM), NAA (51 mM), and glycine (Gly) (41 mM). Proton spectra following the editing sequence were acquired from a single voxel (20 × 20 × 20 mm3) with TR = 15 s (> 6T1 for the phantom solutions).
In vivo tests of the editing sequence were conducted on six healthy volunteers, aged 20–40 years. The protocol was approved by the Institutional Review Board of the University of Texas Southwestern Medical Center. Written informed consent was obtained prior to the scans. A 45 × 45 × 30 mm3 voxel was positioned in the frontal cortex, on the anterior-posterior commissure (AC-PC) axis (see the voxel positioning in Fig. 5). Second-order shimming for the selected volume was carried out using FASTMAP (15). Two subspectra of the triple refocused difference editing scheme were acquired at (TE1, TE2, TE3) = (54, 78, 78) and (36, 152, 22) ms, applied alternatively in a 32-block data acquisition, each with 16 averages; the total number of averages being 512. Data acquisition parameters were TR 2.5 s, sweep width 5 kHz, and number of sampling points 4096. Total scan time was 21 min. A 256-step phase cycling scheme was employed, incorporating four steps for each RF pulse. A variable-flip-angle water suppression subsequence (16), with four 15-ms Gaussian RF pulses separated by 40 ms, was applied prior to the editing sequence. The carrier of the volume selective RF pulses was set to 3.0 ppm. The residual eddy current effect on the editing data was removed by correcting the phase of the individual data points of each FID, using the phase factor of the water FID acquired with an identical gradient scheme. The 32 data blocks were corrected for frequency drift and phase individually before the summation of the spectra. A concentration ratio of Ser and Cr was estimated from peak areas of the edited Ser and unedited Cr 3.03-ppm signals in simulation and in vivo, assuming identical relaxation times of the metabolites.
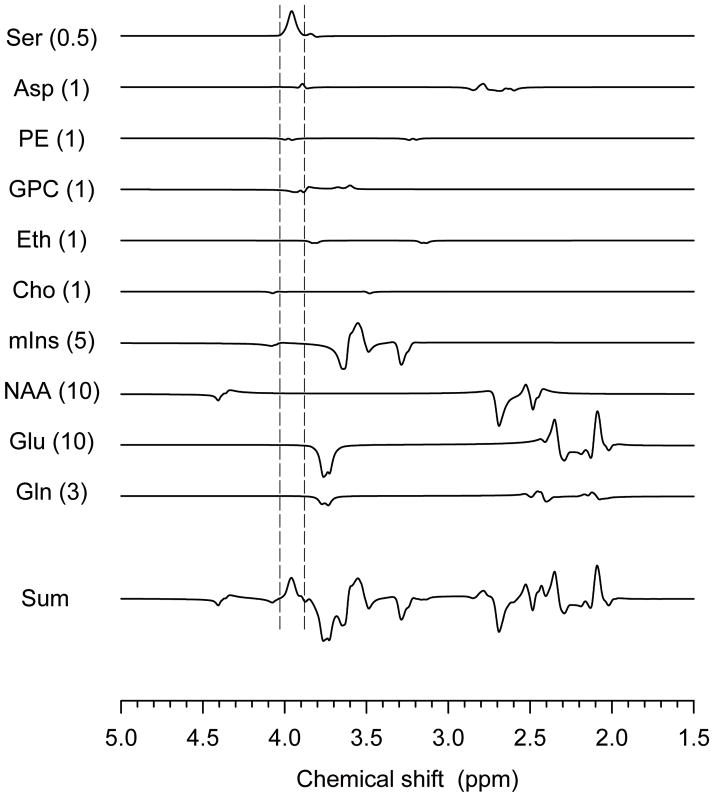
FIG. 5.
Numerically-calculated edited spectra of serine and several brain metabolites are plotted for physiological concentrations indicated within brackets. The metabolites are Ser, Asp (aspartate), PE (phosphorylethanolamine), GPC (glycerol moiety of glycerophosphorylcholine), Eth (ethanolamine), Cho (coupled resonances of choline), GABA (γ-amynobutyric acid), GSH (cysteine moiety of glutathione), mIns (myo-inositol), NAA (aspartate moiety of N-acetylaspartate), Glu (glutamate) and Gln (glutamine).
RESULTS AND DISCUSSION
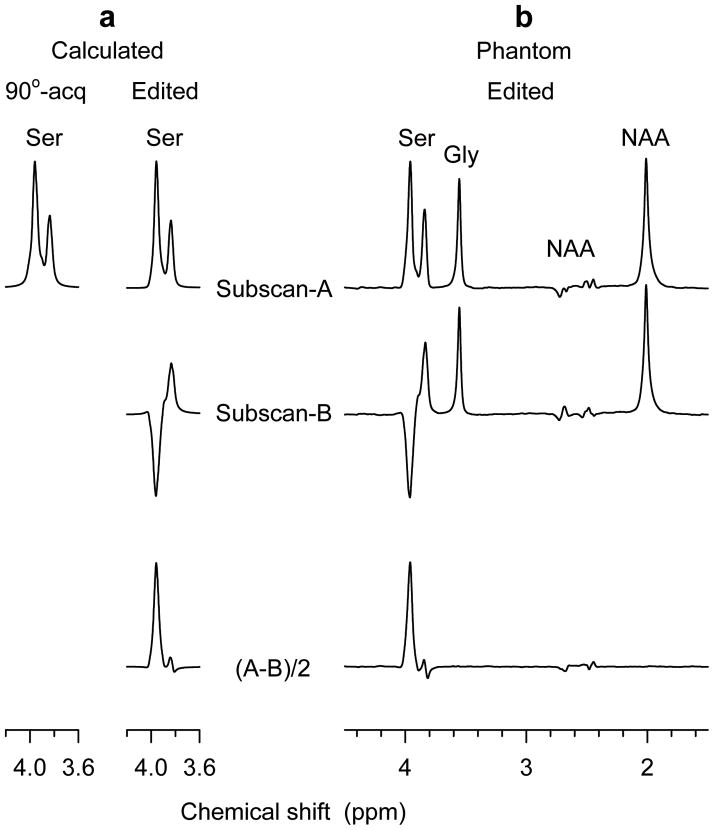
Figure 3a illustrates numerically calculated spectra of Ser for 90°-acquisition and the triple-refocused difference editing. The signal intensity of a 90°-acquired spectrum was adjusted according to a localized volume to entire volume ratio in the simulation, as described earlier (13). The 90°-acquired spectrum exhibits two peaks given a 9-Hz line broadening. The CH2 group resonances (3.98 and 3.94 ppm) give a dominant peak at ~3.96 ppm and the CH proton resonance appears at 3.83 ppm. Ignoring T2 effects, the J modulation returns a Ser multiplet with amplitude about the same as that of 90°-acquisition at (TE1, TE2, TE3) = (54, 78, 78) ms (subscan A). Scalar evolution causes the CH2-proton multiplet at ~3.96 ppm to be inverted with amplitude 65% relative to 90°-acquisition at (TE1, TE2, TE3) = (36, 152, 22) ms (subscan B). Subtraction between these two subscans gives rise to an edited multiplet at ~3.96 ppm, with amplitude 83% with respect to that of 90°-acquisition for linewidth of 0.03–0.04 ppm (9–12 Hz at 7T). The area of the Ser edited multiplet is estimated as 66% relative to 90°-acquisition. For an approximate Ser T2 of 130 ms, these amplitude and peak area ratios are reduced to 17% and 13%, respectively. In addition, for an identical concentration between Ser and Cr, the peak amplitude and area ratios of the edited Ser and unedited Cr methyl proton (3.03 ppm) signals are 37.8% and 43.7%, respectively. This peak area ratio was used for estimation of the Ser concentration in vivo.
FIG 3.
(a) Simulated spectra of Ser for volume-localized 90°-acquisition and triple-refocused difference editing. Subscans A and B correspond to (TE1, TE2, TE3) = (54, 78, 78) and (36, 152, 22) ms, respectively. (b) Sub- and edited spectra obtained from an aqueous solution with Ser (80 mM), Gly (41 mM) and NAA (51 mM). Spectra are broadened to 9 Hz.
Figure 3b presents phantom results of the Ser difference editing. The subscan A shows a positive multiplet of the Ser CH2 resonances at ~3.96 ppm. In subscan B, this CH2-proton multiplet is inverted due to the J modulation effect. The CH-proton multiplet at 3.83 ppm remains positive with similar amplitude in the subscans. Subtraction between the subspectra gives an edited Ser CH2 multiplet at ~3.96 ppm, while the Ser CH peak is largely canceled. The lineshape and signal intensity of Ser in sub- and subtracted spectra are in good agreement with the calculation of Fig. 3a. The Gly and NAA singlets, which depend on TE only, remain unchanged in the subspectra and consequently are canceled in the difference spectrum. The area ratio of the edited Ser multiplet and the NAA 2.01-ppm singlet is measured as 0.688. Using the numerically-calculated peak area ratio for an equal concentration (0.437), the Ser-to-NAA concentration ratio of the phantom is calculated as 1.57, in excellent agreement with the actual concentration ratio (80/51 = 1.568). This result reflects a similarity of Ser and NAA T2 in the aqueous solution, as verified experimentally (T2 ≅ 1.2 s). The Gly-to-NAA signal ratio (0.571) is slightly greater than predicted by their concentration ratio, most likely due to the long Gly T2 (~1.8 s) in the phantom solution.
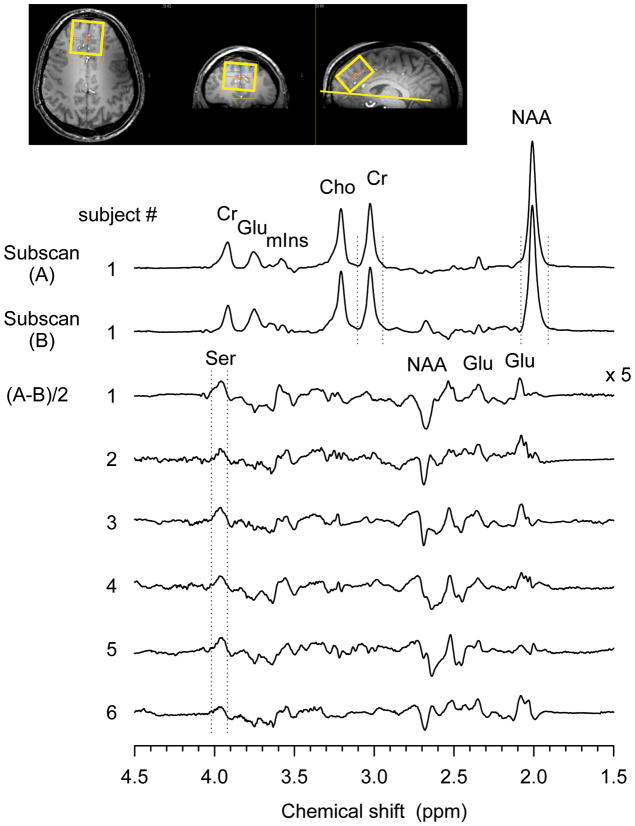
Figure 4 displays a stack of in vivo subscan and difference edited spectra obtained from the frontal brain of the six healthy subjects. Difference-edited spectra exhibit a small peak at 3.96 ppm consistently which is attributed to Ser. The singlets of Cr, NAA and Cho are canceled via subtraction and not discernible in the difference spectra. The coupled resonances of Glu, mIns and NAA which exhibit unequal lineshape in subspectra result in co-edited signals in the difference spectra. The area ratio of the 3.96-ppm edited peak to the unedited Cr 3.03-ppm signal was measured as 0.04±0.01 (mean±SD, n = 6). With the numerically-calculated Ser-to-Cr peak area ratio for an equal concentration (0.437), assuming identical T1 and T2 between Ser and Cr, the Ser-to-Cr concentration ratio was estimated to be 0.8 ± 0.2. This result is in good agreement with published post-mortem data (8,17).
FIG 4.
In-vivo triple-refocused difference-edited spectra obtained from six healthy volunteers are presented, together with the subspectra from a subject. A voxel (45 × 45 × 30 mm3) was positioned in the medial frontal lobe, tilted on the AC-PC line. Vertical lines indicate the spectral width for peak area calculation. Data were acquired with TR = 2.5 s, NEX = 256 (per subscan), and (TE1, TE2, TE3) = (54, 78, 78) (subscan-A) and (36, 152, 22) ms (subscan-B).
A subtraction error in cancelation of the Cr 3.92-ppm resonance may be estimated from the suppression ratio of the Cr 3.03-ppm resonance which undergoes similar cancelation. The suppression ratio of the Cr 3.03-ppm resonance is measured as approximately 150 in terms of peak area. The Cr 3.92-ppm to 3.03-ppm signal ratio is observed to be ~0.41 in the subspectra, smaller than the ratio of the number of protons (i.e., 2/3) due to the short T2 of the 3.92-ppm resonance (18). The contamination of the Cr 3.92-ppm resonance to the edited signal at 3.96 ppm is then estimated to be approximately 7% (= 0.41/150/0.04).
Additional compounds are present that may interfere Ser measurement. Fig. 6 shows numerically-calculated spectra of these interferences and several abundant metabolites which have coupled resonances and consequently leak through the subtraction. Major contaminants include aspartate (Asp), phosphorylethanolamine (PE) and glycerophosphorylcholine (GPC) (glycerol moiety) as these compounds have coupled resonances that overlap with the Ser CH2 resonances. Assuming a physiological concentration ratio of [Ser]:[Asp]:[PE]:[GPC]:[mIns] = 0.5:1:1:1:5 (8), the ratios of peak amplitude and area in the edited spectrum are predicted as 100:12:–7:-11:–6 and 100:3:-8:-19:-5 for a spectral region indicated by the vertical lines in the figure, respectively. This simulation result indicates that the negative contribution of the contaminants may cause an underestimation of the Ser level by ~30% when these contaminations are not taken into account. The contamination of the overlapping resonances may be resolved with spectral fitting when sufficiently high SNR is given.
In the proposed method, signal loss due to the T2 effect is substantial, approximately 80% for T2 = 130 ms. However, the long TE is the only choice for triple-refocused difference editing since editing efficiency is reduced at short TE drastically, as shown in Fig. 2. In addition, macromolecule resonances appear to be fairly abundant near the Ser resonances (19,20). With the long TE used for the in vivo tests, the macromolecule resonances are drastically attenuated and their contribution to the Ser resonance is negligible.
PRESS difference editing for Ser detection is also feasible. A numerical simulation indicates that the Ser edited signal is maximized at TE = 188 ms for T2 = 130 ms. This editing requires high-efficiency water suppression since incomplete water suppression may cause spectral distortion at the Ser resonance in the subspectra, thereby leading to subtraction error. Triple-refocusing based difference editing, which was adopted in the present study, has an advantage in that one of the three 180° pulses can be used for improving water suppression and minimizing experimental errors. Additionally, despite its longer TE, triple refocused difference editing appears to give enhanced Ser signal intensity (1.5 times) compared to PRESS based difference editing, as indicated by numerical simulations.
In conclusion, we have demonstrated the feasibility of triple-refocused difference editing for the in vivo detection of Ser in the human brain. SNR improvement may be achieved using reception with a surface coil. Further study will be required to determine the reliability and reproducibility of the measurements in different patient populations and brain regions.
Acknowledgments
This research was supported by funds received from the State of Texas in support of the Metroplex Comprehensive Medical Imaging Center. The authors thank Jeannie Davis and Sonya Rios for support with subject recruitments.
References
- 1.Tsai G, Yang P, Chung LC, Lange N, Coyle JT. D-serine added to antipsychotics for the treatment of schizophrenia. Biol Psychiatry. 1998;44:1081–1089. doi: 10.1016/s0006-3223(98)00279-0. [DOI] [PubMed] [Google Scholar]
- 2.Mothet JP, Parent AT, Wolosker H, Brady RO, Jr, Linden DJ, Ferris CD, Rogawski MA, Snyder SH. D-serine is an endogenous ligand for the glycine site of the N-methyl-D-aspartate receptor. Proc Natl Acad Sci U S A. 2000;97:4926–4931. doi: 10.1073/pnas.97.9.4926. [DOI] [PMC free article] [PubMed] [Google Scholar]
- 3.Wolosker H. D-serine regulation of NMDA receptor activity. Sci STKE. 2006;2006(356):pe41. doi: 10.1126/stke.3562006pe41. [DOI] [PubMed] [Google Scholar]
- 4.Panatier A, Theodosis DT, Mothet JP, Touquet B, Pollegioni L, Poulain DA, Oliet SH. Glia-derived D-serine controls NMDA receptor activity and synaptic memory. Cell. 2006;125:775–784. doi: 10.1016/j.cell.2006.02.051. [DOI] [PubMed] [Google Scholar]
- 5.Javitt DC, Zukin SR. Recent advances in the phencyclidine model of schizophrenia. Am J Psychiatry. 1991;148:1301–1308. doi: 10.1176/ajp.148.10.1301. [DOI] [PubMed] [Google Scholar]
- 6.Tamminga CA. Schizophrenia and glutamatergic transmission. Crit Rev Neurobiol. 1998;12(1–2):21–36. doi: 10.1615/critrevneurobiol.v12.i1-2.20. [DOI] [PubMed] [Google Scholar]
- 7.Coyle JT, Tsai G, Goff D. Converging evidence of NMDA receptor hypofunction in the pathophysiology of schizophrenia. Ann N Y Acad Sci. 2003;1003:318–327. doi: 10.1196/annals.1300.020. [DOI] [PubMed] [Google Scholar]
- 8.Govindaraju V, Young K, Maudsley AA. Proton NMR chemical shifts and coupling constants for brain metabolites. NMR Biomed. 2000;13:129–153. doi: 10.1002/1099-1492(200005)13:3<129::aid-nbm619>3.0.co;2-v. [DOI] [PubMed] [Google Scholar]
- 9.Theberge J, Renshaw PF. In vivo measurements of brain serine with 1H-MRS. Proceedings of the 15th Annual Meeting of ISMRM; Berlin, Germany. 2007. p. 1373. [Google Scholar]
- 10.Phillips ML, Drevets WC, Rauch SL, Lane R. Neurobiology of emotion perception II: Implications for major psychiatric disorders. Biol Psychiatry. 2003;54:515–528. doi: 10.1016/s0006-3223(03)00171-9. [DOI] [PubMed] [Google Scholar]
- 11.Hill K, Mann L, Laws KR, Stephenson CM, Nimmo-Smith I, McKenna PJ. Hypofrontality in schizophrenia: a meta-analysis of functional imaging studies. Acta Psychiatr Scand. 2004;110:243–256. doi: 10.1111/j.1600-0447.2004.00376.x. [DOI] [PubMed] [Google Scholar]
- 12.Choi C, Bhardwaj PP, Seres P, Kalra S, Tibbo PG, Coupland NJ. Measurement of glycine in human brain by triple refocusing 1H-MRS in vivo at 3.0T. Magn Reson Med. 2008;59:59–64. doi: 10.1002/mrm.21450. [DOI] [PubMed] [Google Scholar]
- 13.Choi C, Coupland NJ, Bhardwaj PP, Malykhin NK, Gheorghiu D, Allen PS. Measurement of brain glutamate and glutamine by spectrally-selective refocusing at 3 Tesla. Magn Reson Med. 2006;55:997–1005. doi: 10.1002/mrm.20875. [DOI] [PubMed] [Google Scholar]
- 14.Michaeli S, Garwood M, Zhu XH, DelaBarre L, Andersen P, Adriany G, Merkle H, Ugurbil K, Chen W. Proton T2 relaxation study of water, N-acetylaspartate, and creatine in human brain using Hahn and Carr-Purcell spin echoes at 4T and 7T. Magn Reson Med. 2002;47:629–633. doi: 10.1002/mrm.10135. [DOI] [PubMed] [Google Scholar]
- 15.Gruetter R. Automatic, localized in vivo adjustment of all first- and second-order shim coils. Magn Reson Med. 1993;29:804–811. doi: 10.1002/mrm.1910290613. [DOI] [PubMed] [Google Scholar]
- 16.Ogg RJ, Kingsley PB, Taylor JS. WET, a T1- and B1-insensitive water-suppression method for in vivo localized 1H NMR spectroscopy. J Magn Reson B. 1994;104:1–10. doi: 10.1006/jmrb.1994.1048. [DOI] [PubMed] [Google Scholar]
- 17.Kumashiro S, Hashimoto A, Nishikawa T. Free D-serine in post-mortem brains and spinal cords of individuals with and without neuropsychiatric diseases. Brain Res. 1995;681(1–2):117–125. doi: 10.1016/0006-8993(95)00307-c. [DOI] [PubMed] [Google Scholar]
- 18.Mlynarik V, Gruber S, Moser E. Proton T (1) and T (2) relaxation times of human brain metabolites at 3 Tesla. NMR Biomed. 2001;14:325–331. doi: 10.1002/nbm.713. [DOI] [PubMed] [Google Scholar]
- 19.Behar KL, Rothman DL, Spencer DD, Petroff OA. Analysis of macromolecule resonances in 1H NMR spectra of human brain. Magn Reson Med. 1994;32:294–302. doi: 10.1002/mrm.1910320304. [DOI] [PubMed] [Google Scholar]
- 20.Soher BJ, Pattany PM, Matson GB, Maudsley AA. Observation of coupled 1H metabolite resonances at long TE. Magn Reson Med. 2005;53:1283–1287. doi: 10.1002/mrm.20491. [DOI] [PMC free article] [PubMed] [Google Scholar]


