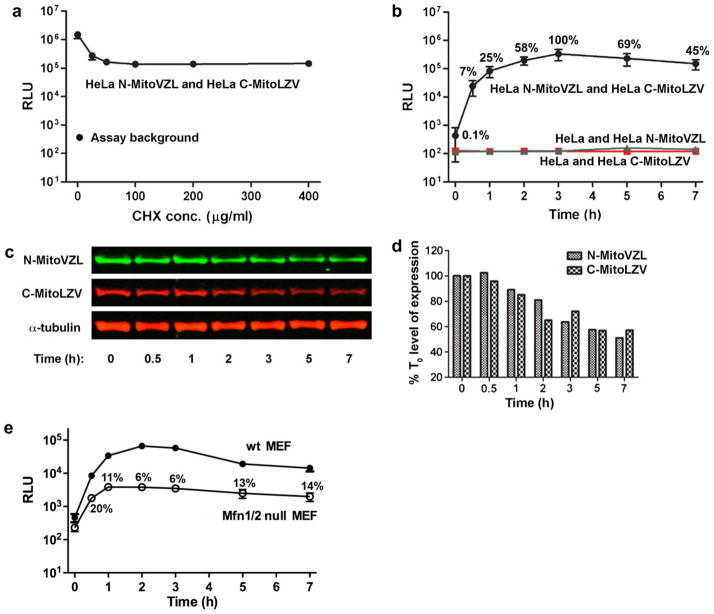
Fig. 2.
Mitochondrial fusion kinetics measured by split-Renilla luciferase complementation. (A) Luminescence of HeLa cells stably expressing the N-MitoVZL and C-MitoLZV split-Renilla luciferase constructs 7 h after PEG-1500 treatment to initiate cellular fusion, followed by mitochondrial fusion, in the indicated CHX concentrations. Assay background indicates luminescence of stably-transfected cells without PEG-1500 treatment. (B) Luminescence of HeLa cells stably expressing N-MitoVZL and C-MitoLZV (black), N-MitoVZL only (green), and C-MitoLZV only (red) at the indicated times after PEG-1500 treatment in 100 μg/ml CHX. Time 0 represents the point of PEG-1500 addition; samples at time 0 were not treated with PEG-1500. % values indicate the RLU normalized to the signal at the 3 h fusion time point. (C) Western blot analysis of HeLa cell lysates harvested at indicated times after PEG-1500 treatment. N-MitoVZL was visualized using anti-HA antibody, and C-MitoLZV using anti-FLAG antibody. (D) Quantification of protein levels in Fig. 2c normalized to α-tubulin. (E) Luminescence of Mfn1/2−/− MEF cells stably expressing the split-Renilla luciferase constructs at indicated times after PEG-1500 treatment, in comparison to the levels of fusion observed for wild-type MEF cells.% values indicate the RLU normalized to that measured in wild-type MEF cells at the corresponding time-point. (For interpretation of the references to colour in this figure legend, the reader is referred to the web version of this article.)

