Abstract
Dynamic field gradient focusing (DFGF) is an equilibrium gradient method that utilizes an electric field gradient to simultaneously separate and concentrate charged analytes based on their individual electrophoretic mobilities. This work describes the use of a 2-D nonlinear, numerical simulation to examine the impact of voltage loss from the electrodes to the separation channel, termed voltage degradation, and distortions in the electric field on the performance of DFGF. One of the design parameters that has a large impact on the degree of voltage degradation is the placement of the electrodes in relation to the separation channel. The simulation shows that a distance of about 3 mm from the electrodes to the separation channel gives the electric field profile with least amount of voltage degradation. The simulation was also used to describe the elution of focused protein peaks. The simulation shows that elution under constant electric field gradient gives better performance than elution through shallowing of the electric field. Qualitative agreement between the numerical simulation and experimental results is shown. The simulation also illustrates that the presence of a defocusing region at the cathodic end of the separation channel causes peak dispersion during elution. The numerical model is then used to design a system that does not suffer from a defocusing region. Peaks eluted under this design experienced no band broadening in our simulations. Preliminary experimental results using the redesigned chamber are shown.
Keywords: Dynamic field gradient focusing, Electrofocusing, Nonlinear simulation, Voltage degradation
1 Introduction
The need for fast, high-throughput, reproducible, and automated analytical separation techniques have slowed the advances of proteomic research and characterization [1–3]. Analytical-scale, biological separations are most commonly accomplished with the use of LC, CE, or SDS-PAGE. Even state-of-the-art advancements, namely multidimensional LC [4] and 2-DE [5], have proven only partially successful in the deconvolution of complex mixtures [6–8].
A different class of techniques known as equilibrium gradient methods (EGMs) [9–11] has shown promise due to their ability to simultaneously separate and concentrate analytes. Separation is based on the creation of a unique equilibrium position established at a point at which two opposing forces balance. When used in conjunction with other orthogonal separation techniques, EGMs not only give an added separation dimension but can also serve as preconcentrators and prefractionators. Several EGMs have been developed including density gradient sedimentation [12] and counteracting chromatographic electrophoresis (CACE) [13–15], but the most commonly utilized EGM is IEF. In this case, separation occurs in the presence of a pH gradient. An analyte will migrate along this gradient to a point at which the pH equals its individual pI. At this point, the analyte has zero net charge and is thus no longer acted upon by the applied electric field.
Though powerful and proven in the separation of biological systems, IEF suffers from the fact that the analytes are prone to precipitation at their pI’s and that they must be amphoteric with pI’s that are neither extremely acidic nor extremely basic (e.g., they focus in the 3<pH<10 range).
In 1996, Koegler and Ivory [16, 17] introduced a new EGM known as electric field gradient focusing (EFGF). Here separation occurs in the presence of an electric field gradient rather than a pH gradient. Charged analytes migrated along the separation channel in the direction of fluid flow to a point at which the hydrodynamic force is balanced by the electrophoretic force. Unlike IEF, EFGF does not require that the analytes are amphoteric, but must only have differences in their individual electrophoretic mobilities. Separation can occur at pHs far removed from the proteins’ pI’s, thus obviating problems associated with decreased solubilities.
One of the major drawbacks of the early EFGF design was that it proved to be awkward and difficult to setup. Recently, interest in EFGF has increased with the focus of research being placed on the development of systems that use alternative methods to generate the electric field gradient (for reviews see [15, 18–20]). Some of the major advances have been: (i) the use of dialysis membranes to form a conductivity gradient which gives rise to an electric field gradient [21–23], (ii) the use of shaped, ionically conductive polymers [24], (iii) the use of buffers with temperature dependent ionic strengths [25], and (iv) the use of a computer-controlled electrode array to generate the electric field gradient [26–28].
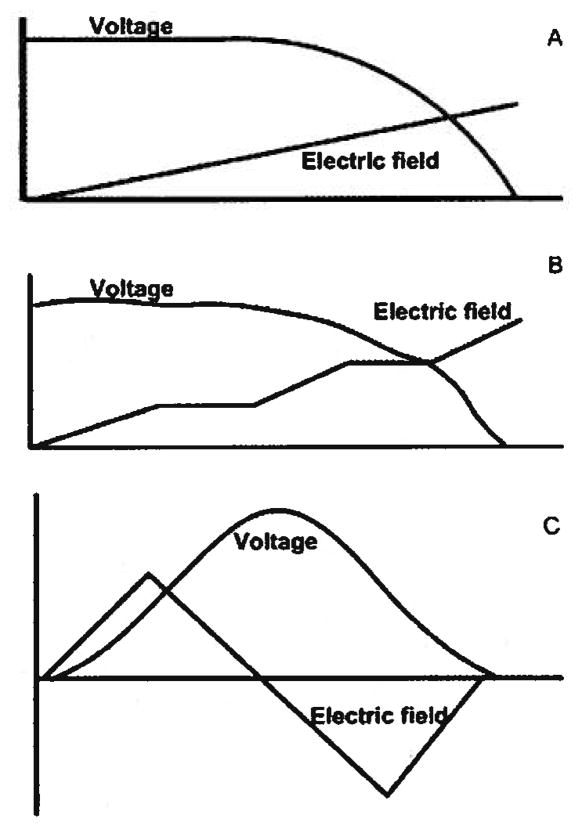
This last technique, known as dynamic field gradient focusing (DFGF), affords the researcher more control of the separation compared to the other EFGF systems. Dynamic control of the electrode array allows for manipulation of the electric field profile during the course of an experiment to increase peak resolution, migrate analytes to off-take ports, or to systematically elute individual species. Though only linear gradients have been reported, much more complicated profiles could easily be employed (Fig. 1).
Figure 1.
Schematic illustrating possible electric field profiles and the corresponding voltage profile. (A) Linear electric field gradient to be used in most cases. (B) Stair-step profile to be used when stacking and resolving sections are desired along the length of the separation channel. (C) Reversed-polarity profile to be used when both negatively and positively charged species need to be separated and concentrated.
Figure 1A shows a linear electric field gradient along with the corresponding voltages. This electric field profile is used in most instances and serves as a good starting point for new samples. In addition to a simple linear field, other nonlinear profiles can be used. Figure 1B illustrates a stair-stepped profile containing stacking regions (steep sections in the electric field) and resolving regions (shallow sections in the electric field). The advantage of using this type of nonlinear electric field gradient was demonstrated by Wang et al. [11]. They were able to show an increase in the peak capacity of almost 30 times as compared to using a linear profile. Unlike the device used by Wang et al. which is limited to a single nonlinear profile, DFGF has the ability to switch freely from one profile to another.
An additional feature of DFGF over other EFGF devices is illustrated in Fig. 1C. Here the separation channel is divided into a normal polarity region and a reversed polarity region. Use of this profile allows for the simultaneous concentration of both anions and cations. Anions will focus in the normal polarity region while cations focus in the reversed polarity region. Other EFGF techniques are limited to either anions or cations but not both.
Realization of the full potential of DFGF has been hindered by several performance bottlenecks that have led to reproducibility issues, diminished concentration factors and lower than expected resolution and peak capacity. Though each of these bottlenecks contributes to the decreased performance of DFGF, they themselves are not a limitation of the technique. Instead, they are engineering issues that can be addressed and alleviated. The bottlenecks include: (i) the need for an uncharged dialysis membrane to isolate the packed separation channel from the electrode/purge channel, (ii) polarization of protein onto the surface of the membrane, (iii) polarization of protein onto the surface of the chromatographic resin, (iv) depletion and enrichment of buffer salts in the separation channel, (v) loss of structural integrity in the membrane, and (vi) voltage degradation. This paper will focus on the impact of voltage degradation and the issues associated with voltage degradation that must be considered when developing a DFGF system. Descriptions of the other bottlenecks will be published at a later date.
Voltage degradation, as used in this case, refers to the difference between the voltage applied at the electrodes and the actual voltage measured within the separation channel. Several factors can influence the degree of degradation including electrode placement, size of the purge channel, electrode reactions, and resistance of the membrane. A 2-D numerical simulation constructed in Comsol Multiphysics v3.3 (COMSOL, Burlington, MA), a finite-element-based solver, is used to determine design parameters for a DFGF apparatus that virtually eliminates voltage degradation as a performance bottleneck. The key design issues that are addressed are the placement of the electrodes with respect to the separation channel and the removal of a peak-defocusing region that occurs near the cathodic end of the separation channel. Experimental results are used to confirm the findings of the numerical simulation.
2. Materials and methods
2.1. Reagents
All buffer components were purchased through Sigma–Aldrich (St. Louis, MO, USA). R-Phycoerythrin (PE) and allophycocyanin (APC) were purchased from Invitrogen (Carlsbad, CA, USA).
2.2 DFGF apparatus
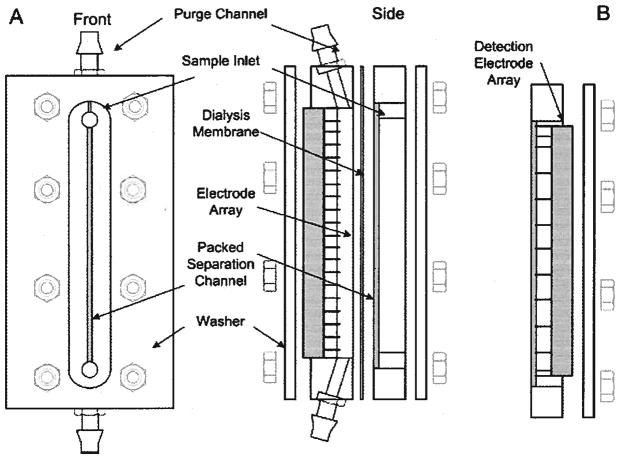
The focusing chamber is constructed from two 10.2 cm × 5.1 cm × 1.2 cm pieces of acrylic. The top piece, which contains the separation column, has a 5.7 cm × 0.1 cm × 200 μm channel machined into the surface. The bottom block contains a 6.5 cm × 0.1 cm × 0.3 cm trough, which serves both as a housing for the 21 controllable platinum electrodes and. as a purge channel to remove Joule heat and electrolysis products (Fig. 2A). Coolant buffer, 20 mM Tris-acetate (pH 8.6), circulates through a glass heat exchanger that is connected to a 5°C chiller (model: 1140, VWR Scientific Products, West Chester, PA, USA) and is then passed through the purge channel using a centrifugal pump (Cole Palmer, Vernon Hills, IL, USA). An inline section of silicone (VWR Scientific Products) tubing connected to house vacuum is used to remove dissolved gases from the recirculating buffer. A 6000 MWCO dialysis membrane (Spectrum Laboratories, Rancho Dominguez, CA, USA) isolates the separation column, which is packed with BioRad P-2 resin (BioRad Laboratories, Hercules, CA, USA), from the purge channel. A syringe pump (KD Scientific, Holliston, MA, USA) fitted with a 500 μL glass Hamilton syringe (Hamilton, Reno, NV, USA) controls the flow of running buffer through the separation column. The flow rate of the syringe pump and the electric field profile are controlled using a LabView (National Instruments, Austin, TX, USA) driver developed in our lab. This allows for complete automation of the system.
Figure 2.
DFGF schematic. (A) The purge channel circulates cooling buffer to remove Joule heat and electrolysis products. The separation channel is packed with a chromatographic resin to reduce band dispersion due to mass transfer effects and convection. The dialysis membrane separates the purge channel from the separation channel. The membrane allows the passage of current carrying ions but does not allow the passage of higher molecular weight species. The 21-pin electrode array is connected to the controller via a SCSI ribbon cable. (B) Front block used for measurement of voltage profile in separation channel. This block contains 11 platinum electrodes spaced at a 0.508 cm pitch. Measurements of each electrode are made relative to ground.
Experimental runs consisted of three stages of operation: injection, separation, and elution. During the injection stage the anodic end of the electric field at the inlet was set to 227 V/cm. The protein sample was loaded at 1.67 μL/min into an electric actuated VICI Cheminert injector (Valco Instruments, Houston, TX, USA) outfitted with a 10 μL sample loop using a second syringe pump (KD Scientific) equipped with a 3 mL Monoject syringe (VWR Scientific Products).
Once the protein sample had been completely loaded into the separation channel, the flow rate was reduced to 0.25 μL/min. For the separation experiments, the electric field profile remained the same during both the injection and separation stages, but could have easily been changed or adjusted had there been a need. After 60 min of separation, the focused proteins were eluted out of the bottom of the separation channel through a 25 cm, 50 μm id silica capillary (Polymicro Technologies, Phoenix, AZ, USA) connected to a UV–Vis detector (model: Linear 206 PHD).
2.3 Voltage measurements
To measure the voltage in the separation channel, a separate acrylic block containing an 11-pin electrode array with 0.508 cm spacing was used (Fig. 2B). Measurements were made using an Agilent 34401A 6½ Digit multimeter (Agilent Technologies, Santa Clara, CA). A 1000 MΩ miniature high voltage divider (EMCO High Voltage Corporation, Sutter Creek, CA) was connected to the multimeter to ensure that no current was drawn during the measurements.
2.4 Controller
The controller used in this study was described in detail elsewhere [29]. Briefly, the controller circuitry consists of nine interconnected printed-circuit boards. A total of fifty identical controller units were panelized and serially connected on the controller boards. This allows us to control up to fifty discrete electrodes. Each of the fifty units includes a monitoring and a control section. The monitoring section senses the voltage of an electrode, scales at a 1:100 ratio, and sends the signal to the computer. A 16-bit data acquisition card (CIO-DAS6402/16, Measurement Computing) digitizes the signals. The controlling software scans all electrodes and subtracts the voltage readings from adjacent electrodes to generate a field profile reading and compares the reading with the programmed profile. Digital control signals are converted to analog signals in a digital-to-analog conversion (DAC) board and then fed into the control section of an individual unit where the voltages of all electrodes are adjusted to match the programmed profile.
2.5 Peak elution procedures
Several elution strategies are possible. These include, but are not limited to, increasing the flow rate through the separation channel, shallowing of the electric field gradient by decreasing the upper end voltage, and decreasing the magnitude of the electric field while maintaining the slope of the electric field gradient. Elution by increasing the flow rate causes focused bands to migrate towards the exit of the separation channel since the hydrodynamic force overpowers the electrophoretic force. The flow rate can be gradually increased to elute individual species. In practice, this method suffers from increased dispersion due to the increases in the hydrodynamic flow rate [30].
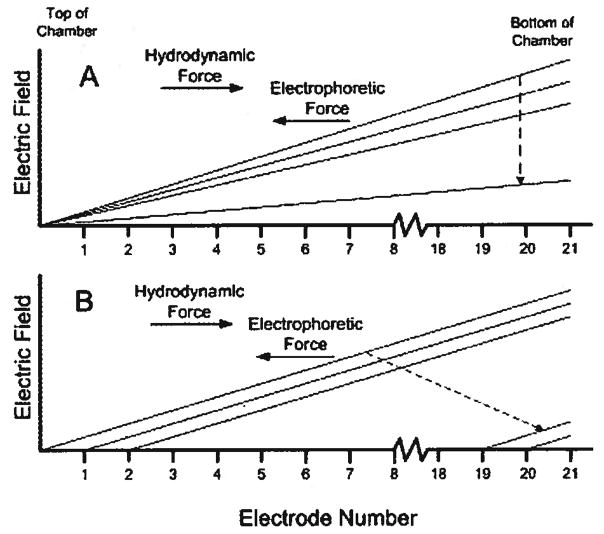
Figure 3A shows elution by shallowing the electric field gradient, also known as voltage-controlled elution [30]. By decreasing the magnitude of the electrophoretic force, the equilibrium position of the focused sample will shift towards the exit of the separation channel. The electric field can be continuously or sequentially dropped such that individual species move out of the column. Elution using this technique will give increased resolution due to the shallowing of the electric field gradient, but will also cause an increase in the width of the focused bands. This elution strategy was shown to be superior to flow-controlled elution by Lin et al. [30].
Figure 3.
Schematic illustrating different elution strategies. (A) Elution by shallowing the electric field gradient. (B) Elution while maintaining slope of the electric field gradient.
Figure 3B illustrates elution by decreasing the magnitude of the electric field while maintaining the slope of the electric field gradient. Again, the electric field is dropped so that focused bands migrate to new positions closer to the exit of the channel. In this case, however, the slope of the electric field gradient is maintained. This is accomplished by “turning off” electrodes sequentially down the column and adjusting the high end voltage to maintain the electric field gradient. This strategy does not offer any advantages in terms of peak resolution, but also does not suffer from increased band width.
3 Theory
The shape of the electric field profile has a large impact on the performance of the DFGF system. Distortion of the electric field or lower than expected field strengths can dramatically affect the resolution and peak capacity of the system. It is crucial to determine the actual voltage profile and the shape of the electric field within the DFGF apparatus and to examine any deviations between the applied and the measured electric field. The use of simulations allows us to examine the impact that the design of the DFGF device has on the electric field profile and its impact on the performance of the system.
3.1 Nonlinear numerical simulation
A full numerical simulation was developed using Comsol Multiphysics v3.3.
Under an applied external electric field, the flux of each species, Ni, can be described by [31]
| (1) |
where zi is the charge, ui is the absolute mobility, F is Faraday’s constant, ci is the concentration of each species i, φ is the electric potential, Di is the diffusion coefficient, and v is the hydrodynamic velocity vector. The absolute mobility is related to the electrophoretic mobility, ωi by
| (2) |
The mass conservation law for each species can be expressed as follows:
| (3) |
Here Ri is the production rate of each species i. The diffusion coefficient for each species is related to the absolute mobility using the Nernst–Einstein equation
| (4) |
where R is the universal gas constant and T is the absolute temperature.
Equation (1) is used to describe the transport of all of the dissolved analytes except for one; the remaining specie is calculated using the electroneutrality constraint
| (5) |
Electroneutrality is conserved in all solutions except in the thin double layer that forms near surfaces [31]. The separation channel of the experimental DFGF apparatus is several orders of magnitude greater than the thickness of the double layer so the assumption of electroneutrality is expected to hold. In Comsol’s Nernst–Planck physics, the equation for conservation of electric charge is used as the electroneutrality constraint to replace the mass conservation equation for one of the species
| (6) |
where i is the total current density defined as
| (7) |
The convective velocity field, v, can be found by solving Brinkman’s equation for flow through a porous media in combination with the continuity equation
| (8) |
| (9) |
where ρ is the fluid density, η is the dynamic viscosity, p is the pressure, and k denotes the permeability of the porous structure.
3.2 Numerical model setup and assumptions
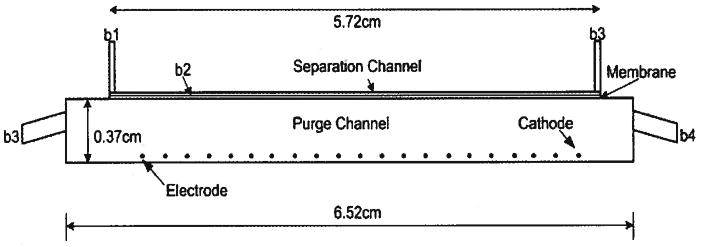
The Nernst–Planck and Brinkman application modes built into Comsol v3.3 were employed to perform the DFGF simulations. The DFGF apparatus consists of three regions: the packed separation channel, the dialysis membrane, and the purge channel (Fig. 4). The packed separation channel and the dialysis membrane are described by flow through a porous medium, whereas, the purge channel is free flow. Brinkman’s equation, rather than Darcy’s equation, was chosen to describe the flow through the porous media because in practice it is difficult to apply Darcy’s law near the interface of a porous media and a viscous fluid. The difficulty comes from a discontinuity in the stresses that arise from coupling the second-order Navier–Stokes, which describes free flow, to the first-order Darcy equation [32]. In addition, Brinkman’s equation can be used to describe both free flow and flow through the porous medium. This allows for a single application to be solved over all subdomains, greatly reducing the complexity of the simulation and the resulting computational requirements. Setting a large permeability in the purge channel (see Table 1 for a list of parameters used) decreases the contribution from the viscous term and consequently reduces the Brinkman equation to a form of the Navier–Stokes [33].
Figure 4.
Schematic of domain solved using Comsol v3.3. The chamber consists of three sub-domains: separation channel, membrane, and purge channel. The separation channel and the membrane are both 200 μm thick. The electrodes are 200 μm in diameter and have a 0.254 cm pitch. There are 21 electrodes with 20 anodes and the last being the cathode or ground.
Table 1.
List of simulation parameters
| Species parameters | Protein |
Tris |
Acetates |
|||||
|---|---|---|---|---|---|---|---|---|
| P1 | P2 | Tris+ | Tris | CH3CO2− | CH3CO2H | H+ | OH− | |
| Diffusion coefficient × 10−11 m2/s (Di) | 5.0 | 5.0 | 66.7 | 66.7 | 108.9 | 108.9 | 527.0 | 527.0 |
| Charge (zi) | −6.5 | −4.5 | 1 | 0 | −1 | 0 | 1 | −1 |
| Absolute mobility × 10−14 m2/Vs (ui) | 2.0 | 2.0 | 26.9 | 0 | 43.9 | 0 | 375 | 213 |
| Electrophoretic mobility × 10−8 m2/Vs (ωi) | 1.3 | 0.9 | 2.6 | 0 | 4.2 | 0 | 36.2 | 20.6 |
| Initial concentration mM | 8.3e-4 | 1.9e-3 | 4.8 | 15.2 | 4.8 | 6.9e-4 | 2.5e-6 | 3.9e-3 |
| Subdomain parameters | Value |
|---|---|
| Membrane permeability (kmem) | 1e-20 m2 |
| Separation channel permeability (kchannel) | 5e-14 m2 |
| Purge channel permeability (kpurge) | 1.0 m2 |
| kr,Tirs | 2e-6 |
| kf,Tris | 15.9 |
| kr,Ac | 2e-6 |
| kf,Ac | 3.5e4 |
| kr,w | 1.8e-6 |
| kt,W | 5.9e-12 |
| Dynamic viscosity (η) | 10−3 Pa·s |
| Fluid density (ρ) | 1000 kg/m3 |
| Temperature (T) | 279 K |
By specifying the permeability in each subdomain, we are able to describe either porous or free flow. The inlet velocity in the upper subdomain is set to 5.5 × 10⁻⁵ m/s at the boundary b1 (Fig. 4) with the outlet, b3, equal to zero pressure. In the lower subdomain, the inlet fluid velocity is set to 0.02 m/s at b4 with the outlet velocity set to zero pressure at boundary b5. The internal boundaries are given continuity conditions. All other boundaries, including the electrodes, are set to no-slip.
In order to more accurately describe the DFGF system, the buffering reactions must be included in the simulation. As a first approximation, reactions were considered for the supporting electrolyte, Tris-acetate pH 8.6, but not for the proteins. To include buffering in the model, the following ionic relationships are taken into account
| (10) |
| (11) |
| (12) |
where we assume that H3O+ is equivalent to H+. The corresponding equilibrium expressions for the ionic concentrations are
| (13) |
| (14) |
| (15) |
where KW = [H+][OH−] and kf and kr denote the forward and reverse rate constants, respectively. For this simulation, fast, finite kinetics were used. The reverse rate constant for each reaction was specified with the forward rate constant calculated using Eqs. (13–15). The magnitude of the reverse rate constant was determined based on the ability of the system to maintain equilibrium. Reverse reaction rates that are too large can lead to numerical instabilities in the solution [34], As a result, the reaction rates were increased to the point at which the actual equilibrium constants divided by the simulation determined equilibrium constants were approximately equal to one.
The rate expression for each species is
| (16) |
| (17) |
| (18) |
| (19) |
| (20) |
| (21) |
Two Nernst–Planck physics were coupled, one for the separation channel (upper domain) and one for the purge channel and membrane (lower domain). The upper domain contains the two generic proteins along with the buffering ions. The membrane allows the passage of the buffering ions, but is insulating to the proteins. This restricts the proteins to the upper domain. Since the proteins are not present in the lower domain, we are forced to have a separate Nernst–Planck physics. Consequently, each of the buffering species will need two separate transport equations, one describing their behavior in the upper domain and one for the lower domain. The two Nernst–Planck physics are coupled by specifying constant concentration, flux, current, and voltage across the separation channel/membrane boundary, b2 (Fig. 4). Constant concentrations are set at the inlets, bl and b4, as well as on all electrodes, except for Tris+, which is calculated based on electroneutrality. The outlets, b3 and b5, were set to convective flux. All other boundaries were set to insulating.
The voltage was specified on each electrode based on experimental measurements. The voltage profile roughly follows
| (22) |
where Vmax is 600 V, I is equal to 6.52 cm and x is the axial distance of the electrode. The last electrode was set to ground. All other boundaries were set to electrically insulating. A more complete listing of the boundary conditions is given in Table 2.
Table 2.
Boundary and initial conditions for Nernst–Planck application mode (Comsol v3.3)
| Application | Boundarya) | Protein | Mobile ionsb) | Voltage |
|---|---|---|---|---|
| Nernst–Planck (upper) | b1 | 0 mM | Initial concentratione) | Electrical insulationf) |
| b2 | Insulationc) | Concentration of lower domain species | Voltage of lower domain | |
| b3 | Convective fluxd) | Convective fluxd) | Electrical insulationf) | |
| All others | Insulationc) | Insulationc) | Electrical insulationf) | |
| Nernst–Planck (lower) | b2 | - | Flux continuity | Current continuity |
| b4 | - | Initial concentratione) | Electrical insulationf) | |
| b5 | - | Convective fluxd) | Electrical insulationf) | |
| b6–b18 | - | Initial concentratione) | Equation (16) | |
| b19 | - | Initial concentratione) | Ground |
Listed boundaries are shown in Fig 4.
For all mobile ions except Tris+ which is calculated based on electroneutrality.
Insulation/symmetry boundary condition: −nNi = 0.
Constant concentration boundary condition. Initial concentrations for each species specified (Table 1).
Electrical insulation boundary condition: −ni = 0.
Convective flux boundary condition: Nin = civn.
Some assumptions are made for the DFGF simulation. First, any resistive effects of the dialysis membrane have been neglected. Experimental measurements have shown very little impact on the intensity or shape of the electric field due to the presence of the dialysis membrane (data not shown). This, however, would not be the situation for a membrane containing a substantial amount of surface charge. This case will be addressed in publication elsewhere. Secondly, electrode reactions and electrode surface polarization have been ignored. This assumption should be valid based on the fact that the purge channel is well flushed. Lastly, isotropic artificial diffusion was added to each species. The addition of artificial diffusion to diffusion already present in the system makes the solution of steep gradients near the membranes and electrodes possible.
Comsol defines the artificial diffusion for each species i, Dart,i, as
| (23) |
where hmesh is the local mesh diameter, σart is the artificial diffusion tuning parameter, and βi is the magnitude of the convective velocity for each species i
| (24) |
where vx, and vy are the x- and y-components of the convective velocity, respectively.
Equation (8) is then modified to include the artificial diffusion term
| (25) |
The amount of artificial diffusion that is added is not the same everywhere and is instead dependent on the mesh size and the magnitude of the convective velocity. As a result, artificial diffusion is added only where it is needed. For a σart of 0.5 this corresponds to an artificial diffusion of 10−9–10−8 m2/s for each species in the upper domain and 10−8–10−6 m2/s for the lower subdomain. The artificial diffusion is greater in the lower subdomain because the convective velocity is larger.
4 Results and discussion
4.1 Simulation
In this design, there is little impact on the electric field due to the thickness of the separation channel and the purge channel. Instead, there is a large dependence on the distance of the electrodes from the separation channel. The effect of electrode placement on the shape of the electric field is shown in Fig. 5. At large distances, the linear portion of the electric field is decreased. This has the effect of decreasing the useful length of the separation channel. For example, an electrode/separation channel distance of 20 mm gives a useable length of only 3 cm of the separation channel. Also, the slope of the electric field is shallower than would be expected based on the applied voltage profile. Shallower fields increase both the resolution and the peak width of the focused species. In some cases, the use of shallow fields can increase the baseline separation of two closely focused analytes. However, in this case the effect is deleterious to the performance of the system.
Figure 5.
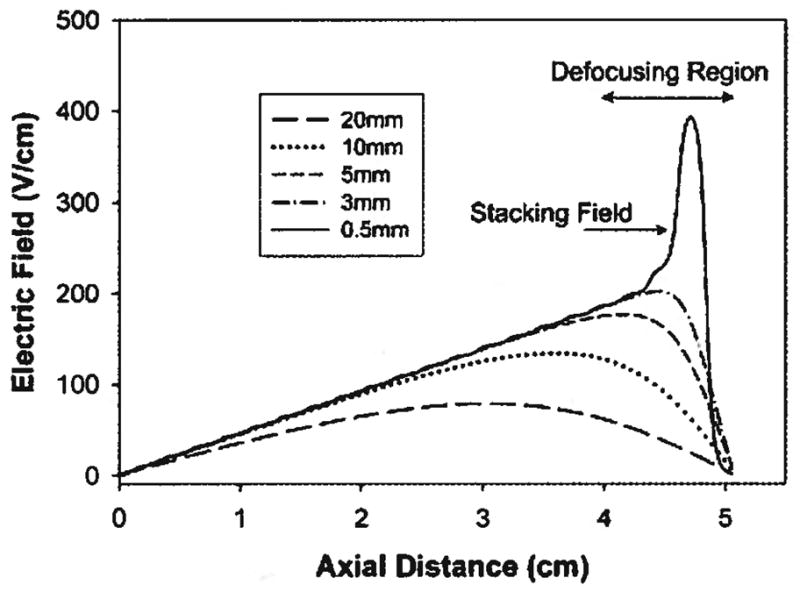
Simulation showing the effect of electrode placement on the shape of the electric field profile. The curves represent the distance of the electrodes from the separation channel. At large distance (>10 mm), the field becomes shallowed and the usable, linear section of the electric field becomes smaller. At small distances (<1 mm), a large spike at the cathodic end appears. This is due to the close proximity of the cathode to the separation channel. An optimal distance of 3 mm is found which gives the largest linear portion of the field with the least amount of distortion.
At electrode/separation channel distances that are too close, a distortion in the field near the cathode appears. This spike in the electric field is caused by the close proximity of the separation channel to the cathode. The sudden increase in the electric field becomes problematic during elution because it will act to stack the proteins. As the protein peaks are mobilized towards the outlet, they will encounter a large electric field that restricts their migration out of the separation channel. As the field is continually decreased during the elution procedure, other focused bands will become trapped near the outlet. Bands that had previously been resolved may instead overlap. Other groups [35, 36] have used steep changes in electric fields for preconcentration, but in our case the result is ruinous and will lead to apparent peak resolutions less than actually achieved within the DFGF system. Figure 5 shows that as the electrode to separation channel distances become increasingly smaller, the magnitude of the stacking region becomes greater. At distances less than about 1 mm, the field becomes “wavy” due to the close proximity of the discrete electrodes. This phenomenon is problematic because it limits the peak capacity of the system to the number of electrodes. At distances greater than 1 mm the field becomes “smoothed.” In this case, the peak capacity is not dependent on the number of electrodes.
Using the simulation, an optimum electrode placement of 3 mm from the separation channel was found. At this distance, 80–90% of the channel is usable with no indication of a field spike or distortions in the field from the individual electrodes.
A further phenomenon worth discussing at this point is the development of a defocusing region in the electric field near the cathodic end of the separation channel. The electrode array consists of 20 anodes and 1 cathode set to ground. All current entering the system via the anodes must exit at the cathode. This results in an inflection in the electric field. The defocusing region becomes problematic when detection of analytes is accomplished by elution out the bottom of the separation channel. As peaks migrate past this point, the electric field is no longer acting to restore band dispersion, but instead is acting to push the species out of the system. This leads to peak broadening and a subsequent decrease in the resolution and performance of the system. Figure 5 illustrates that the magnitude of the defocusing region is dependant on the placement of the electrodes with respect to the separation channel. However, even at the optimal distance of 3 mm, the defocusing region still comprises 10–20% of the separation channel.
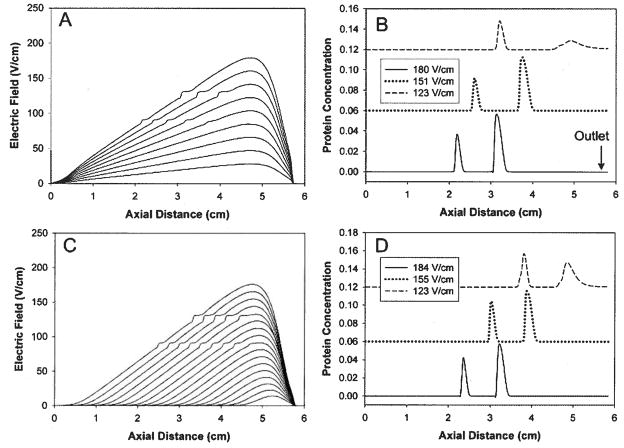
A numerical simulation is used to illustrate the impact that the defocusing region has on DFGF performance. Two generic proteins are eluted using the strategies described in Fig. 3. Figure 6A shows the electric field profiles that result from decreasing the high end electric field from 180 V/cm down to 123 V/cm (voltage-controlled elution). At 180 V/cm the two protein peaks are well-shaped with good resolution (Fig. 6B). As the proteins are moved towards the outlet, the peaks become broader with a slight increase in the resolution. At 123 V/cm, the peaks migrate past the defocusing region and become severely dispersed, resulting in a dramatic decrease in the concentration factor of the focused band.
Figure 6.
Numerical simulation showing the impact of the defocusing region on the elution of virtual proteins using two different elution strategies. (A) Electric field profile for voltage-controlled elution. (B) Protein peak profiles at different electric fields under voltage-controlled elution. (C) Electric field profile for elution under a constant electric field gradient. (D) Protein peaks at different electric fields eluting under a constant electric field gradient.
One of the main advantages of DFGF is the ability to dynamically control the shape of the electric field. This allows for elution under a constant electric field gradient, an ability that is not possible in other EFGF devices. Figure 6C shows the electric field profiles that result from elution under constant electric field gradient. As the proteins are eluted, the peaks maintain their shape and resolution. The distortions in the electric field indicate the position of the protein peaks. It can be seen that proteins “track” at the same position in the electric field throughout the duration of the elution. At the mid-point, the peaks are still well-shaped and maintain the same resolution (Fig. 6D). The defocusing region again causes a substantial amount of dispersion near the outlet; however, this result is not nearly as problematic as it is with voltage-controlled elution. This illustrates the ad-vantage of using constant electric field gradient elution but also points to the issue of the defocusing region.
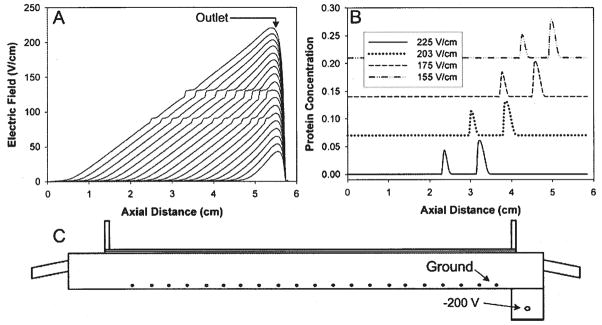
To solve this problem, an off-take port can be inserted prior to the defocusing region. The main disadvantage of using this approach is that it decreases the peak capacity of the system. Slower species that would normally focus near the outlet of the separation channel will be lost through the off-take port. Instead, the numerical simulation can be used to test design modifications that act to reduce the defocusing region. The approach used by our group was to include an additional electrode of negative potential (Fig. 7A) to extend the linear portion of the electric field. For this simulation, a trial-and-error method was used to determine the voltage that gave the most favorable electric field profile. For a distance of 0.3 cm from the ground electrode, the potential should be −200 V. Figure 7B shows the simulation results. In this case, the affect of the defocusing region is minimized. Though the defocusing region is not completely eliminated, the advantage of adding the negative potential electrode can be seen in the elution profiles of the proteins (Fig. 7C). Here the peaks maintain both their shape and resolution during elution.
Figure 7.
Use of a −200 V electrode to eliminate the defocusing region. (A) Electric field profiles for elution under constant electric field gradient with the −200 V electrode. This design almost completely removes the defocusing region. (B) Eluted protein peaks for redesigned system. There is no peak dispersion or loss of resolution. (C) Domain solved for using the 2-D nonlinear numerical simulation. A −200 V electrode is placed 0.3 cm from the ground electrode.
Distortions in the electric field due to the presence of the proteins introduce an additional issue that should be discussed. The concentrated protein peaks cause an increase in the conductivity which leads to a decrease in the local electric field. As the concentration of the focused band increases and the conductivity becomes greater than that of the supporting buffer, the localized field becomes distorted. This was first recognized by Koegler and Ivory [16] and was believed to act as a “sink” for species with similar electrophoretic mobilities. As the concentration of the focused band increases, the conductivity increases and causes the field to flatten. As the conductivity increases further, the distorted field region becomes larger and can pull other closely focused species into the flattened region. The result closely resembles ITP, in which proteins form adjacent, nonoverlapping bands. This result is not necessarily deleterious and could in some instances be exploited. For example, an ITP or stacking zone could be formed near the inlet of the separation channel. This would allow for concentration, possibly through multiple sample injections, preceding resolution in the remaining section of the separation channel. This would be a useful strategy for looking at low abundance species that need significant concentration prior to detection.
4.2 Validation of the numerical simulation
4.2.1 Electric field profile
The numerical simulation will be used to obtain qualitative information on the behavior of the system and to test design changes for the elimination of performance bottlenecks. To initially validate the numerical simulation, the electric field determined by the model was compared to the field measured experimentally. Voltage measurements were taken in the separation channel using the apparatus shown in Fig. 2B and the corresponding x-component of the electric field was calculated. Five data sets were collected and 95% confidence intervals were determined. The results are shown in Fig. 8.
Figure 8.
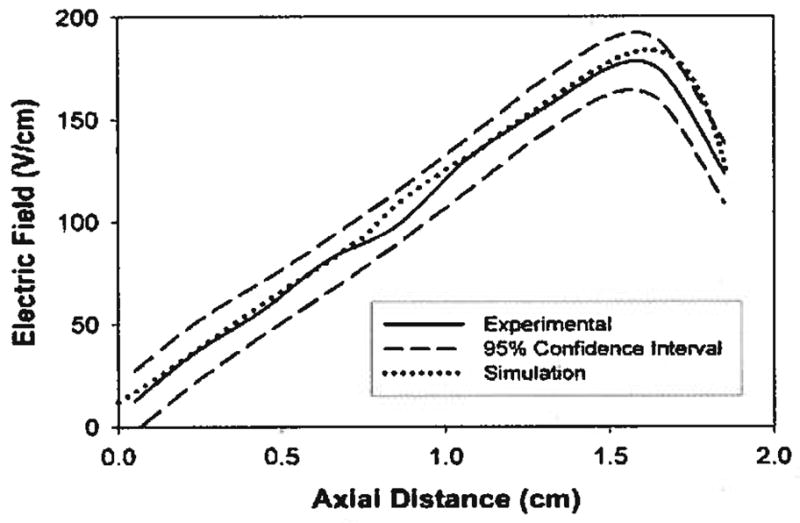
Comparison of experimentally measured electric field profile to numerical simulation. The simulation matches very closely over most of the separation channel. A small deviation occurs after 1.5 cm. This is most likely due to the low resolution voltage measurement technique used.
Over most of the separation channel there is good agreement between the experimental data and the simulation. Near the cathode, however, the simulation predicts a larger electric field than was found experimentally. The most likely reason for the discrepancy is that our ability to make accurate voltage measurements is limited by the number of data points that we can collect. Our detection system allows for eleven voltage measurements to be taken every 0.508 cm. For sections of the separation channel in which the electric field is linear, this detection resolution is sufficient. However, near the cathode, our measurements lack the ability to accurately detect the rapidly changing electric field profile. Other possible explanations for the difference between the simulation and the experimental data, such as electrode reactions, charges on the membrane, and depletion/enrichment of buffer salts, lie beyond the scope of this paper and will instead be discussed in a later publication.
4.2.2 Elution of focused peaks
Elution experiments were performed to further confirm the numerical simulation and to illustrate the advantage of constant electric field gradient elution over voltage-controlled elution. Two proteins, PE and APC, were allowed to focus in the separation channel for 60 min and were then eluted using either voltage-controlled elution or elution under a constant electric field gradient. Representative electropherograms are shown in Fig. 9. These results agree qualitatively with the results of the numerical simulation shown in the previous section. Elution under constant electric field gradient yielded more highly concentrated peaks as compared to voltage-controlled elution while still maintaining adequate peak resolution. This was further illustrated by performing a temporal moment analysis on the eluted peaks.
Figure 9.
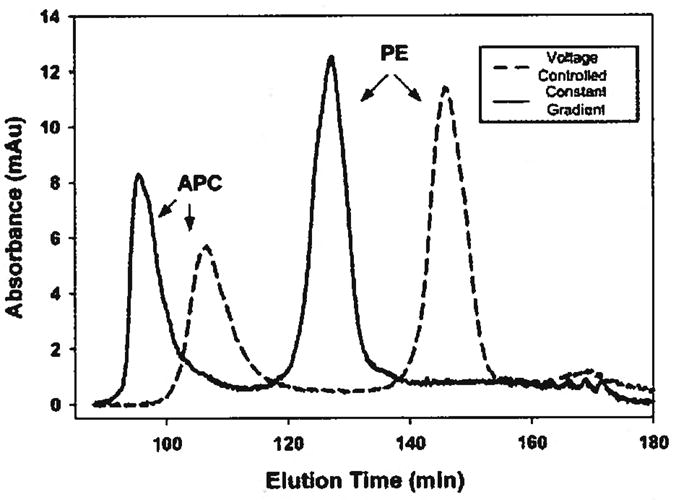
Experimentally eluted protein peaks. Elution under constant electric field gradient gives higher concentration, lower variance peaks.
The nth absolute moment, mn, can be calculated from [37]
| (26) |
where c(t) is the concentration as a function of time, t. The zeroth moment gives the total mass based on
| (27) |
The first absolute moment, m1, normalized to the total mass gives the retention time of the mean of the peak, tm
| (28) |
and the variance of the peak, σ2, can then be calculated using
| (29) |
where m2 is the second absolute moment. The results of the moment analysis are shown in Table 3.
Table 3.
Results of moment analysis of experimental data
| Elution strategies | APC |
PE |
|||||||
|---|---|---|---|---|---|---|---|---|---|
| Mass balance (m0) | Elution time (tm), min | Variance (σ2) | Peak height, mAU | Mass balance (m0) | Elution time (tm), min | Variance (σ2) | Peak height, mAU | Resolution | |
| Voltage-controlled elutiona) | 26.2 ± 1.8 | 106.0 ± 4.9 | 28.3 ± 4.0 | 5.2 ± 1.1 | 51.0 ± 5.7 | 146.2 ± 1.4 | 21.5 ± 7.3 | 12.4 ± 0.8 | 2.0 ± 0.2 |
| Elution under constant electric field gradientb) | 28.3 ± 2.4 | 101.7 ± 3.6 | 22.4 ± 6.8 | 7.3 ± 1.6 | 49.0 ± 3.4 | 129.1 ± 2.4 | 17.5 ± 3.8 | 12.0 ± 0.7 | 1.6 ± 0.2 |
Results taken as average of four consecutive experimental runs.
Results taken as average of six consecutive experimental runs.
The use of elution under constant electric field gradient gave a 20% reduction in the peak variance,σ2, with an almost 30% increase in peak height for APC. A similar result is seen for the PE peak variance. However, no statistical difference in the peak height between the two elution strategies is observed.
One possible advantage of voltage-controlled elution is seen by the increased peak resolution that accompanies the flattened electric field gradient. In many instances use of voltage-controlled elution may serve as a preferred method to separate two closely focused species. In general, however, we feel that the use of elution under constant electric field gradient is a better strategy for most separation experiments due to the higher concentration factors that are obtained and the fact that the peaks maintain their shape through the duration of the elution protocol.
4.2.3 Minimizing the affect of the defocusing region
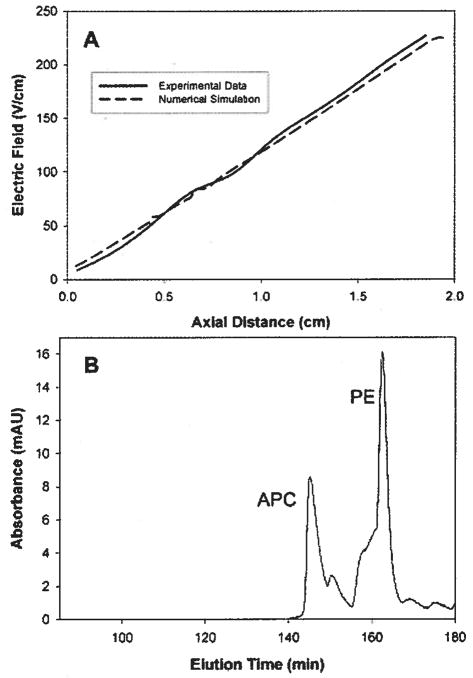
To illustrate the advantage of removing the defocusing region, the device redesign suggested in Section 4.1 was built and tested. The voltage in the separation channel was measured experimentally and the corresponding electric field profile was calculated from these voltages. Figure 10a shows that by applying −200 V to the additional electrode, as suggested by the numerical simulation, that the defocusing region can be almost entirely removed from the separation channel. Comparison of the experimentally determined electric field and the numerical simulation shows very good agreement.
Figure 10.
(A) Comparison of experimentally measured electric field with −200 V electrode to numerical simulation. The simulation shows good agreement with the experimentally measured electric field. The presence of the −200 V electrode almost completely removes the defocusing region from the separation channel. (B) Preliminary result for the elution of PE and APC for the redesigned DFGF apparatus containing the additional −200 V electrode.
A preliminary focusing result for the elution of APC and PE under constant electric field gradient with the additional −200 V electrode is shown in Fig. 10b. Both the APC and PE are more highly concentrated with smaller peak variances as compared to the case without the −200 V electrode. This agrees qualitatively with the numerical simulation finding that removing the defocusing region should result in better performance of the DFGF system.
Though this preliminary result is encouraging, there are a few issues that still need to be addressed, (i) The two peaks are slightly distorted. We attribute this to problems associated with the elution protocol. If the potential of the additional electrode is not precisely monitored and adjusted to maintain the linear electric field gradient, a stacking field could form at the outlet, not too dissimilar from the stacking field seen in Fig. 5. If during elution peaks are stacked at the outlet, changes in the field that occur during the elution protocol could lead to portions of the band being eluted while the rest remains in the separation channel. This will lead to an electropherogram containing “false” peaks and peaks with “shoulders.” (ii) Problems with reproducibility. The result shown in Fig. 10b is not reproducible. Again, this can be attributed to problems with optimization of the elution protocol. Our hope is that we can use the numerical simulation to estimate the potential required on the additional electrode during each step of the elution protocol to ensure that neither a defocusing nor stacking region forms. This will allow us to completely automate the system and obtain better reproducibility.
5 Concluding remarks
The development of a 2-D nonlinear numerical simulation provided a convenient method for determining design constraints that eliminated voltage degradation and electric field distortions from a DFGF device. It was found that the placement of the electrodes in relation to the separation channel had a large impact on the shape and magnitude of the electric field gradient. At distances too close, the field became distorted and a stacking region formed near the outlet. At increasingly larger distances, the defocusing region becomes substantial and the usable length of the separation channel is decreased. An optimal distance was found to be 3 mm.
The simulation was then used to illustrate the impact of the defocusing region on the elution of protein peaks. Two different elution strategies were examined: voltage-controlled elution and elution under constant electric field gradient. Of the EFGF techniques that have been developed, only DFGF has the ability to elute under a constant electric field gradient. This strategy gave better results as compared to voltage-controlled elution, but still suffered from dispersion at the defocusing region. To minimize the affect of the defocusing region, a −200 V electrode was added to the DFGF device. The numerical simulation showed that peaks eluted in this apparatus maintained both their shape and resolution. Comparison of the numerical simulation to experimental results showed good qualitative agreement in both the shape of the electric field and in the elution of focused peaks. More importantly, the development of the numerical simulation will allow us to investigate other performance bottlenecks such as membrane stability, protein polarization, and depletion/enrichment of buffer components.
Acknowledgments
The authors would like to thank Dr. Zheng Huang, Protasis, for his contribution to the controller design and help with the DFGF system setup.
Abbreviations
- APC
allophycocyanin
- DFGF
dynamic field gradient focusing
- EFGF
electric field gradient focusing
- EGM
equilibrium gradient method
- PE
R-phycoerythrin
Footnotes
The authors have declared no conflict of interest.
References
- 1.Babu S, Song EJ, Babar SME, Wi MH, Yoo YS. Electrophoresis. 2006;27:97–110. doi: 10.1002/elps.200500511. [DOI] [PubMed] [Google Scholar]
- 2.Corthals GL, Wasinger VC, Hochstrasser DF, Sanchez JC. Electrophoresis. 2000;21:1104–1115. doi: 10.1002/(SICI)1522-2683(20000401)21:6<1104::AID-ELPS1104>3.0.CO;2-C. [DOI] [PubMed] [Google Scholar]
- 3.Garbis S, Lubec G, Fountoulakis M. J Chromatogr A. 2005;1077:1–18. doi: 10.1016/j.chroma.2005.04.059. [DOI] [PubMed] [Google Scholar]
- 4.Mondello L, Lewis AC, Bartle KD, editors. Multidimensional Chromatography. John Wiley & Sons Ltd; West Sussex: 2002. [Google Scholar]
- 5.O’Farrell PH. J Biol Chem. 1975;250:4007–4021. [PMC free article] [PubMed] [Google Scholar]
- 6.Bradshaw RA, Burlingame AL. IUBMB Life. 2005;57:267–272. doi: 10.1080/15216540500091536. [DOI] [PubMed] [Google Scholar]
- 7.Fey SJ, Larsen PM. Curr Opin Chem Biol. 2001;5:26–33. doi: 10.1016/s1367-5931(00)00167-8. [DOI] [PubMed] [Google Scholar]
- 8.Wang H, Hanash S. J Chromatogr B. 2003;787:11–18. doi: 10.1016/s1570-0232(02)00335-5. [DOI] [PubMed] [Google Scholar]
- 9.Giddings JC, Dahlgren K. Sep Sci. 1971;6:345–356. [Google Scholar]
- 10.Tolley HD, Wang QG, LeFebre DA, Lee ML. Anal Chem. 2002;74:4456–4463. doi: 10.1021/ac020027w. [DOI] [PubMed] [Google Scholar]
- 11.Wang QG, Tolley HD, LeFebre DA, Lee ML. Anal Bioanal Chem. 2002;373:125–135. doi: 10.1007/s00216-002-1286-y. [DOI] [PubMed] [Google Scholar]
- 12.Meselson M, Stahl FW, Vinograd J. Proc Natl Acad Sci USA. 1957;43:581–588. doi: 10.1073/pnas.43.7.581. [DOI] [PMC free article] [PubMed] [Google Scholar]
- 13.O’Farrell PH. Science. 1985;227:1586–1589. doi: 10.1126/science.227.4694.1586. [DOI] [PMC free article] [PubMed] [Google Scholar]
- 14.Ivory CF, Gobie WA. Biotechnol Prog. 1990;6:21–32. doi: 10.1002/btpr.5420010112. [DOI] [PubMed] [Google Scholar]
- 15.Ivory CF. Sep Sci Technol. 2000;35:1777–1793. [Google Scholar]
- 16.Koegler WS, Ivory CF. Biotechnol Prog. 1996;12:822–836. [Google Scholar]
- 17.Koegler WS, Ivory CF. J Chromatogr A. 1996;726:229–236. [Google Scholar]
- 18.Kelly RT, Woolley AT. J Sep Sci. 2005;28:1985–1993. doi: 10.1002/jssc.200500228. [DOI] [PubMed] [Google Scholar]
- 19.Warnick KF, Francom SJ, Humble PH, Kelly FtT, et al. Electrophoresis. 2005;26:405–414. doi: 10.1002/elps.200410319. [DOI] [PubMed] [Google Scholar]
- 20.Shackman JG, Ross D. Electrophoresis. 2007;28:556–571. doi: 10.1002/elps.200600592. [DOI] [PubMed] [Google Scholar]
- 21.Greenlee RD, Ivory CF. Biotechnol Prog. 1998;14:300–309. doi: 10.1021/bp970113v. [DOI] [PubMed] [Google Scholar]
- 22.Wang QG, Lin SL, Warnick KF, Tolley HD, Lee ML. J Chromatogr A. 2003;985:455–462. doi: 10.1016/s0021-9673(02)01399-7. [DOI] [PubMed] [Google Scholar]
- 23.Lin SL, Tolley HD, Lee ML. Chromatographia. 2005;62:277–281. [Google Scholar]
- 24.Humble PH, Kelly RT, Woolley AT, Tolley HD, Lee ML. Anal Chem. 2004;76:5641–5648. doi: 10.1021/ac040055+. [DOI] [PubMed] [Google Scholar]
- 25.Ross D, Locascio LE. Anal Chem. 2002;74:2556–2564. doi: 10.1021/ac025528w. [DOI] [PubMed] [Google Scholar]
- 26.Huang Z, Ivory CF. Anal Chem. 1999;71:1628–1632. [Google Scholar]
- 27.Myers P, Bartle KD. J Chromatogr A. 2004;1044:253–258. doi: 10.1016/j.chroma.2004.04.069. [DOI] [PubMed] [Google Scholar]
- 28.Petsev DN, Lopez GP, Ivory CF, Sibbett SS. Lab Chip. 2005;5:587–597. doi: 10.1039/b501538c. [DOI] [PubMed] [Google Scholar]
- 29.Huang Z. PhD Thesis. Washington State University; Pullman, WA: 2001. [Google Scholar]
- 30.Lin SL, Li YY, Tolley HD, Humble PH, Lee ML. J Chromatogr A. 2006;7725:254–262. doi: 10.1016/j.chroma.2006.05.041. [DOI] [PubMed] [Google Scholar]
- 31.Newman J, Thomas-Alyea KE. Electrochemical Systems. John Wiley & Sons, Inc; Hoboken, NJ: 2004. [Google Scholar]
- 32.Deng C, Martinez DM. Chem Eng Sci. 2005;60:329–336. [Google Scholar]
- 33.Nield DA, Bejan A. Convection in Porous Media. Springer-Verlag, Inc; New York: 1999. [Google Scholar]
- 34.Humble PH, Harb JN, Tolley HD, Woolley AT, et al. J Chromatogr A. 2007;1160:311–319. doi: 10.1016/j.chroma.2007.04.013. [DOI] [PubMed] [Google Scholar]
- 35.Astorga-Wells J, Swerdlow H. Anal Chem. 2003;75:5207–5212. doi: 10.1021/ac0300892. [DOI] [PubMed] [Google Scholar]
- 36.Wang YC, Stevens AL, Han JY. Anal Chem. 2005;77:4293–4299. doi: 10.1021/ac050321z. [DOI] [PubMed] [Google Scholar]
- 37.Brown PR, Hartwick RA, editors. High Performance Liquid Chromatography. John Wiley & Sons, Ltd; New York: 1989. [Google Scholar]


