

Abstract
Allelic imbalance (AI) is a powerful tool to identify cis-regulatory variation for gene expression. UGT2B15 is an important enzyme involved in the metabolism of multiple endobiotics and xenobiotics. In this study, we measured the relative expression of two alleles at this gene by using SNP rs1902023:G>T. An excess of the G over the T allele was consistently observed in liver (P<0.001), but not in breast (P=0.06) samples, suggesting that SNPs in strong linkage disequilibrium with G253T regulate UGT2B15 expression in liver. Seven such SNPs were identified by resequencing the promoter and exon 1, which define two distinct haplotypes. Reporter gene assays confirmed that one haplotype displayed ~20% higher promoter activity compared to the other major haplotype in liver HepG2 (P<0.001), but not in breast MCF-7 (P=0.540) cells. Reporter gene assays with additional constructs pointed to rs34010522:G>T and rs35513228:C>T as the cis-regulatory variants; both SNPs were also evaluated in LNCaP and Caco-2 cells. By ChIP, we showed that the transcription factor Nrf2 binds to the region spanning rs34010522:G>T in all four cell lines. Our results provide a good example for how AI can be used to identify cis-regulatory variation and gain insights into the tissue specific regulation of gene expression.
Keywords: UGT2B15, allelic imbalance, AI, cis-regulation, tissue-specific, expression
Introduction
One of the most important goals of genetics is to identify heritable variation in (cis-) regulatory elements for gene expression, especially those that influence common diseases and other clinical phenotypes. To achieve this, numerous association studies between genotype and gene expression levels have been performed in multiple tissues, even on a genome-wide scale [Cheung, et al., 2003; Duan, et al., 2008; Kristensen, et al., 2006; Rockman and Kruglyak, 2006; Schadt, et al., 2008; Stranger, et al., 2007]. If all other effects are uniform across individuals, this approach is expected to be powerful, especially if adequate sample sizes are used. However, due to a variety of factors, including variations in the relevant transcription factors as well as environmental and physiological effects, the power and sensitivity of this approach could be significantly affected. Allelic imbalance (AI, or differential allelic expression, DAE), has been proposed as a powerful and robust complementary approach [Bray and O’Donovan, 2006; Milani, et al., 2007; Pastinen and Hudson, 2004; Stamatoyannopoulos, 2004; Wang and Elbein, 2007; Yan, et al., 2002; Yan and Zhou, 2004]. The rationale behind it is that trans-acting regulatory elements and environmental factors influence gene expression from both chromosomes while cis-regulatory elements affect gene expression in an allele-specific manner [Pastinen and Hudson, 2004; Stamatoyannopoulos, 2004]. Since expression levels from each of the two alleles can be directly compared within the same heterozygous individual and within the same experiment, variation in trans-regulatory elements and in environmental, physiological and experimental effects is not expected to affect the ratio between the two alleles. Therefore, if AI is observed between the two alleles of a coding SNP (and if genomic imprinting can be ruled out [Tycko and Morison, 2002]), cis-regulatory variation co-segregating with the marker (or the marker itself) is likely to exist. This approach was recently extended to the genome-wide scale, leading to the finding that ~20–54% of human genes showed AI [Lo, et al., 2003; Pant, et al., 2006; Serre, et al., 2008].
Multiple approaches have been used to detect AI, including SNaPShot [Bray, et al., 2003a; Bray, et al., 2003b; Fukuda, et al., 2006; He, et al., 2005; Johnson, et al., 2008; Liu, et al., 2005; Valle, et al., 2008; Wilkins, et al., 2007; Zhang, et al., 2005], sequencing [Fukuda, et al., 2006; Tuupanen, et al., 2008], pyro-sequencing [Loeuillet, et al., 2007; Mahr, et al., 2006; Wang and Elbein, 2007], iPLEX [Ding, et al., 2004], RNA difference plot [Murakami, et al., 2004], band intensity in gel [Heighway, et al., 2005; Hirota, et al., 2004] and other technologies [Jordheim, et al., 2008; Ware, et al., 2006]. However, since all these methods are end-point readings of PCR, they may not be accurate in quantifying the ratio between the alleles. Microarrays can provide a parallel reading for multiple genes or even on a genome scale with or without amplification [Cheung, et al., 2008; Lo, et al., 2003; Milani, et al., 2007; Pant, et al., 2006; Serre, et al., 2008]. However, the current array technologies may not be sensitive enough to detect all AI accurately, especially if the differences between the two alleles are small to moderate. Real time PCR using Taqman probes to distinguish the two alleles can provide a higher sensitivity [Chen, et al., 2008; Udler, et al., 2007].
In this study, we use AI to identify cis-regulatory variation for the UGT2B15 gene, which codes for a UDP-glucuronosyltransferase (UGT) enzyme. Glucuronidation is an important clearance pathway for numerous endobiotics and xenobiotics, including steroid hormones, bile acid, carcinogens and clinical drugs [Guillemette, 2003; King, et al., 2000; Mackenzie, et al., 2005; Tukey and Strassburg, 2000]. Among the UGT enzymes, UGT2B15 [Chen, et al., 1993; Turgeon, et al., 2000; MIM# 600069] is of particular significance due to its relatively high expression level [Ohno and Nakajin, 2009] and activity [Turgeon, et al., 2001]. The gene coding for this enzyme is mainly expressed in liver, breast, prostate, and colon [Gardner-Stephen and Mackenzie, 2008; Levesque, et al., 1997; Nakamura, et al., 2008b; Ohno and Nakajin, 2009]. In the first exon of this gene, a SNP rs1902023:G>T (at 253 relative to translation start), which causes an amino acid substitution D85Y [Levesque, et al., 1997], has been identified to be common in Caucasian and Asian populations [Iida, et al., 2002; Lampe, et al., 2000] and used to characterize two major haplotypes, UGT2B15*1 and *2 [Levesque, et al., 1997]. The D allele was shown to have similar substrate specificity, but half the enzyme activity compared to the Y allele [Levesque, et al., 1997], and has been proposed to correlate with oxazepam glucuronidation [Court, et al., 2004], male fat mass [Swanson, et al., 2007], and breast [Sparks, et al., 2004] and prostate cancer risk [Hajdinjak and Zagradisnik, 2004; MacLeod, et al., 2000; Park, et al., 2004], although some of these associations could not be replicated [Gsur, et al., 2002; Wegman, et al., 2007]. However, the allele specific expression levels of this gene have never been examined.
In the present study, we found a relative excess of the G allele at the coding variant rs1902023:G>T in liver but not in breast samples, which suggested the presence of cis-regulatory variation in linkage disequilibrium (LD) with this SNP. Re-sequencing of the UGT2B15 exon 1 and promoter regions identified 7 SNPs in near-perfect LD with rs1902023:G>T. By comparing different haplotypes in reporter gene promoter assays, we identified two SNPs that affect gene expression. One of these SNPs was also found to lie within a nuclear factor erythroid derived 2-like 2 (Nrf2) binding site based on a chromatin immunoprecipitation assay. Our results represent an example of how AI may lead to the discovery of new regulatory elements and provide insights into the tissue specific regulation of UGT2B15 expression.
Materials and Methods
Tissue samples, RNA and DNA isolation, and genotyping
Thirty-one normal liver (3 European American [CA] and 1 African American [AA], 27 unknown) and 81 normal breast (4 CA and 8 AA, 69 unknown) tissue samples were obtained from the University of Chicago Tissue Core Facility; none of the liver and breast samples were from the same individual. RNA and DNA were isolated by RNeasy Lipid Tissue and QIAamp DNA Mini Kit (Qiagen, USA), respectively. cDNA was synthesized by High Capacity Reverse Transcription Kit (Applied biosystems, USA).
rs1902023:G>T genotype was determined by a Taqman assay C_27028164_10 (Applied Biosystems) according to the manufacturer’s protocol. Among all tissues, 15 liver and 49 breast samples were heterozygous for rs1902023:G>T and were included in the AI analysis. Among these samples, 7 and 2 were from male in liver and breast, respectively.
Genotype of UGT2B17 copy number variation (CNV) was determined by the ratio between UGT2B17 and peripheral myelin protein 22 (PMP22), a gene that encodes a membrane protein in nervous system and does not show CNV. In detail, UGT2B17 was quantified by real time PCR with Power SYBR Green (Applied Biosystems) and primer pair 5′-AAAACAGGAAAGAAGAAGAAAAGGG-3′ and 5′-AAAGGAGGAGTCCCATCTTTTG-3′. The primer pair for PMP22 was 5′-CCCTTCTCAGCGGTGTCATC-3′ and 5′-ACAGACCGTCTGGGCGC-3′. For each sample, around 10 ng genomic DNA (gDNA) was used per reaction. For normalization, one DNA sample without UGT2B17 deletion was serially diluted of 60, 30, 15, 7.5, 3.75, 1.88, 0.94 ng per reaction and used in both genes. Three HapMap samples representing three different genotypes [McCarroll, et al., 2006] were included as positive controls. All real time PCR and Taqman genotype reading in this study was performed on a StepOne Plus Realtime PCR System (Applied Biosystems)
Allelic imbalance
Allele specific expression was performed in cDNA from heterozygous individuals using the above Taqman Assay. Each Taqman probe, which is specific for a different allele, was labeled by different dye and fluorescence was detected by real time PCR. To investigate whether this assay could be utilized to detect the allele difference accurately, gDNA from two homozygous individuals were mixed as the following ratio: 4:1, 2:1, 1:1, 1:2, 1:4 and the two alleles in the mixes were quantified by the same method. The gDNA contamination in cDNA sample was evaluated by SYBR Green-based real time PCR with an intron assay (primer pair 5′-AGGTCTGCAACACAGCACAT-3′ and 5′-CTGGGAGCTATGCCTGGTC-3′). For normalization, a heterozygous genomic DNA sample was serially diluted of 100, 20, 4, 0.8, 0.16 and 0.03 ng per reaction as standard for both assays. The real time PCR was performed in triplicate for each sample and the AI ratio was expressed as Tquantity/Gquantity.
Resequencing
Fifty-six unrelated Hapmap samples (24 YRI, 22 CEU and 10 ASN) were chosen for resequencing. Amplification of UGT2B15 exon 1 and promoter was performed by using the primers in Supp. Table S1. After exonuclease I and Shrimp Alkaline Phosphatase (United States Biochemicals, USA) treatment, sequencing was performed by using internal primers in Supp. Table S1 and BigDye Terminator v3.1 (Applied Biosystems). In total, 3.9 kb were amplified and resequenced. Polymorphisms were scored by PolyPhred [Stephens, et al., 2006] and confirmed visually. Visual genotype and LD plot were drawn by using the Genome Variation Server (http://gvs.gs.washington.edu/GVS/) and haplotype was inferred using the program PHASE [Stephens and Donnelly, 2003].
Reporter gene promoter assays
A 1.3 kb fragment (from positions −1322 to −12 relative to translation start site) was amplified by nested PCR from individuals with specific haplotypes. The first round of PCR was performed by using PCR primers in Supp. Table S1 and the second round by using primers 5′-CAGTC-GGTACC-TACCTGGATGGCCTATTTCT-3′ and 5′-CAGTC-GCTAGC-GCAATGCTTCTTTTCCAGTT-3′, which introduced restriction sites for KpnI and NheI (New England Biolabs, USA), respectively. PCR was performed by iProof High-Fidelity DNA Polymerase (Bio-Rad, USA) to avoid artificial mutations. After digestion, the segment was cloned into the compatible sites of the pGL3-basic vector (Promega, USA). Mutagenesis at positions −818 and −1139 was performed by QuikChange Site-Directed Mutagenesis Kit (Stratagene, USA) with primer 5′-CTGCAGGAGCAGTACTCTTCCTGCAGAGGG-3′ and 5′-CCCTCTGCAGGAAGAGTACTGCTCCTGCAG-3′, 5′-CAAGCCTTCAGGTCCTGAGGAGAATCTTTGAACCC-3′ and 5′-GGGTTCAAAGATTCTCCTCAGGACCTGAAGGCTTG-3′ (target in bold), respectively, according to the manufacturer’s recommendations. Plasmid DNA was sequenced to exclude any PCR errors and to check the orientation of the haplotypes prior to transfection.
Human hepatocellular carcinoma cell line HepG2 was obtained from American Type Culture Collection (ATCC) and cultured in minimum essential medium (MEM, ATCC) supplemented with 10% fetal bovine serum (FBS, Invitrogen, USA). Human breast cancer cell line MCF-7 was cultured in Dulbecco’s Modified Eagle’s Medium (DMEM; Invitrogen) with 10% FBS and 0.1% insulin (Sigma, Germany). Human prostate adenocarcinoma cell line LNCaP and colon epithelial cell line Caco-2 were maintained in DMEM with 10% FBS. Cells (105) were seeded into 24-well plate 24 hours before transfection. Plasmid constructs (1.9 μg DNA) were transfected by using FuGene HD (Roche, USA) according to the manufacturer’s recommendations. Thirty-six hours after transfection, cells were harvested and luciferase activity was read by Dual-Luciferase Reporter Assay System (Promega) according to the manufacturer’s protocol. Plasmid pRL-TK (0.1 μg DNA; Promega) was co-transfected as an internal control and the promoter activity was expressed as the ratio between Firefly and Renilla luciferase. Six replicates were performed for each experiment. Independent t-tests were performed in SPSS 15.0 (SPSS Inc, USA) and the null hypothesis was rejected when P< 0.05.
Chromatin immunoprecipitation
Chromatin immunoprecipitation (ChIP) was carried out by ChIP Assay Kit (Upstate, USA) according to the manufacturer’s protocol. Briefly, 107 cells were cross-linked for 20 minutes with formaldehyde (1% final concentration) followed by addition of glycine for 5 minutes to end the cross-linking. After washing twice with ice-cold phosphate buffered saline (Invitrogen) containing protease inhibitor cocktail (Sigma) and phenylmethylsulfonyl fluoride (PMSF, Fisher, USA), cells were scraped, lysed and sonicated to obtain 200–800bp fragments in Sonicator 4000 (MISONIX, USA). The chromatin solution was diluted 10-fold with dilution buffer, and precleared with protein A beads. After centrifuging and transferring the supernatant, 1% sample was stored as input and the remaining protein/chromatin complex was captured by rabbit polyclonal anti-Nrf2 antibody (H300, Santa Cruz Biotechnology, USA) or normal rabbit IgG (Santa Cruz) and precipitated by protein A beads. After washing with low salt, high salt, LiCl and TE buffer (twice), the immunoprecipitated protein/chromatin complex was resuspended in elution buffer and cross-link were reversed. Protein was digested by proteinase K (Qiagen) and DNA was recovered by QIAquick PCR purification kit (Qiagen). The obtained DNA was quantified by real time PCR to assess the enrichment by iQ SYBR green (Bio-Rad) with primers 5′-CTGCAAGAACAGACCAGCAA-3′ and 5′-CTTCTCCAGTGGGGATGTGT-3′.
Results
AI assay validation
To make sure our AI assay was accurate, we first quantified the two alleles at SNP rs1902023:G>T in gDNA mixes with known ratios. As shown in Supp. Fig. S1, the observed ratio presented a highly linear relation with the expected one (r2=0.994, P<10−20), thus confirming that our assay could be used to differentiate two alleles, at least in the 0.25–4 ratio interval.
Because several paralogous genes exist, we could not place the PCR primers in different exons. Therefore, we cannot rule out some gDNA contamination in the PCR product. To evaluate the influence of gDNA on the AI assay, we also quantified gDNA contamination by real time PCR in all tissue samples. In most (>80%) liver and breast samples, gDNA only accounted for <5% and <20% of total UGT2B15 exon 1 copies, respectively, consistent with the fact that UGT2B15 is expressed at relatively high levels in liver and breast [Ohno and Nakajin, 2009]. We also calculated the AI by the formula (Tquantity-gDNA)/(Gquantity-gDNA), which was highly correlated with the result by the formula Tquantity/Gquantity in both liver (r2=0.996, P<10−15) and breast (r2=0.814, P<10−18, data not shown). These results suggest that the gDNA contamination is low and, more importantly, that such a contamination is conservative in a test of AI. Considering this and the fact that including more parameters might introduce additional noise, we decided to use Tquantity/Gquantity to report our AI results.
AI in liver and breast
As shown in Fig. 1A, all 15 liver samples, which were chosen to be heterozygous for rs1902023:G>T variant, showed an excess of the G over the T allele, with a significant deviation from a 1:1 ratio (Mean±SD, 0.81±0.15; 95% confidence interval 0.73–0.90; P<0.001). On average, the proportion of G allele is 11–36% greater than that for the T allele. This suggests that the G allele of rs1902023 or one in near-perfect LD with it results in higher UGT2B15 expression levels in the liver. In contrast, in the 49 breast samples heterozygous at this SNP (Fig. 1B), the T/G value varies from 0.63 to 1.19. Fifteen of them showed a T/G value greater than 1 while the rest did not. As a consequence, the average T/G value is only slightly lower than 1 (Mean±SD, 0.95±0.16; 95% confidence interval 0.91–1.01; P=0.06). Moreover, when compared to the liver samples, the distribution of the T/G value is quite different (P=0.005), suggesting a distinct mechanism of gene regulation between these two tissues.
Fig. 1.
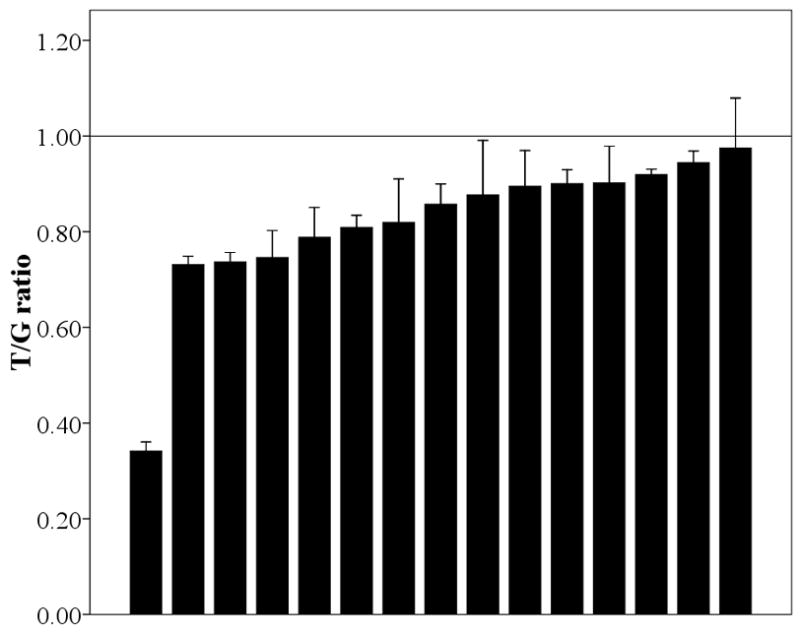
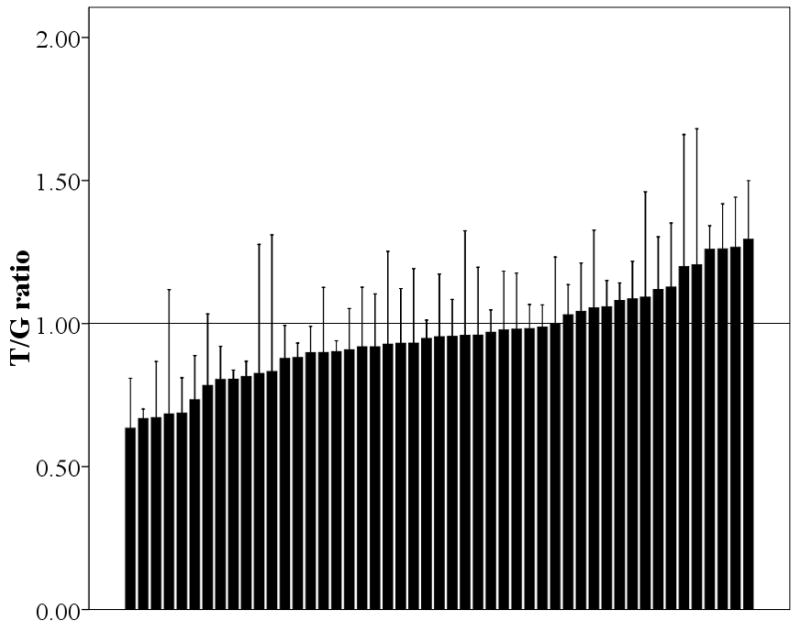
The ratio of T/G in liver (A) and breast (B). Each bar represents one individual and data is expressed as mean±SE.
Recent studies have suggested that UGT2B17 CNV genotype affects UGT2B15 expression [Jakobsson, et al., 2008]. To evaluate whether this CNV has an effect on UGT2B15 AI, we also genotyped UGT2B17 deletion and performed linear regression analysis. One, 7, and 7 liver and 4, 19, and 26 breast samples were homozygous of deletion, heterozygous deletion, and homozygous of non-deletion, respectively. No correlation between the allele ratio in the AI assay and CNV genotype was observed in either liver (r2=0.008, P=747) or breast (r2=0.014, P=0.426, data not shown), which suggests that the UGT2B17 deletion only influences the total UGT2B15 mRNA level.
Recent studies also proposed that estrogen regulates UGT2B15 expression [Harrington, et al., 2006]. Therefore, gender might potentially influence UGT2B15 AI. To investigate this possibility, we compared AI between male and female, but no significant difference was observed in either liver (P=0.851) or breast (P=0.871, data not shown), which suggests that gender is not likely to influence AI.
Genetic variation in UGT2B15 exon 1 and promoter region
To identify the potential cis-regulatory SNPs in LD with rs1902023:G>T, we resequenced the promoter and exon 1 of UGT2B15 in 56 HapMap samples from three major ethnic groups. In the current human genome build, there are two UGT2B15 genes, which resulted from misassembly of two different chromosomes [Xue, et al., 2008]; we took the first one as a reference in our survey. We identified 40 SNPs, most of which were not present in dbSNP (Fig. 2 and Supp. Table S2). Consistent with previous studies, SNP rs1902023:G>T has a high allele frequency, 42% in YRI, 45% in CEU, and 35% in ASN [Iida, et al., 2002; Lampe, et al., 2000]. Seven other SNPs in the promoter region, rs1580083:A>T (−506 relative to translation start), rs1120265:A>G (−508), rs34010522:G>T (−818), rs35513228:C>T (−1139), rs13112099:C>A (−1397), rs34027331:G>A (−1579), and rs7696472:T>C (−1844), showed a near-perfect LD with rs1902023:G>T (r2=0.92 in the YRI and r2=1 in CEU, and ASN; Fig. 2) and form two major and distinct promoter haplotypes (result not shown). These haplotypes will be referred to as type 1 (−506A, −508A, −818G, −1139C, −1397C, −1579G, −1844T) and type 2 (−506T, −508G, −818T, −1139T, −1397A, −1579A, −1844C) and correspond to the previously reported UGT2B15*1 and *2 haplotypes [Levesque, et al., 1997], respectively. Considering our AI result, we hypothesized that these two types of promoter display a different activity and that type 1 has higher activity compared to type 2. An additional 7 SNPs showed intermediate frequency (>10%, Supp. Table S2), but relatively low LD (all r2<0.3) with the two major haplotypes.
Fig. 2.

Visual genotype and LD plot of UGT2B15 exon 1 and promoter. Each column indicates one SNP while each array denotes one individual. Blue, red, yellow, and grey represent homozygous of common allele, heterozygous, homozygous of rare allele, and missing data, respectively. DY, E, and X indicate YRI, CEU, and ASN HapMap populations, respectively. All positions refer to the genome sequence (build 36) for chromosome 4. The LD plot is based on pairwise r2 value and displays in the following order from top to bottom: YRI, CEU, and ASN.
Reporter gene assays
To test the hypothesis that the UGT2B15 promoter contains variants that influence expression levels, we constructed luciferase plasmids containing the two promoter types and transfected them into HepG2 liver cell line. Previous studies had shown that the ~1.2kb region upstream of the transcription start site of the UGT2B genes exhibited full promoter activity [Duguay, et al., 2004; Nakamura, et al., 2008a; Turgeon, et al., 2000]; therefore, this region was given higher priority in this study. As shown in Fig. 3A, pUGT2B15*1, cloned from type 1 promoter, displayed ~20% higher activity than pUGT2B15*2 (P<0.001), which is in agreement with our AI result and indicates that at least one of the four SNPs influences UGT2B15 expression in HepG2 cells. We also transfected a rare recombinant haplotype, which will be referred to as pUGT2B15*r and is identical to type 1 at positions −1139 and −818 and to type 2 at positions −508 and −506 (Fig. 3A). The relative promoter activity of pUGT2B15*r is slightly, but not significantly lower than pUGT2B15*1 (P=0.06). In contrast, pUGT2B15*r activity is significantly higher than that of pUGT2B15*2 (P<0.001). These results taken together suggest that the cis-regulatory SNPs are rs34010522:G>T and/or rs35513228:C>T. To distinguish between them, we generated two additional plasmids by site-directed mutagenesis, which differed from pUGT2B15*1 at positions −818 and −1139 and were named pUGT2B15*mg1 and *mg2, respectively. As shown in Fig.. 3A, both these constructs had lower promoter activity (both P<0.001) compared with pUGT2B15*1, thus showing that nucleotide substitutions at either SNP have similar effects as pUGT2B15*2 and suggesting that both of them influence expression in the liver.
Fig. 3.
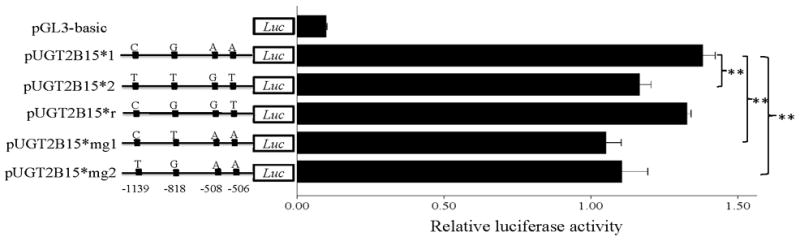

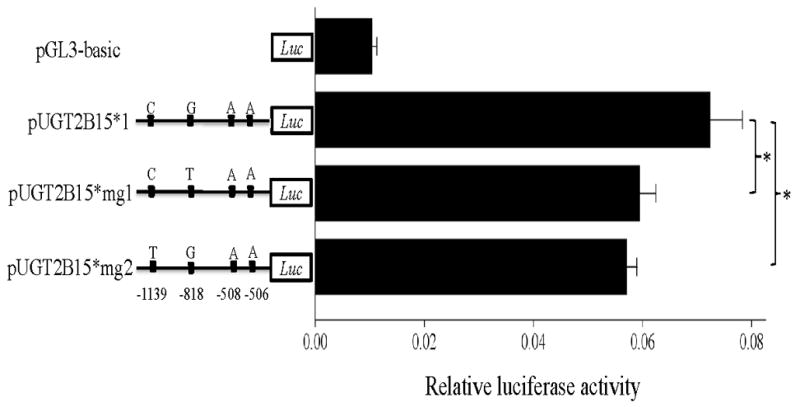
Transient transfection of pUGT2B15 (*1, *2, *r, *mg1, *mg2) in HepG2 (A), MCF-7 (B), LNCaP (C), and Caco-2 (D). 1 Asterisk, P<0.01; 2 Asterisks, P<0.001; Luc, luciferase. Data is expressed as mean±SE.
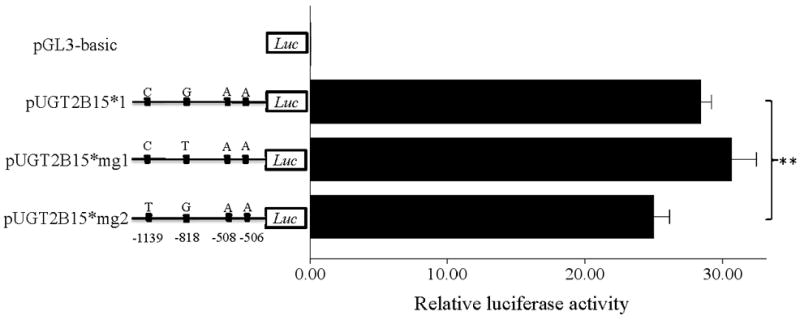
We also transfected the same plasmids into MCF-7 cells, but no significant difference was observed between pUGT2B15*1 and *2 (P=0.544; Fig. 3B). To test whether rs34010522:G>T and rs35513228:C>T affect expression in breast, we also transfected pUGT2B15*mg1 and *mg2, but no significant difference was observed when compared with *1 (P>0.4 in both cases). This result suggests that these two variants work in a tissue specific way and do not alter promoter activity in breast cells.
To determine whether these two variants regulate UGT2B15 expression in other tissues, we also transfected pUGT2B15*1, *mg1, and *mg2 into LNCaP and Caco-2 cells, in which UGT2B15 is highly expressed [Nakamura, et al., 2008b]. As shown in Fig. 3C, pUGT2B15*mg1 did not show a significant difference compared with *1 (P=0.06) while *2 presented a ~14% lower promoter activity (P<0.001), which suggested that only rs35513228:C>T regulates gene expression in prostate. Caco-2 yielded a similar result as HepG2 (see Fig. 3D), in which pUGT2B15*mg1 and *mg2 displayed a ~18% (P=0.005) and ~21% (P=0.003) lower promoter activity than *1, respectively. Therefore, both variants can regulate UGT2B15 expression in the colon. In summary, rs35513228:C>T can influence gene expression in liver, prostate, and colon while rs34010522:G>T work only in liver and colon.
ChIP Assay
Since the SNPs rs34010522:G>T and rs35513228:C>T were within the promoter region, it was reasonable to hypothesize that they lie within transcription factor binding sites and that they modify transcription factor binding affinity. We used Match [Goessling E, 2001] at the TRANSFAC database (http://www.gene-regulation.com/cgi-bin/pub/programs/match/bin/match.cgi) to search for predicted binding sites for transcription factors and found that rs34010522:G>T resides within a canonical Nrf2 binding site. Interestingly, the paralogous region in the UGT2B7 gene (from position −990 to −858) was recently shown to bind Nrf2 and to play an important role in expression of UGT2B7 induced by oxidative stress [Nakamura, et al., 2008a]. To test whether Nrf2 binds upstream region of UGT2B15, we performed ChIP assays in all four abovementioned cells using an anti-Nrf2 antibody and quantified the enrichment for the predicted Nrf2 binding site by real time PCR. As shown in Fig. 4, the anti-Nrf2 immunoprecipitated chromatin samples were significantly enriched for the region surrounding rs34010522:G>T in HepG2 (P=0.031), MCF-7 (P=0.009), LNCaP (P<0.001), and Caco-2 (P=0.011) cells compared with IgG, suggesting that Nrf2 binds this region in all these four tissues. However, the functional role of rs35513228:C>T remains unclear.
Fig. 4.
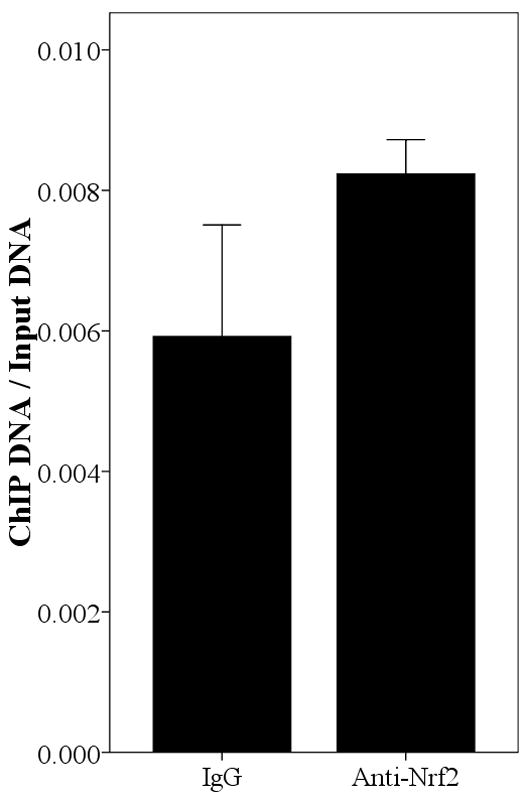
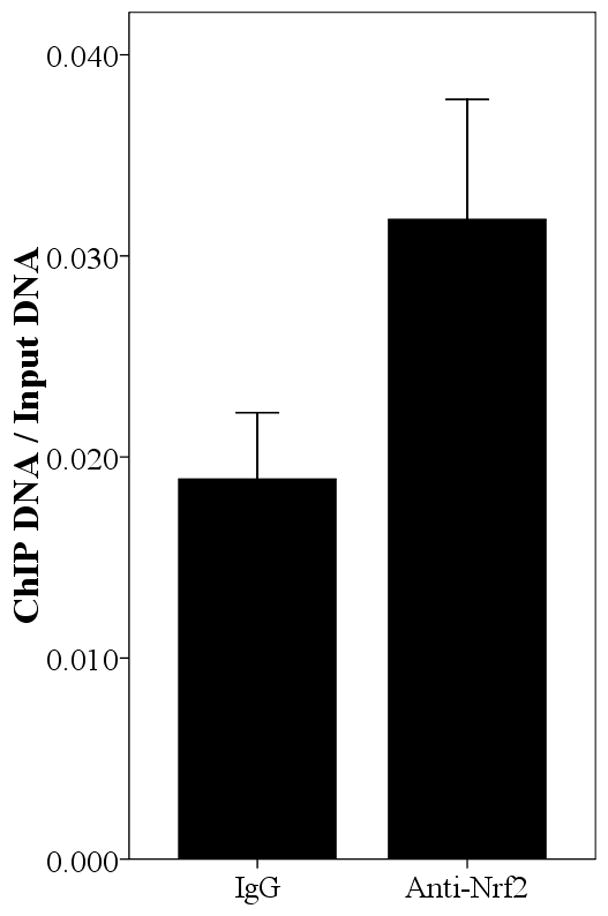
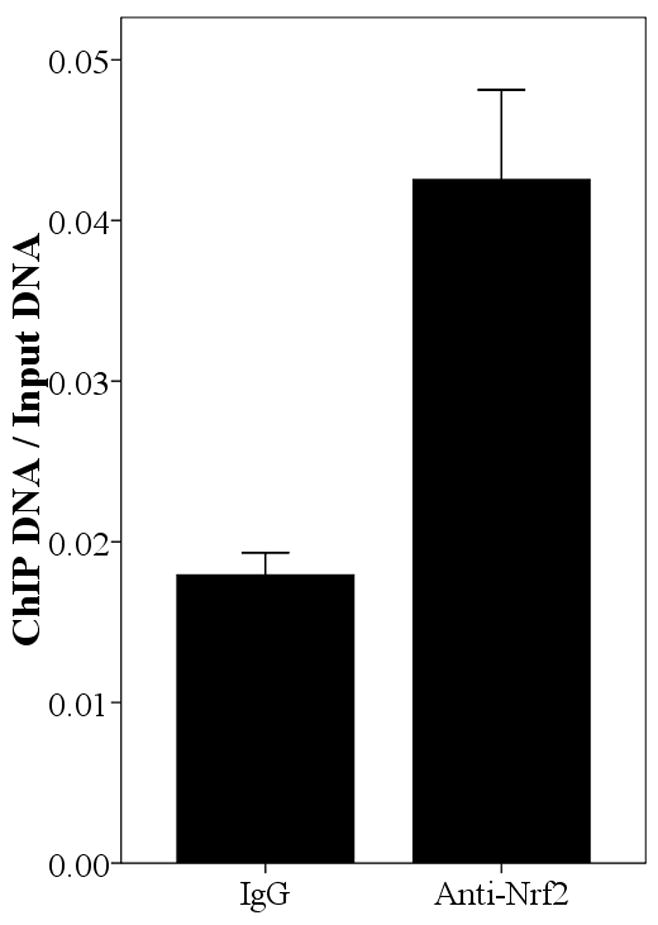
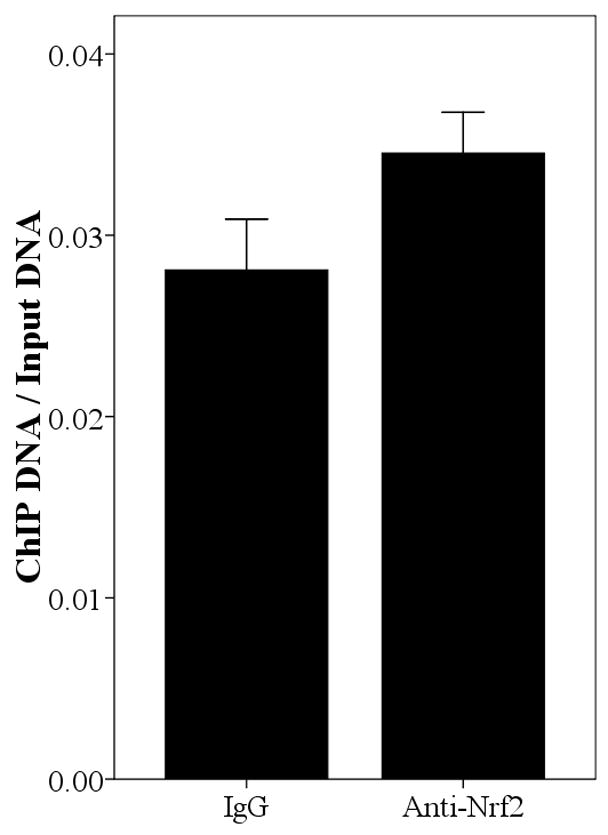
Enrichment of the region spanning position −818 in Anti-Nrf2 ChIPed DNA relative to rabbit IgG ChIPed in HepG2 (A), MCF-7 (B), LNCaP (C), and Caco-2 (D). The result is normalized by input and the data is expressed as Mean±SE.
Discussion
In this study, we used AI to guide our search for cis-regulatory variation of UGT2B15 expression. To achieve this goal, we first characterized the allelic specific expression of the rs1902023:G>T variant in both liver and breast tissues. We then identified a set of SNPs in the promoter region that are in near-perfect LD with the rs1902023:G>T coding variant. These variants and their haplotypes were tested in reporter gene and ChIP assays. The results show that variation in the promoter region affect gene expression in a tissue specific manner. We also show that a sequence element containing one of these variants binds the Nrf2 transcription factor in all tested cells. Further studies are necessary to determine if these variants explain some of the inter-individual variation in UGT2B15 expression and further metabolism of steroid hormone and clinical drugs.
There are several reasons why our AI assay could have failed to detect the effects of cis-regulatory variation. First, because the assay can only be performed on individuals heterozygous for a coding SNP, the sample size is relatively small. Indeed, sample sizes in published AI studies are typically modest [Bray, et al., 2003b; Fukuda, et al., 2006; He, et al., 2005; Hirota, et al., 2004; Liu, et al., 2005; Loeuillet, et al., 2007; Wilkins, et al., 2007; Zhang, et al., 2005] and smaller than in standard association studies between genotype and total mRNA levels. Because small sample sizes reduce the statistical power to detect an imbalance, true cis-regulatory variants may be missed (i.e. a false negative result). Second, many factors, including diet, clinical drug use, disease status, age, gender, may affect UGT2B15 gene expression and introduce several sources of inter-individual variation, in addition to genetic sources. Despite the fact that AI is insensitive to factors that affect gene expression in trans, these factors will increase the experimental and biological variance and, therefore, may reduce the power of an AI assay. Despite these challenges, our AI assay detected a significant and consistent excess of the T over the G allele in liver.
Nonetheless, the significant AI in liver was considered only a starting point for further analyses. In this regard, the results of our reporter gene assays directly comparing the two alleles at promoter SNPs are consistent with and further substantiate the AI findings. Finally, the observation that one of the SNPs of interest lies within a validated binding site for Nrf2 suggests that the cis-regulatory variants affects expression by altering the binding of the transcription factor to the DNA.
AI in breast displayed a much wider distribution across samples, with the T/G ratio ranging from 0.63 to 1.19. The higher variance in breast compared to liver samples (Fig. 1B) may be due to non-genetic factors (e.g. diet, age, etc.), as discussed above, and/or to the low RNA amounts obtained from breast samples, raising the possibility that the lack of significant AI in breast is simply a false negative. To take into account the large technical variance, we performed a binomial test over all technical replicates and no significant result was obtained (P=0.993), thus suggesting that the T/G ratio in breast tissue follows a random pattern. Another possible explanation for the AI results in breast is variable degrees of contamination of adipose cells, where UGT2B15 is also expressed [Tchernof, et al., 1999], across the breast samples. However, since adipose tissue usually yields considerably less RNA than epithelial cells, this explanation seems unlikely (though it cannot be excluded). Finally, the difference in the AI results in breast and liver may be due to a tissue specific regulatory mechanism. This scenario is consistent with the fact that no significant difference was observed in the activity of two major promoter haplotypes in breast MCF-7 cells, suggesting that the inconsistent AI in breast samples is not due solely to technical issues. It is important to keep in mind that additional variants may regulate UGT2B15 gene expression in cis or in trans. Indeed, our resequencing survey identified a number of additional variants in the promoter region that are not in strong LD with rs1902023:G>T (e.g. −378T>C, −477G>A, −497T>C, rs62317005:C>T, and rs7682027:A>G). Further studies are necessary to determine if these variants also influence variation in UGT2B15 expression in liver and, especially, in breast.
The binding site prediction and the ChIP result suggest that the effect of the rs34010522:G>T variant is mediated through the interaction with Nrf2. Nrf2 is a ubiquitous transcription factor [Nguyen, et al., 2005] and has been shown to play an important role in basal and oxidative stress induced expression of phase 2 enzymes [Kwak, et al., 2001; Nakamura, et al., 2008a]. It activates transcription by binding specifically to the antioxidant-response element [ARE; Chan, et al., 2001] in promoter regions. Consistent with these findings, our results suggest that Nrf2 is involved in the regulation of UGT2B15 expression in liver and colon. It is still unclear why Nrf2 binds the region spanning position −818, but does not influence transcription in breast and prostate. A possible explanation is that Nrf2 induces gene expression by forming a complex with other cofactors, such as small Maf proteins and activating transcription factor 4 [ATF4; He, et al., 2001]. If these cofactors are not expressed in breast and prostate, Nrf2 could bind the DNA without inducing transcription. In this regard, it is interesting to note that heme oxygenase-1 (HO-1), whose expression is dependent on Nrf2, also showed different regulation between Hepa (mouse hepatoma) and MCF-7 cell lines [He, et al., 2001], similar to what we observe for UGT2B15. The tissue-specific regulation mediated by Nrf2 may reflect the different importance of oxidative stress in these four tissues. Indeed, a large part of the antioxidative response, such as metabolism of pollutants, chemicals and carcinogens, occurs in the liver and perhaps colon, which also interacts with multiple xenobiotics, but not in breast and prostate.
Recent studies have proposed that rs1902023:G>T predisposes to multiple human phenotypes, including oxazepam glucuronidation [Court, et al., 2004], male fat mass [Swanson, et al., 2007], and breast [Sparks, et al., 2004] and prostate cancer risk [Hajdinjak and Zagradisnik, 2004; MacLeod, et al., 2000; Park, et al., 2004]. Considering the nearly complete LD between rs1902023:G>T and the promoter variants identified in this study, it is possible that the reported associations between rs1902023:G>T and different phenotypes may be due to cis-regulatory in addition to coding variation. Further analyses are necessary to clarify this issue.
Supplementary Material
Acknowledgments
We are grateful to Dr. Ralf Kittler, Prof. Shutsung Liao, Prof. Marc B. Bissonnette and Dr. Eden V. Haverfield for providing MCF-7, LNCaP, Caco-2 cell line and UGT2B17 CNV genotyping assay, respectively. We thank Maria Tretiakova, Athma Pai, Dr. Francesca Luca, Ivy Aneas, and Dr. Dagan Loisel for technical advice. We also thank two anonymous reviewers for their helpful comments. This research was supported by NIH grants CA125183 and GM61393.
Footnotes
Supporting Information for this preprint is available from the Human Mutation editorial office upon request (humu@wiley.com)
References
- Bray NJ, Buckland PR, Owen MJ, O’Donovan MC. Cis-acting variation in the expression of a high proportion of genes in human brain. Hum Genet. 2003a;113:149–153. doi: 10.1007/s00439-003-0956-y. [DOI] [PubMed] [Google Scholar]
- Bray NJ, Buckland PR, Williams NM, Williams HJ, Norton N, Owen MJ, O’Donovan MC. A haplotype implicated in schizophrenia susceptibility is associated with reduced COMT expression in human brain. Am J Hum Genet. 2003b;73:152–161. doi: 10.1086/376578. [DOI] [PMC free article] [PubMed] [Google Scholar]
- Bray NJ, O’Donovan MC. Investigating cis-acting regulatory variation using assays of relative allelic expression. Psychiatr Genet. 2006;16:173–177. doi: 10.1097/01.ypg.0000218612.35139.84. [DOI] [PubMed] [Google Scholar]
- Chan K, Han XD, Kan YW. An important function of Nrf2 in combating oxidative stress: detoxification of acetaminophen. Proc Natl Acad Sci U S A. 2001;98:4611–4616. doi: 10.1073/pnas.081082098. [DOI] [PMC free article] [PubMed] [Google Scholar]
- Chen F, Ritter JK, Wang MG, McBride OW, Lubet RA, Owens IS. Characterization of a cloned human dihydrotestosterone/androstanediol UDP-glucuronosyltransferase and its comparison to other steroid isoforms. Biochemistry. 1993;32:10648–10657. doi: 10.1021/bi00091a015. [DOI] [PubMed] [Google Scholar]
- Chen X, Weaver J, Bove BA, Vanderveer LA, Weil SC, Miron A, Daly MB, Godwin AK. Allelic imbalance in BRCA1 and BRCA2 gene expression is associated with an increased breast cancer risk. Hum Mol Genet. 2008;17:1336–1348. doi: 10.1093/hmg/ddn022. [DOI] [PubMed] [Google Scholar]
- Cheung VG, Bruzel A, Burdick JT, Morley M, Devlin JL, Spielman RS. Monozygotic twins reveal germline contribution to allelic expression differences. Am J Hum Genet. 2008;82:1357–1360. doi: 10.1016/j.ajhg.2008.05.003. [DOI] [PMC free article] [PubMed] [Google Scholar]
- Cheung VG, Conlin LK, Weber TM, Arcaro M, Jen KY, Morley M, Spielman RS. Natural variation in human gene expression assessed in lymphoblastoid cells. Nat Genet. 2003;33:422–425. doi: 10.1038/ng1094. [DOI] [PubMed] [Google Scholar]
- Court MH, Hao Q, Krishnaswamy S, Bekaii-Saab T, Al-Rohaimi A, von Moltke LL, Greenblatt DJ. UDP-glucuronosyltransferase (UGT) 2B15 pharmacogenetics: UGT2B15 D85Y genotype and gender are major determinants of oxazepam glucuronidation by human liver. J Pharmacol Exp Ther. 2004;310:656–665. doi: 10.1124/jpet.104.067660. [DOI] [PubMed] [Google Scholar]
- Ding C, Maier E, Roscher AA, Braun A, Cantor CR. Simultaneous quantitative and allele-specific expression analysis with real competitive PCR. BMC Genet. 2004;5:8. doi: 10.1186/1471-2156-5-8. [DOI] [PMC free article] [PubMed] [Google Scholar]
- Duan S, Huang RS, Zhang W, Bleibel WK, Roe CA, Clark TA, Chen TX, Schweitzer AC, Blume JE, Cox NJ, et al. Genetic architecture of transcript-level variation in humans. Am J Hum Genet. 2008;82:1101–1113. doi: 10.1016/j.ajhg.2008.03.006. [DOI] [PMC free article] [PubMed] [Google Scholar]
- Duguay Y, Baar C, Skorpen F, Guillemette C. A novel functional polymorphism in the uridine diphosphate-glucuronosyltransferase 2B7 promoter with significant impact on promoter activity. Clin Pharmacol Ther. 2004;75:223–233. doi: 10.1016/j.clpt.2003.10.006. [DOI] [PubMed] [Google Scholar]
- Fukuda Y, Koga M, Arai M, Noguchi E, Ohtsuki T, Horiuchi Y, Ishiguro H, Niizato K, Iritani S, Itokawa M, et al. Monoallelic and unequal allelic expression of the HTR2A gene in human brain and peripheral lymphocytes. Biol Psychiatry. 2006;60:1331–1335. doi: 10.1016/j.biopsych.2006.06.024. [DOI] [PubMed] [Google Scholar]
- Gardner-Stephen DA, Mackenzie PI. Liver-enriched transcription factors and their role in regulating UDP glucuronosyltransferase gene expression. Curr Drug Metab. 2008;9:439–452. doi: 10.2174/138920008784746409. [DOI] [PubMed] [Google Scholar]
- Goessling EK-MO, Kel AE, Wingender E. MATCH - a tool for searching transcription factor binding sites in DNA sequences. Application for the analysis of human chromosomes. the German Conference on Bioinformatics; 2001. [DOI] [PMC free article] [PubMed] [Google Scholar]
- Gsur A, Preyer M, Haidinger G, Schatzl G, Madersbacher S, Marberger M, Vutuc C, Micksche M. A polymorphism in the UDP-Glucuronosyltransferase 2B15 gene (D85Y) is not associated with prostate cancer risk. Cancer Epidemiol Biomarkers Prev. 2002;11:497–498. [PubMed] [Google Scholar]
- Guillemette C. Pharmacogenomics of human UDP-glucuronosyltransferase enzymes. Pharmacogenomics J. 2003;3:136–158. doi: 10.1038/sj.tpj.6500171. [DOI] [PubMed] [Google Scholar]
- Hajdinjak T, Zagradisnik B. Prostate cancer and polymorphism D85Y in gene for dihydrotestosterone degrading enzyme UGT2B15: Frequency of DD homozygotes increases with Gleason Score. Prostate. 2004;59:436–439. doi: 10.1002/pros.20024. [DOI] [PubMed] [Google Scholar]
- Harrington WR, Sengupta S, Katzenellenbogen BS. Estrogen regulation of the glucuronidation enzyme UGT2B15 in estrogen receptor-positive breast cancer cells. Endocrinology. 2006;147:3843–3850. doi: 10.1210/en.2006-0358. [DOI] [PubMed] [Google Scholar]
- He CH, Gong P, Hu B, Stewart D, Choi ME, Choi AM, Alam J. Identification of activating transcription factor 4 (ATF4) as an Nrf2-interacting protein. Implication for heme oxygenase-1 gene regulation. J Biol Chem. 2001;276:20858–20865. doi: 10.1074/jbc.M101198200. [DOI] [PubMed] [Google Scholar]
- He H, Olesnanik K, Nagy R, Liyanarachchi S, Prasad ML, Stratakis CA, Kloos RT, de la Chapelle A. Allelic variation in gene expression in thyroid tissue. Thyroid. 2005;15:660–667. doi: 10.1089/thy.2005.15.660. [DOI] [PubMed] [Google Scholar]
- Heighway J, Bowers NL, Smith S, Betticher DC, Koref MF. The use of allelic expression differences to ascertain functional polymorphisms acting in cis: analysis of MMP1 transcripts in normal lung tissue. Ann Hum Genet. 2005;69:127–133. doi: 10.1046/j.1529-8817.2004.00135.x. [DOI] [PubMed] [Google Scholar]
- Hirota T, Ieiri I, Takane H, Maegawa S, Hosokawa M, Kobayashi K, Chiba K, Nanba E, Oshimura M, Sato T, et al. Allelic expression imbalance of the human CYP3A4 gene and individual phenotypic status. Hum Mol Genet. 2004;13:2959–2969. doi: 10.1093/hmg/ddh313. [DOI] [PubMed] [Google Scholar]
- Iida A, Saito S, Sekine A, Mishima C, Kitamura Y, Kondo K, Harigae S, Osawa S, Nakamura Y. Catalog of 86 single-nucleotide polymorphisms (SNPs) in three uridine diphosphate glycosyltransferase genes: UGT2A1, UGT2B15, and UGT8. J Hum Genet. 2002;47:505–510. doi: 10.1007/s100380200075. [DOI] [PubMed] [Google Scholar]
- Jakobsson J, Lorentzon M, Ohlsson C, Lundmark J, Roh HK, Rane A, Ekstrom L. Genetic aspects of epitestosterone formation and androgen disposition: influence of polymorphisms in CYP17 and UGT2B enzymes. Pharmacogenet Genomics. 2008;18:477–485. doi: 10.1097/FPC.0b013e3282fad38a. [DOI] [PubMed] [Google Scholar]
- Johnson AD, Zhang Y, Papp AC, Pinsonneault JK, Lim JE, Saffen D, Dai Z, Wang D, Sadee W. Polymorphisms affecting gene transcription and mRNA processing in pharmacogenetic candidate genes: detection through allelic expression imbalance in human target tissues. Pharmacogenet Genomics. 2008;18:781–791. doi: 10.1097/FPC.0b013e3283050107. [DOI] [PMC free article] [PubMed] [Google Scholar]
- Jordheim LP, Nguyen-Dumont T, Thomas X, Dumontet C, Tavtigian SV. Differential allelic expression in leukoblast from patients with acute myeloid leukemia suggests genetic regulation of CDA, DCK, NT5C2, NT5C3, and TP53. Drug Metab Dispos. 2008;36:2419–2423. doi: 10.1124/dmd.108.023184. [DOI] [PubMed] [Google Scholar]
- King CD, Rios GR, Green MD, Tephly TR. UDP-glucuronosyltransferases. Curr Drug Metab. 2000;1:143–161. doi: 10.2174/1389200003339171. [DOI] [PubMed] [Google Scholar]
- Kristensen VN, Edvardsen H, Tsalenko A, Nordgard SH, Sorlie T, Sharan R, Vailaya A, Ben-Dor A, Lonning PE, Lien S, et al. Genetic variation in putative regulatory loci controlling gene expression in breast cancer. Proc Natl Acad Sci U S A. 2006;103:7735–7740. doi: 10.1073/pnas.0601893103. [DOI] [PMC free article] [PubMed] [Google Scholar]
- Kwak MK, Itoh K, Yamamoto M, Sutter TR, Kensler TW. Role of transcription factor Nrf2 in the induction of hepatic phase 2 and antioxidative enzymes in vivo by the cancer chemoprotective agent, 3H-1, 2-dimethiole-3-thione. Mol Med. 2001;7:135–145. [PMC free article] [PubMed] [Google Scholar]
- Lampe JW, Bigler J, Bush AC, Potter JD. Prevalence of polymorphisms in the human UDP-glucuronosyltransferase 2B family: UGT2B4(D458E), UGT2B7(H268Y), and UGT2B15(D85Y) Cancer Epidemiol Biomarkers Prev. 2000;9:329–333. [PubMed] [Google Scholar]
- Levesque E, Beaulieu M, Green MD, Tephly TR, Belanger A, Hum DW. Isolation and characterization of UGT2B15(Y85): a UDP-glucuronosyltransferase encoded by a polymorphic gene. Pharmacogenetics. 1997;7:317–325. doi: 10.1097/00008571-199708000-00007. [DOI] [PubMed] [Google Scholar]
- Liu W, Innocenti F, Wu MH, Desai AA, Dolan ME, Cook EH, Jr, Ratain MJ. A functional common polymorphism in a Sp1 recognition site of the epidermal growth factor receptor gene promoter. Cancer Res. 2005;65:46–53. [PubMed] [Google Scholar]
- Lo HS, Wang Z, Hu Y, Yang HH, Gere S, Buetow KH, Lee MP. Allelic variation in gene expression is common in the human genome. Genome Res. 2003;13:1855–1862. doi: 10.1101/gr.1006603. [DOI] [PMC free article] [PubMed] [Google Scholar]
- Loeuillet C, Weale M, Deutsch S, Rotger M, Soranzo N, Wyniger J, Lettre G, Dupre Y, Thuillard D, Beckmann JS, et al. Promoter polymorphisms and allelic imbalance in ABCB1 expression. Pharmacogenet Genomics. 2007;17:951–959. doi: 10.1097/FPC.0b013e3282eff934. [DOI] [PubMed] [Google Scholar]
- McCarroll SA, Hadnott TN, Perry GH, Sabeti PC, Zody MC, Barrett JC, Dallaire S, Gabriel SB, Lee C, Daly MJ, et al. Common deletion polymorphisms in the human genome. Nat Genet. 2006;38:86–92. doi: 10.1038/ng1696. [DOI] [PubMed] [Google Scholar]
- Mackenzie PI, Bock KW, Burchell B, Guillemette C, Ikushiro S, Iyanagi T, Miners JO, Owens IS, Nebert DW. Nomenclature update for the mammalian UDP glycosyltransferase (UGT) gene superfamily. Pharmacogenet Genomics. 2005;15:677–685. doi: 10.1097/01.fpc.0000173483.13689.56. [DOI] [PubMed] [Google Scholar]
- MacLeod SL, Nowell S, Plaxco J, Lang NP. An allele-specific polymerase chain reaction method for the determination of the D85Y polymorphism in the human UDP-glucuronosyltransferase 2B15 gene in a case-control study of prostate cancer. Ann Surg Oncol. 2000;7:777–782. doi: 10.1007/s10434-000-0777-3. [DOI] [PubMed] [Google Scholar]
- Mahr S, Burmester GR, Hilke D, Gobel U, Grutzkau A, Haupl T, Hauschild M, Koczan D, Krenn V, Neidel J, et al. Cis- and trans-acting gene regulation is associated with osteoarthritis. Am J Hum Genet. 2006;78:793–803. doi: 10.1086/503849. [DOI] [PMC free article] [PubMed] [Google Scholar]
- Milani L, Gupta M, Andersen M, Dhar S, Fryknas M, Isaksson A, Larsson R, Syvanen AC. Allelic imbalance in gene expression as a guide to cis-acting regulatory single nucleotide polymorphisms in cancer cells. Nucleic Acids Res. 2007;35:e34. doi: 10.1093/nar/gkl1152. [DOI] [PMC free article] [PubMed] [Google Scholar]
- Murakami Y, Isogai K, Tomita H, Sakurai-Yageta M, Maruyama T, Hidaka A, Nose K, Sugano K, Kaneko A. Detection of allelic imbalance in the gene expression of hMSH2 or RB1 in lymphocytes from pedigrees of hereditary, nonpolyposis, colorectal cancer and retinoblastoma by an RNA difference plot. J Hum Genet. 2004;49:635–641. doi: 10.1007/s10038-004-0201-0. [DOI] [PubMed] [Google Scholar]
- Nakamura A, Nakajima M, Higashi E, Yamanaka H, Yokoi T. Genetic polymorphisms in the 5′-flanking region of human UDP-glucuronosyltransferase 2B7 affect the Nrf2-dependent transcriptional regulation. Pharmacogenet Genomics. 2008a;18:709–720. doi: 10.1097/FPC.0b013e32830500c9. [DOI] [PubMed] [Google Scholar]
- Nakamura A, Nakajima M, Yamanaka H, Fujiwara R, Yokoi T. Expression of UGT1A and UGT2B mRNA in human normal tissues and various cell lines. Drug Metab Dispos. 2008b;36:1461–1464. doi: 10.1124/dmd.108.021428. [DOI] [PubMed] [Google Scholar]
- Nguyen T, Sherratt PJ, Nioi P, Yang CS, Pickett CB. Nrf2 controls constitutive and inducible expression of ARE-driven genes through a dynamic pathway involving nucleocytoplasmic shuttling by Keap1. J Biol Chem. 2005;280:32485–32492. doi: 10.1074/jbc.M503074200. [DOI] [PubMed] [Google Scholar]
- Ohno S, Nakajin S. Determination of mRNA expression of human UDP-glucuronosyltransferases and application for localization in various human tissues by real-time reverse transcriptase-polymerase chain reaction. Drug Metab Dispos. 2009;37:32–40. doi: 10.1124/dmd.108.023598. [DOI] [PubMed] [Google Scholar]
- Pant PV, Tao H, Beilharz EJ, Ballinger DG, Cox DR, Frazer KA. Analysis of allelic differential expression in human white blood cells. Genome Res. 2006;16:331–339. doi: 10.1101/gr.4559106. [DOI] [PMC free article] [PubMed] [Google Scholar]
- Park J, Chen L, Shade K, Lazarus P, Seigne J, Patterson S, Helal M, Pow-Sang J. Asp85tyr polymorphism in the udp-glucuronosyltransferase (UGT) 2B15 gene and the risk of prostate cancer. J Urol. 2004;171:2484–2488. doi: 10.1097/01.ju.0000117748.44313.43. [DOI] [PubMed] [Google Scholar]
- Pastinen T, Hudson TJ. Cis-acting regulatory variation in the human genome. Science. 2004;306:647–650. doi: 10.1126/science.1101659. [DOI] [PubMed] [Google Scholar]
- Rockman MV, Kruglyak L. Genetics of global gene expression. Nat Rev Genet. 2006;7:862–872. doi: 10.1038/nrg1964. [DOI] [PubMed] [Google Scholar]
- Schadt EE, Molony C, Chudin E, Hao K, Yang X, Lum PY, Kasarskis A, Zhang B, Wang S, Suver C, et al. Mapping the genetic architecture of gene expression in human liver. PLoS Biol. 2008;6:e107. doi: 10.1371/journal.pbio.0060107. [DOI] [PMC free article] [PubMed] [Google Scholar]
- Serre D, Gurd S, Ge B, Sladek R, Sinnett D, Harmsen E, Bibikova M, Chudin E, Barker DL, Dickinson T, et al. Differential allelic expression in the human genome: a robust approach to identify genetic and epigenetic cis-acting mechanisms regulating gene expression. PLoS Genet. 2008;4:e1000006. doi: 10.1371/journal.pgen.1000006. [DOI] [PMC free article] [PubMed] [Google Scholar]
- Sparks R, Ulrich CM, Bigler J, Tworoger SS, Yasui Y, Rajan KB, Porter P, Stanczyk FZ, Ballard-Barbash R, Yuan X, et al. UDP-glucuronosyltransferase and sulfotransferase polymorphisms, sex hormone concentrations, and tumor receptor status in breast cancer patients. Breast Cancer Res. 2004;6:R488–498. doi: 10.1186/bcr818. [DOI] [PMC free article] [PubMed] [Google Scholar]
- Stamatoyannopoulos JA. The genomics of gene expression. Genomics. 2004;84:449–57. doi: 10.1016/j.ygeno.2004.05.002. [DOI] [PubMed] [Google Scholar]
- Stephens M, Donnelly P. A comparison of bayesian methods for haplotype reconstruction from population genotype data. Am J Hum Genet. 2003;73:1162–1169. doi: 10.1086/379378. [DOI] [PMC free article] [PubMed] [Google Scholar]
- Stephens M, Sloan JS, Robertson PD, Scheet P, Nickerson DA. Automating sequence-based detection and genotyping of SNPs from diploid samples. Nat Genet. 2006;38:375–381. doi: 10.1038/ng1746. [DOI] [PubMed] [Google Scholar]
- Stranger BE, Nica AC, Forrest MS, Dimas A, Bird CP, Beazley C, Ingle CE, Dunning M, Flicek P, Koller D, et al. Population genomics of human gene expression. Nat Genet. 2007;39:1217–1224. doi: 10.1038/ng2142. [DOI] [PMC free article] [PubMed] [Google Scholar]
- Swanson C, Mellstrom D, Lorentzon M, Vandenput L, Jakobsson J, Rane A, Karlsson M, Ljunggren O, Smith U, Eriksson AL, et al. The uridine diphosphate glucuronosyltransferase 2B15 D85Y and 2B17 deletion polymorphisms predict the glucuronidation pattern of androgens and fat mass in men. J Clin Endocrinol Metab. 2007;92:4878–4882. doi: 10.1210/jc.2007-0359. [DOI] [PubMed] [Google Scholar]
- Tao H, Cox DR, Frazer KA. Allele-specific KRT1 expression is a complex trait. PLoS Genet. 2006;2:e93. doi: 10.1371/journal.pgen.0020093. [DOI] [PMC free article] [PubMed] [Google Scholar]
- Tchernof A, Levesque E, Beaulieu M, Couture P, Despres JP, Hum DW, Belanger A. Expression of the androgen metabolizing enzyme UGT2B15 in adipose tissue and relative expression measurement using a competitive RT-PCR method. Clin Endocrinol (Oxf) 1999;50:637–642. doi: 10.1046/j.1365-2265.1999.00709.x. [DOI] [PubMed] [Google Scholar]
- Tukey RH, Strassburg CP. Human UDP-glucuronosyltransferases: metabolism, expression, and disease. Annu Rev Pharmacol Toxicol. 2000;40:581–616. doi: 10.1146/annurev.pharmtox.40.1.581. [DOI] [PubMed] [Google Scholar]
- Turgeon D, Carrier JS, Levesque E, Beatty BG, Belanger A, Hum DW. Isolation and characterization of the human UGT2B15 gene, localized within a cluster of UGT2B genes and pseudogenes on chromosome 4. J Mol Biol. 2000;295:489–504. doi: 10.1006/jmbi.1999.3374. [DOI] [PubMed] [Google Scholar]
- Turgeon D, Carrier JS, Levesque E, Hum DW, Belanger A. Relative enzymatic activity, protein stability, and tissue distribution of human steroid-metabolizing UGT2B subfamily members. Endocrinology. 2001;142:778–787. doi: 10.1210/endo.142.2.7958. [DOI] [PubMed] [Google Scholar]
- Tuupanen S, Niittymaki I, Nousiainen K, Vanharanta S, Mecklin JP, Nuorva K, Jarvinen H, Hautaniemi S, Karhu A, Aaltonen LA. Allelic imbalance at rs6983267 suggests selection of the risk allele in somatic colorectal tumor evolution. Cancer Res. 2008;68:14–17. doi: 10.1158/0008-5472.CAN-07-5766. [DOI] [PubMed] [Google Scholar]
- Tycko B, Morison IM. Physiological functions of imprinted genes. J Cell Physiol. 2002;192:245–258. doi: 10.1002/jcp.10129. [DOI] [PubMed] [Google Scholar]
- Udler M, Maia AT, Cebrian A, Brown C, Greenberg D, Shah M, Caldas C, Dunning A, Easton D, Ponder B, et al. Common germline genetic variation in antioxidant defense genes and survival after diagnosis of breast cancer. J Clin Oncol. 2007;25:3015–3023. doi: 10.1200/JCO.2006.10.0099. [DOI] [PubMed] [Google Scholar]
- Valle L, Serena-Acedo T, Liyanarachchi S, Hampel H, Comeras I, Li Z, Zeng Q, Zhang HT, Pennison MJ, Sadim M, et al. Germline allele-specific expression of TGFBR1 confers an increased risk of colorectal cancer. Science. 2008;321:1361–1365. doi: 10.1126/science.1159397. [DOI] [PMC free article] [PubMed] [Google Scholar]
- Wang H, Elbein S. Detection of Allelic Imbalance in Gene Expression Using Pyrosequencing. Methods in Molecular Biology. 2007;373:157–175. doi: 10.1385/1-59745-377-3:157. [DOI] [PubMed] [Google Scholar]
- Ware MD, DeSilva D, Sinilnikova OM, Stoppa-Lyonnet D, Tavtigian SV, Mazoyer S. Does nonsense-mediated mRNA decay explain the ovarian cancer cluster region of the BRCA2 gene? Oncogene. 2006;25:323–328. doi: 10.1038/sj.onc.1209033. [DOI] [PubMed] [Google Scholar]
- Wegman P, Elingarami S, Carstensen J, Stal O, Nordenskjold B, Wingren S. Genetic variants of CYP3A5, CYP2D6, SULT1A1, UGT2B15 and tamoxifen response in postmenopausal patients with breast cancer. Breast Cancer Res. 2007;9:R7. doi: 10.1186/bcr1640. [DOI] [PMC free article] [PubMed] [Google Scholar]
- Wilkins JM, Southam L, Price AJ, Mustafa Z, Carr A, Loughlin J. Extreme context specificity in differential allelic expression. Hum Mol Genet. 2007;16:537–546. doi: 10.1093/hmg/ddl488. [DOI] [PubMed] [Google Scholar]
- Xue Y, Sun D, Daly A, Yang F, Zhou X, Zhao M, Huang N, Zerjal T, Lee C, Carter NP, et al. Adaptive evolution of UGT2B17 copy-number variation. Am J Hum Genet. 2008;83:337–346. doi: 10.1016/j.ajhg.2008.08.004. [DOI] [PMC free article] [PubMed] [Google Scholar]
- Yan H, Yuan W, Velculescu VE, Vogelstein B, Kinzler KW. Allelic variation in human gene expression. Science. 2002;297:1143. doi: 10.1126/science.1072545. [DOI] [PubMed] [Google Scholar]
- Yan H, Zhou W. Allelic variations in gene expression. Curr Opin Oncol. 2004;16:39–43. doi: 10.1097/00001622-200401000-00008. [DOI] [PubMed] [Google Scholar]
- Zhang Y, Wang D, Johnson AD, Papp AC, Sadee W. Allelic expression imbalance of human mu opioid receptor (OPRM1) caused by variant A118G. J Biol Chem. 2005;280:32618–32624. doi: 10.1074/jbc.M504942200. [DOI] [PubMed] [Google Scholar]
Associated Data
This section collects any data citations, data availability statements, or supplementary materials included in this article.