

Abstract
The specificity of δ ribozyme cleavage was investigated using a trans-acting antigenomic δ ribozyme. Under single turnover conditions, the wild type ribozyme cleaved the 11-mer ribonucleotide substrate with a rate constant of 0.34 min−1, an apparent Km of 17.9 nM and an apparent second-order rate constant of 1.89 × 10⁷ min−1 M−1. The substrate specificity of the δ ribozyme was thoroughly investigated using a collection of substrates that varied in either the length or the nucleotide sequence of their P1 stems. We observed that not only is the base pairing of the substrate and the ribozyme important to cleavage activity, but also both the identity and the combination of the nucleotide sequence in the substrates are essential for cleavage activity. We show that the nucleotides in the middle of the P1 stem are essential for substrate binding and subsequent steps in the cleavage pathway. The introduction of any mismatches at these positions resulted in a complete lack of cleavage by the wild type ribozyme. Our findings suggest that factors more complex than simple base pairing interactions, such as tertiary structure interactions, could play an important role in the substrate specificity of δ ribozyme cleavage.
δ ribozymes derived from the genome of hepatitis δ virus (HDV)1 are metalloenzymes. Like other catalytically active ribozymes, namely hammerhead and hairpin ribozymes, the δ ribozymes cleave a phosphodiester bond of their RNA substrates and give rise to reaction products containing a 5′-hydroxyl and a 2′,3′-cyclic phosphate termini. Two forms of δ ribozymes, namely genomic and antigenomic, were derived and referred to by the polarity of the HDV genome from which the ribozyme was generated. Both δ ribozyme forms exhibit self-cleavage activity, and it has been suggested that they are involved in the process of viral replication (1). This type of activity has been described as cis-acting δ ribozymes (2).
Like other ribozymes, δ ribozymes have a potential application in gene therapy in which an engineered ribozyme is directed to inhibit gene expression by targeting a specific mRNA molecule. It has been demonstrated that a very low concentration (<0.1 mM) of Ca2+ and Mg2+ is required for δ ribozyme cleavage (3). δ ribozymes have a unique characteristic in their substrate binding, namely that only the 3′-portion of the substrate is required for binding to the ribozyme. A short stretch of nucleotides (7 nt) located on the substrate is required for cleavage. Although one might suspect the specificity of δ ribozyme cleavages due to their short recognition site, we view this characteristic of the δ ribozyme as an advantage for the future development of a therapeutic means of controlling, for example, a viral infection.
Since little is known about the kinetic properties of δ ribozymes, study of the trans-acting system will enable us to answer some basic questions on both the structure required and the kinetic properties, including the substrate specificity, of δ ribozymes. Depending on the predicted secondary structures used, various trans-acting δ ribozyme systems were generated by separating the RNA molecule into ribozyme and substrate molecules at various positions (4–6). Here, we generate a trans-acting δ ribozyme, based on the pseudo knot-like structure proposed by Perrotta and Been (2), by separating the single-stranded region located at the junction between the P1 and P2 stems (Fig. 1). Although, several investigations have been performed to address the questions related to the substrate specificity of δ ribozymes in both the cis- and transacting forms (2, 5–12), most, if not all, experiments were carried out by randomly changing the base pairing combinations or by introducing mismatches which interfere with the Watson-Crick base pairing between the substrate and the ribozyme in the P1 stem (Fig. 1). It was demonstrated that cleavage activity was not destroyed by the interchanging of one to four nucleotide pairs between the substrate and the δ ribozyme (2, 8, 11, 12). One or two nucleotide mismatches at any position of the P1 stem, except positions 5 and 11 (numbering according to Fig. 1), completely destroyed the activity (2, 5–12). Although these are composite results from various versions of δ ribozymes, these findings could be interpreted as indicating that the positions located at both extremities of the base paired stem formed by the substrate and the ribozyme were more likely to tolerate a mismatch, resulting in distortion of the P1 stem, than the internal positions. There is no information on how each nucleotide of the substrate affects the cleavage activity and its kinetics since most investigations were carried out at only one or two positions at a time, and the findings generally reported in a plus/minus manner (e.g. cut or uncut). Therefore, the substrate specificity of δ ribozyme could not be deduced from previous reports. To determine how substrate sequences affect δ ribozyme cleavage activity, we performed kinetic studies using a collection of short oligonucleotide substrates (11 nt) with a trans-acting δ ribozyme. In this report, we demonstrate that each nucleotide of the P1 stem contributes differently to the cleavage activity. We compare the observed cleavage rate constants for cleavable substrates and the equilibrium dissociation constants for the uncleavable substrates with those of the wild type substrate. We present evidence that strongly suggests that the nucleotides located in the center of the P1 stem formed between substrate and ribozyme (Fig. 1, positions 7 and 8) are important not only for substrate recognition but probably also for subsequent steps, for example a conformation change yielding a transition complex.
Fig. 1. Secondary structure and nucleotide sequences of the constructed trans-acting antigenomic δ ribozymes and their complementary substrates.
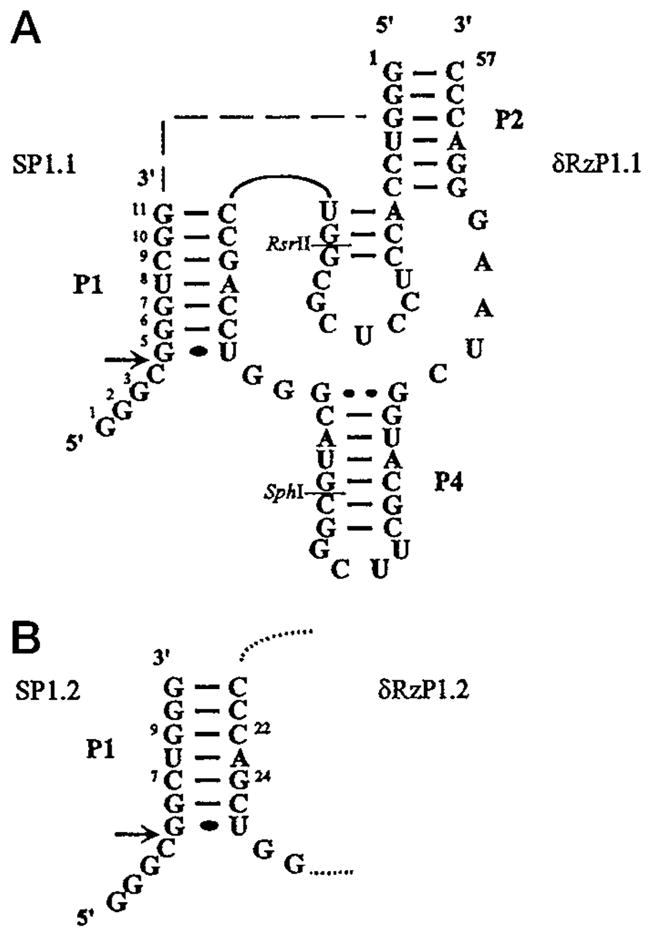
The base paired regions of the pseudo knot-like structure are numbered according to Perrotta and Been (2). Panel A, secondary structure of the complex formed between δRzP1.1 and its substrate, SP1.1. The arrow indicates the cleavage site. The nucleotide numbering of the substrate is indicated and referred to throughout the text. The dotted line represents a single-strand region joining the substrate and ribozyme molecules as presented in the cis-form (namely J1/2, 2). This single-strand area was eliminated to produce the trans-acting ribozymes used in this study. Panel B, the P1 region of δRzP1.2 and its substrate, SP1.2. Two base pairs at positions 7 and 9 of the substrate and positions 22 and 24 of δRzP1.1 were swapped. δRzP1.2 was constructed using the RsrII and SphI restriction sites indicated on the structure of δRzP1.1 as described under “Materials and Methods.” The rest of the structure is identical to δRzP1.1 as in panel A.
MATERIALS AND METHODS
Plasmids Carrying δ Ribozymes
The antigenomic ribozyme sequence of the hepatitis δ virus described by Makino et al. (13) was used to generate a trans-acting δ ribozyme with some modifications as shown in Fig. 1. Briefly, the construction was performed as follows. Two pairs of complementary and overlapping oligonucleotides, representing the entire length of the ribozyme (57 nt), were synthesized and subjected to an annealing process prior to cloning into pUC19. The annealed oligonucleotides were ligated to HindIII and SmaI co-digested pUC19 to give rise to a plasmid harboring the δ ribozyme (referred to as pδRzP1.1). A mutant ribozyme (δRzP1.2) was then constructed by modifying the substrate recognition site of pδRzP1.1 by ligation of an oligonucleotide containing the altered sequence flanked by restriction endonuclease sites to RsrII/SphI predigested pδRzP1.1. The sequences of engineered ribozymes were confirmed by DNA sequencing. Plasmids containing wild type and mutant ribozymes were then prepared using Qiagen tip-100 (Qiagen Inc.), digested with SmaI, purified by phenol and chloroform extraction, and precipitated for further use as templates for in vitro transcription reactions.
RNA Synthesis
Ribozyme
In vitro transcription reactions contained 5 μg of linearized recombinant plasmid DNA as template, 27 units RNAGuard® RNase inhibitor (Amersham Pharmacia Biotech), 4 mM of each ribonucleotide (Amersham Pharmacia Biotech), 80 mM HEPES-KOH, pH 7.5, 24 mM MgCl2, 2 mM spermidine, 40 mM dithiothreitol, 0.01 unit of pyrophosphatase (Boehringer Mannheim) and 25 μg of purified T7 RNA polymerase in a final volume of 50 μl, and were incubated at 37 °C for 4 h.
Substrates
Deoxyoligonucleotides (500 pmol) containing the substrate and T7 promoter sequence were denatured by heating at 95 °C for 5 min in a 20-μl mixture containing 10 mM Tris-HCl, pH 7.5, 10 mM MgCl2, 50 mM KCl2, and allowed to cool slowly to 37 °C. The in vitro transcription reactions were carried out using the resulting partial duplex formed as template under the same conditions as described for the production of the ribozyme.
After incubation, the reaction mixtures were fractionated by denaturing 20% polyacrylamide gel electrophoresis (19:1 ratio of acrylamide to bisacrylamide) containing 45 mM Tris borate, pH 7.5, 7 M urea, and 1 mM EDTA. The reaction products were visualized by UV shadowing. The bands corresponding to the correct sizes of either ribozymes or substrates were cut out, and the transcripts eluted overnight at 4 °C in a solution containing 0.1% SDS and 0.5 M ammonium acetate. The transcripts were then precipitated by the addition of 0.1 volume of 3 M sodium acetate, pH 5.2, and 2.2 volumes of ethanol. Transcript yield was determined by spectrophotometry.
End-labeling of RNA with [γ-32P]ATP
Purified transcripts (10 pmol) were dephosphorylated in a 20-μl reaction mixture containing 200 mM Tris-HCl, pH 8.0, 10 units of RNAGuard®, and 0.2 units of calf intestine alkaline phosphatase (Amersham Pharmacia Biotech). The mixture was incubated at 37 °C for 30 min and then extracted twice with a same volume of phenol:chloroform (1:1). Dephosphorylated transcripts (1 pmol) were end-labeled in a mixture containing 1.6 pmol [γ-32P]ATP, 10 mM, Tris-HCl, pH 7.5, 10 mM MgCl2, 50 mM KCl, and 3 units of T4 polynucleotide kinase (Amersham Pharmacia Biotech) at 37 °C for 30 min. Excess [γ-32P]ATP was removed by applying the reaction mixture onto a spin column packed with a G-50 Sephadex gel matrix (Amersham Pharmacia Biotech). The concentration of labeled transcripts was adjusted to 0.01 pmol/ml by the addition of water.
Cleavage Reactions
To initiate a cleavage reaction, we tested different procedures and chose the method that yielded the highest cleavage rate constant and the maximum cleavage product as described by Fauzi et al. (14). Various concentrations of ribozymes were mixed with trace amounts of substrate (final concentration <1 nM) in a 18-μl reaction mixture containing 50 mM Tris-HCl, pH 7.5, and subjected to denaturation by heating at 95 °C for 2 min. The mixtures were quickly placed on ice for 2 min and equilibrated to 37 °C for 5 min prior to the initiation of the reaction. Unless stated otherwise, cleavage was initiated by the addition of MgCl2 to 10 mM final concentration. The cleavage reactions were incubated at 37 °C, and followed for 3.5 h or until the end point of cleavage was reached. The reaction mixtures were periodically sampled (2–3 μl), and these samples were quenched by the addition of 5 μl of stop solution containing 95% formamide, 10 mM EDTA, 0.05% bromphenol blue, and 0.05% xylene cyanol. The resulting samples were analyzed by a 20% polyacrylamide gel electrophoresis as described above. Both the substrate (11 nt) and the reaction product (4 nt) bands were detected using a Molecular Dynamics radioanalytic scanner after exposition of the gels to a phosphorimaging screen.
Kinetic Analysis
Measurement of Pseudo First-order Rate Constant (kcat, Km and kcat/Km)
Kinetic analyses were performed under single turnover conditions as described by Hertel et al. (15) with some modifications. Briefly, trace amounts of end-labeled substrate (<1 nM) were cleaved by various ribozyme concentrations (5–500 nM). The fraction cleaved was determined, and the rate of cleavage (kobs) obtained from fitting the data to the equation At = A∞ (1 − e−kt) where At is the percentage of cleavage at time t, A∞ is the maximum percent cleavage (or the end point of cleavage), and k is the rate constant (kobs). Each rate constant was calculated from at least two measurements. The values of kobs obtained were then plotted as a function of ribozyme concentrations for determination of the other kinetic parameters: kcat, Km and kcat/Km. Values obtained from independent experiments varied less than 15%. The requirement for Mg2+ by both ribozymes was studied by incubating the reaction mixtures with various concentrations of MgCl2 (1–500 mM) in the presence of an excess of ribozyme (500 nM) over substrate (<1 nM). The concentrations of Mg2+ at the half-maximal velocity were determined for both ribozymes.
Determination of Equilibrium Dissociation Constants (Kd)
For mismatched substrates that could not be cleaved by the ribozyme, the equilibrium dissociation constants were determined using a slight modification of the method described by Fedor and Uhlenbeck (16). Eleven different ribozyme concentrations, ranging from 5 to 600 nM, were individually mixed with trace amounts of end-labeled substrates (<1 nM) in a 9-μl solution containing 50 mM Tris-HCl, pH 7.5, heated at 95 °C for 2 min and cooled to 37 °C for 5 min prior to the addition of MgCl2 to a final concentration of 10 mM, in a manner similar to that of a regular cleavage reaction. The samples were incubated at 37 °C for 1.5 h, at which time 2 μl of sample loading solution (50% glycerol, 0.025% of each bromphenol blue and xylene cyanol) was added, and the resulting mixtures were electrophoresed through a nondenaturing polyacrylamide gel (20% acrylamide with a 19:1 ratio of acrylamide to bisacrylamide, 45 mM Tris borate buffer, pH 7.5 and 10 mM MgCl2). Polyacrylamide gels were prerun at 20 W for 1 h prior to sample loading, and the migration was carried out at 15 W for 4.5 h at room temperature. Quantification of bound and free substrates was performed following an exposure of the gels to a phosphorimaging screen as described earlier.
RESULTS
The trans-acting δ ribozymes used in this report were derived from the antigenomic δ ribozyme of HDV (13). Some features of the antigenomic δ ribozyme were modified to improve its structural stability and to aid in transcript production. Based on a pseudo knot-like structure described by Perrotta and Been (2), Fig. 1 shows the structure of the δ ribozymes used with some modifications: (i) the single-stranded region between substrate and ribozyme (region J1/2) was eliminated to separate the substrate molecule from the ribozyme; (ii) the substrate contains only 11 nt and produces 7-and 4-nt cleavage products, and the GGG at the 5′-end was added to increase the yield during in vitro transcription (17); (iii) three G-C base pairs were introduced in the P2 region to improve both the structural stability and transcript production; and (iv) the P4 stem was shortened to the minimum length reported to result in an active ribozyme (18). Prior to performing a cleavage reaction, native gel electrophoresis was used to test for the possible presence of aggregates or multimer forms of the transcripts. Various concentrations of ribozyme, ranging from 5 nM to 2 μM, were mixed with trace amounts of end-labeled ribozyme (less than 0.5 nM) and fractionated under nondenaturing conditions as described under “Materials and Methods.” We detected the presence of a slow migrating species of ribozyme in the mixture containing 2 μM ribozyme (data not shown). The quantification of the slow migrating band showed that the band amounted to approximately 2% of the total radioactive material. However, a single band was detected at the concentrations used for kinetic analysis and under single turnover conditions (5–600 nM). Similar experiments were performed for each substrate. There was no substrate multimer detected at the concentrations used (data not shown). The equimolar mixture of end-labeled substrate and ribozyme was also fractionated under nondenaturing conditions, and it resulted a single band of ribozyme and substrate complex similar to those observed for the Kd measurement shown in Fig. 4.
Fig. 4. The measurement of equilibrium dissociation constant (Kd).

Panel A, an autoradiogram of a nondenaturing polyacrylamide gel. The gel fractionation separated labeled substrate (Free) from ribozyme-substrate complex (Bound) at various concentrations of δRzP1.1. The positions of the top of the gel (ori) and xylene cyanol (XC) are indicated. Panel B, the percentage of ribozyme-substrate complex (Bound) were quantified and plotted to fit a simple binding curve as described under “Material and Methods” with Kd = 31.9 ± 2.7 nM.
Cleavage Kinetics of Constructed Antigenomic δ Ribozymes
Two forms of trans-acting δ ribozymes (δRzP1.1 and δRzP1.2) were used with their corresponding substrates (11 nt) for the kinetic studies. δRzP1.2 differs from δRzP1.1 in that δRzP1.2 has two nucleotides, at positions 22 and 24 of δRzP1.1, interchanged (Fig. 1, 5′-CCCAGCU-3′). Time course experiments for cleavage reactions catalyzed by both δRzP1.1 and δRzP1.2 were monitored by the appearance of the 4 nt cleavage product. An example of a time course experiment for a cleavage reaction catalyzed by δRzP1.1 is shown in Fig. 2, panel A. In this particular experiment, 100 nM of δRzP1.1 was incubated with 1 nM end-labeled substrate, SP1.1. The newly formed product and the remaining substrate bands at each time point were quantified, and the percentage of cleavage was plotted as a function of time (Fig. 2, panel B). δRzP1.1 cleaved approximately 60% of the substrate within 10 min. The data were fitted to a single exponential equation as described under “Materials and Methods” so as to obtain the observed rate constant (kobs = 0.21 min−1). We attempted to fit the data as biphasic reactions as described for the hairpin (19) and the hammerhead (20) ribozymes. We observed that the standard deviation (χ2) of data fitted to a double-exponential equation was higher (χ2 = 0.01203) than that fitted to a single exponential equation (χ2 = 0.000203). Although we could not exclude or dismiss completely the possibility that more than one conformation of the active ribozyme could be formed, the data were treated as if the reactions were monophasic in their kinetics for comparison purposes.
Fig. 2. Time course for a cleavage reaction catalyzed by δRzP1.1.

Panel A, an autoradiogram of a polyacrylamide gel showing a cleavage assay carried out under single turnover conditions as described under “Materials and Methods.” 100 nM δRzP1.1 were incubated with 1 nM end-labeled SP1.1 at 37 °C in the presence of 50 mM Tris-HCl, pH 7.5, and 10 mM MgCl2. The positions of xylene cyanol (XC) and bromphenol blue (BPB) are indicated. Panel B, quantification of the data in panel A. A single exponential equation was used to fit data to kobs = 0.21 min−1 and 68% as the extent of cleavage.
Similar experiments were performed using trace amounts of substrate (<1 nM) and various ribozyme concentrations to measure kobs at each ribozyme concentration. The values of kobs of both δRzP1.1 and δRzP1.2 increased with an increase in ribozyme concentration up to approximately 200 nM (Fig. 3, panel A). The concentration of ribozyme at which the reaction velocity reached half-maximal (apparent Km, Km′) is 17.9 ± 5.6 nM for δRzP1.1 and 16.7 ± 6.4 nM for δRzP1.2. Under the reaction conditions used, in which the increase in ribozyme concentration has no significant effect on the rate of cleavage, the cleavage rate (kobs) is therefore represented by the catalytic rate constant (kcat). The cleavage rate constants are 0.34 min−1 for δRzP1.1 and 0.13 min−1 for δRzP1.2. Apparent second-order rate constants (kcat/Km′) were calculated to be 1.89 × 10⁷ min−1 M−1 for δRzP1.1 and 0.81 × 10⁷ min−1 M−1 for δRzP1.2 (Table I).
Fig. 3. Kinetics of cleavage reactions catalyzed by trans-acting δ ribozymes.

Panel A, the observed cleavage rate constants were plotted as a function of ribozyme concentrations. The values of δRzP1.1 are indicate by ●; and those of δRzP1.2 by ○. The concentrations of ribozyme at half-velocity are 17.9 ± 5.6 nM for δRzP1.1 and 16.7 ± 6.4 nM for δRzP1.2. The values of kcat is 0.34 min−1 for δRzP1.1 and 0.13 min−1 for δRzP1.2. Standard error from two independent experiments was less than 15%. panel B. The requirement of Mg2+ for cleavage reactions catalyzed by δRzP1.1 and δRzP1.2. Under single turnover conditions, 500 nM ribozymes were incubated with 1 nM end-labeled complementary substrates in the presence of various concentration of Mg2+. The obtained initial cleavage rates were plotted as a function of the Mg2+ concentrations. The values of δRzP1.1 are indicated by ● and those of δRzP1.2 by ○. At 10 mM Mg2+, which was used in a regular cleavage reaction, both ribozymes cleaved their substrates at their maximum rate (0.3 min−1 for δRzP1.1 and 0.1 min−1 for δRzP1.2).
Table I. Kinetic parameters of wild type ribozyme (δRzP1.1) and mutant ribozyme (δRzP1.2).
Under single turnover conditions, trace amounts of end-labeled substrate (<1 nM) were cleaved by various concentrations of ribozyme (5–600 nM). Reactions carried out under these conditions displayed monophasic kinetics. The values were calculated from at least two independent experiments, and standard variations were less than 15%.
| Kinetic parameters | δRzP1.1 | δRzP1.2 |
|---|---|---|
| kcat (min−1) | 0.34 ± 0.02 | 0.13 ± 0.01 |
| Km′ (nM) | 17.9 ± 5.6 | 16.7 ± 6.4 |
| kcat/Km′ (min−1M−1) | 1.89 × 10⁷ | 0.81 × 10⁷ |
| KMg (mM) | 2.2 ± 1.0 | 2.1 ± 0.8 |
Since we observed that the kcat of δRzP1.2 is about 3 times less than that of δRzP1.1, whereas the Km′ is similar, we investigated whether an increased amount of Mg2+ in the cleavage reaction would affect the kcat of δRzP1.2. Under single turnover conditions, in which the ribozyme and substrate concentrations were kept at 500 and 1 nm, respectively, we found that both ribozymes cleave their complementary substrates at Mg2+ concentrations as low as 1 mM, which is the estimated physiological concentration of Mg2+ (21). At this concentration, the kobs obtained were 0.11 ± 0.01 and 0.04 ± 0.01 min−1, for δRzP1.1 and δRzP1.2, respectively (Fig. 3, panel B). A maximum kobs for δRzP1.2 was observed when the concentration of Mg2+ was 10 mM. Higher concentrations of Mg2+ did not increase either the kobs or the extent of cleavage for both ribozymes. We did not observe a decrease in the cleavage rate when higher concentrations of Mg2+ were used (e.g. 500 mM). The requirement for magnesium at half-maximal velocity (KMg) was 2 mM for both δRzP1.1 and δRzP1.2.
Substrate Specificity
To compare the specificity of the δ ribozyme with various substrates, δRzP1.1 was used under single turnover conditions as described above. The cleavage reactions were performed with a trace amount of each substrate (<1 nM) and 500 nM δRzP1.1. Under these conditions, the observed rates reflect the rates of cleavage without interference from either product dissociation or inhibition. For each substrate both the observed cleavage rate constants (kobs) and the extent of cleavage were calculated and compared with those of the wild type substrate, as shown in Table II.
Table II. Cleavage activity of shorter or mismatched substrates as compared to the wild type substrate (SP1.1).
Bold letters represent the nucleotides of wild type substrate recognized by δRzP1.1. The numbers in subscript indicate the nucleotides of wild type substrate that were individually altered to generate shorter or mismatched substrates. kobs is the observed rate of cleavage calculated from at least two measurements. Cleavage extent (%) is obtained by fitting the data to the equation At = A∞ (1 − e−kt), where At is the percentage of cleavage at time t, A∞ is the maximum percentage of cleavage, and k is the rate constant. krel is the relative rate constant as compared to that of wild-type substrate. ΔΔG‡, the apparent free energy of transition-state stabilization, was calculated using the equation ΔΔG‡ = RT ln krel, where T = 310.15 K (37 °C) and R = 1.987 cal · K−1mol−1.
| Substrates | Sequence | kobs | Extent of cleavage | krel | ΔΔG‡ |
|---|---|---|---|---|---|
| min−1 | % | kcal/mol | |||
| Wild-type substrate (S11-mer) | GGGCG5G6G7U8C9G10G11 | 0.34 ± 0.02 | 48.3 ± 0.9 | 1 | |
| S10-mer | GGGCGGGUCG | 0.022 ± 0.01 | 28.8 ± 4.3 | 0.063 | −1.69 |
| S9-mer | GGGCGGGUC | NDa | ND | ||
| S8-mer | GGGCGGGU | ND | ND | ||
| SG5A | GGGCAGGUCGG | 0.009 ± 0.002 | 20.0 ± 2.4 | 0.026 | −2.25 |
| SG5C | GGGCCGGUCGG | 0.047 ± 0.017 | 1.7 ± 0.2 | 0.138 | −1.22 |
| SG6A | GGGCGAGUCGG | 0.026 ± 0.006 | 5.8 ± 0.5 | 0.076 | −1.59 |
| SG6U | GGGCGUGUCGG | 0.071 ± 0.026 | 3.7 ± 0.3 | 0.209 | −0.96 |
| SG7A | GGGCGGAUCGG | ND | ND | ||
| SG7U | GGGCGGUUCGG | ND | ND | ||
| SU8C | GGGCGGGCCGG | ND | ND | ||
| SU8G | GGGCGGGGCGG | ND | ND | ||
| SC9A | GGGCGGGUAGG | 0.016 ± 0.007 | 8.2 ± 3.0 | 0.047 | −1.88 |
| SC9U | GGGCGGGUUGG | 0.031 ± 0.005 | 21.2 ± 1.0 | 0.091 | −1.48 |
| SG10U | GGGCGGGUCUG | 0.016 ± 0.002 | 8.4 ± 0.5 | 0.047 | −1.88 |
| SG11U | GGGCGGGUCGU | 0.011 ± 0.001 | 32.1 ± 2.5 | 0.032 | −2.12 |
ND, no detectable cleavage activity after a 3.5-h incubation period.
Shorter Substrates
Three shorter substrates containing 10, 9, and 8 nt were tested individually and compared with the 11-nt substrate (SP1.1) in which 7 nt base paired with δRzP1.1. The 10-, 9-, and 8-nt substrates contain 6, 5, and 4 nt regions complementary to δRzP1.1, respectively. We observed that the 10-nt substrate was cleaved with a kobs of 0.02 ± 0.01 min−1 and a maximal cleavage of 28.8% (Table II). We could not detect the cleavage product formed when the 9- and 8-nt substrates were used, even after a 3.5-h incubation time. The cleavage reactions were also carried out in the presence of 100 mM Mg2+ instead of the 10 mM concentration used in a regular cleavage reaction. We observed no improvement in the values of the kobs and the extent of cleavage for the 10-nt substrate and still detected no cleavage for both the 9- and 8-nt substrates.
Mismatched Substrates
We have generated a collection of substrates in which single mismatches were individually introduced into the P1 region of the substrate and then used in the cleavage reactions (Table II). Mutation at position 5 resulted in at least a 9-fold decrease in kobs as compared with that of SP1.1 (0.34 min−1). However, for SG5A, in which A was substituted for G at position 5 of SP1.1, the extent of cleavage was only reduced by half. When this nucleotide was changed to cytosine, the cleavage was reduced almost to nil (ca. 1.7%). δRzP1.1 cleaved approximately 4% of the SG6A and SG6U substrates, in which A or U were substituted for G at position 6. The alteration of either position 7 or 8, located in the middle of the P1 stem, yielded uncleavable substrates (SG7A, SG7U, SU8C, SU8G). The kobs was also drastically decreased when the C at position 9 was altered to A or U. The extent of cleavage was reduced to approximately 50%, when SC9U was used. The SG10U substrate, in which U was substituted for G at position 10, gave a similar result to SC9A. Finally, δRzP1.1 cleaved the substrate SG11U almost as well as SP1.1, although the kobs was considerably slower (0.01 min−1). The relative activity of each single mismatched substrate was calculated to obtain an apparent free energy of transition-state stabilization, ΔΔG‡ (22, 23). We found that the values of ΔΔG‡ range between −0.96 to −2.25 kcal−1 mol−1. This apparent difference in activation energy was also observed when substrates of leadzyme were altered and used in a cleavage assay (22).
Equilibrium Dissociation Constant (Kd)
The four substrates containing a single mismatch either at position 7 or 8, which were not cleaved by δRzP1.1, were used to determine an equilibrium dissociation constant (Kd). Trace amounts of end-labeled substrates (SG7A, SG7U, SU8C, or SU8G) were individually incubated with various concentrations of δRzP1.1 for the gel shift analysis as described under “Materials and Methods.” To ensure that the dissociation equilibrium was reached, we incubated the reaction mixtures at various intervals. We found that the equilibrium was reached within 5 min, and that a longer incubation of 28 h did not affect the measurement of Kd. Since SP1.1 can be cleaved under native gel electrophoresis conditions, we therefore used its analog which has a deoxyribose at position 4 (SdC4) to obtain the estimated Kd of the wild type substrate. This analog could not be cleaved by δRzP1.1 under the conditions used (2), and has been shown to be a competitive inhibitor of δRzP1.1 cleavage.2 An example of a gel shift analysis carried out for the analog is shown in Fig. 4. In this particular analysis, trace amounts of SdC4 (<1 nM) were incubated with 11 concentrations of δRzP1.1 ranging from 5 to 600 nM. An autoradiogram of the resulting gel obtained by a Molecular Dynamics radioanalytic scanner is shown in Fig. 4, panel A. The bands of the bound SdC4 and the free SdC4 at each δRzP1.1 concentration were quantified, and the percentage of the bound SdC4 was plotted as shown in Fig. 4, panel B. The experimental data were fitted to a simple binding equation as described under “Materials and Methods” to obtain Kd = 31.9 ± 2.7 nM. Similar experiments were performed for SG7A, SG7U, SU8C, and SU8G. The substrates in which A or U were substituted for G at position 7 were observed to have a lower affinity for δRzP1.1 than those of the substrates in which the U at position 8 is altered. The higher Kd values obtained for SG7A (320 ± 20 nM) and SG7U (220 ± 60 nM), as compared with those of the analog (31.9 ± 2.7 nM), SU8C (36.1 ± 2.5 nM), and SU8G (71.5 ± 3.2 nM) are summarized in Table III. We observed that the single mismatch introduced at position 7 disturbed the equilibrium of substrate-ribozyme complex formation to a greater extent than the mutation at position 8. The values of Kd were used in the determination of the free energy of substrate binding (Gibbs energy change, ΔGE·S). The mismatch at position 7 interfered with the stabilization of the substrate-ribozyme complex, resulting in ΔΔGE·S between −0.43 and −1.4 kcal−1 mol−1.
Table III. Equilibrium dissociation constants of uncleavable single mismatched substrates as compared to the analog of the wild-type substrate.
Bold letters and numbers in subscript represent the nucleotides and their positions in the analog recognized by ribozyme. The analog was designed to have a deoxyribonucleotide at position 4 of the wild-type substrate. Kd is equilibrium dissociation constant obtained from fitting the data to the equation % bound substrate = [RZ]/Kd + [RZ], where [RZ] is the concentration of ribozyme, and Kd is the equilibrium dissociation constant. ΔGE.S, the Gibbs energy change, is calculated using the equation ΔGE.S = −RT ln Kd, where T = 310.15 K (37 °C) and R = 1.987 cal K−1·mol−1. Krel > 1 indicates a destabilization effect of the given mismatched nucleotide. ΔΔGE.S is the relative change of Gibbs energy obtained from either the equation ΔΔGE.S = −RT ln Krel, or from the difference between the values of ΔGE.S of mismatched substrate and that of the analog.
| Substrates | Sequence | Kd | ΔGE.S | Krel | ΔΔGE.S |
|---|---|---|---|---|---|
| nM | kcal · mol−1 | ||||
| Analog substrate (SdC4) | GGGdC4G5G6G7U8C9G10G11 | 31.9 ± 2.7 | −10.6 | 1 | |
| SG7A | GGGCGGAUCGG | 320 ± 20 | −9.2 | 10 | −1.4 |
| SG7U | GGGCGGUUCGG | 220 ± 60 | −9.4 | 7 | −1.19 |
| SU8C | GGGCGGGCCGG | 36.1 ± 2.5 | −10.6 | 1 | 0 |
| SU8G | GGGCGGGGCGG | 71.5 ± 3.2 | −10.1 | 2 | −0.43 |
DISCUSSION
δ ribozymes derived from the genome of HDV are of interest in the development of a gene regulation system in which the designed ribozymes would down-regulate the expression of a target gene. The facts that δ ribozymes are derived from HDV and that this pathogen naturally replicates in animal systems, suggest that this catalytic RNA could be used to control gene expression in human cells. Like other ribozymes, the designed ribozyme should specifically cleave its target substrates while leaving other cellular RNA molecules intact. We designed a trans-acting δ ribozyme harboring a recognition sequence similar to the HDV antigenomic δ self-cleaving motif so as to have a minimal system for the study of the specificity of the base pairing interaction between the δ ribozyme and its substrate.
Although a number of trans-acting δ ribozymes have been generated, they appear to have variable cleavage rate constants. The discrepancy of cis-acting δ ribozyme activities has been reviewed, and it was suggested that the variation of the cleavage activity, at least for cis-acting forms, may result from the nonribozyme flanking sequences used by each investigator (24). Our trans-acting δ ribozyme, δRzP1.1, exhibited an activity with a cleavage rate of 0.34 min−1, or a t1/2 of 2 min, under pseudo first-order conditions. These data are in good agreement with the observed rate constant (0.35 min−1) of a cis-acting δ ribozyme derived from antigenomic HDV RNA (7). We found that the extent of cleavage is approximately 60%, regardless of the concentration of ribozyme used, suggesting possibilities that (i) a fraction of the substrate was bound to an inactive form of the δ ribozyme; (ii) substrate was bound to Cs of the 3′ of the ribozyme, instead of to the P1 region of the ribozyme, causing a misfold or a nonactive substrate-ribozyme complex; or (iii) a portion of the ribozyme might adopt another conformation following substrate binding. Based on the latter hypothesis, the alternative form of ribozyme-substrate complex could undergo cleavage at a very low rate. We first investigated whether or not the presence of the alternative form could be a result of an infidelity of the T7 RNA polymerase transcription. Two batches of purified T7 RNA polymerase were tested using various amounts of enzyme and incubation times (data not shown). We found that the transcripts produced by both batches of purified T7 RNA polymerase at the different incubating times exhibited a similar cleavage pattern and extent, suggesting that it is the nature of ribozyme transcripts to adopt an alternative form in the reaction mixtures, as previously reported for the hairpin ribozyme (19). A possible occurrence of misplaced or misfold substrate-substrate complex was dismissed since there is no evidence of other formed complexes detected under nondenaturing gel electrophoresis and also by RNase mapping.3 Finally, the possible occurrence of a slow cleaving form of δ ribozyme was assessed following cleavage reactions. We attempted to fit the experimental data using a multiphasic kinetic equation. Since we could not clearly describe the kinetics of our trans-acting δ ribozyme as biphasic or multiphasic reactions, we measured initial rates of cleavage for comparative purposes.
To summarize the cleavage reactions catalyzed by δRzP1.1 and δRzP1.2, free energy diagrams of the reaction coordinates were constructed (Fig. 5). The diagrams relate the two states in the cleavage reactions using kinetic parameters obtained under single turnover conditions. δRzP1.1 and δRzP1.2 differ in that they have two base pairs in the middle of the P1 stem interchanged. As expected, the free energies of substrate binding are virtually identical (−11 kcal−1 mol−1). The base pair interchange in δRzP1.2 increased the value of ΔG‡ by approximately 0.5 kcal−1 mol−1. It is interesting to note that the free energy of the transition state was affected by the changes in the base pairing of the P1 stem. Although several kinetic parameters were greatly different from those reported here, similar findings were previously reported when two nucleotides (positions 7 and 8) of the substrate were interchanged and complemented by the δ ribozyme (12). Since the kinetics of δ cleavage reactions appear to be affected by the particular combination of base pairs, it is very likely that in addition to P1 base pairing a tertiary interaction might also participate in substrate recognition. In this scenario the substrate-ribozyme complex would undergo a conformational transition, following formation of P1 stem, which involves tertiary interaction(s). These interactions might result in the positioning of the scissile bond in the catalytic center, a key step in the reaction pathway.
Fig. 5. Free energy diagrams for cleavage reactions catalyzed by δRzP1.1 and δRzP1.2.
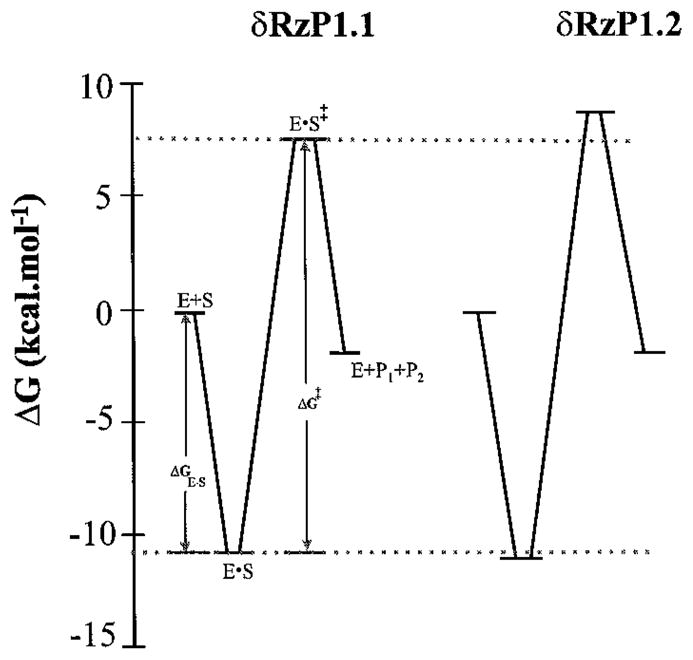
The cleavage reactions for δRzP1.1 (P1, CCGACCU) and δRzP1.2 (P1, CCCAGCU) were carried out under similar conditions as described under “Materials and Methods.” A standard state 1 M free substrate and ribozyme at 310.15 K (37 °C) is assumed to be the same for both δ ribozymes. Gibbs energy changes of the enzyme-substrate complex formation (ΔGE·S) were calculated from an apparent Km (Km′) using the equation, ΔGE·S = −RT ln Km′. The Km′ is 17.9 nM for δRzP1.1 and 16.7 nM for δRzP1.2; the ΔGE·S is 10.9 kcal−1mol−1 for δRzP1.1 and 11.0 kcal−1 mol−1 for δRzP1.2. Transition energy (ΔG‡) is calculated from kcat using the equation, ΔG‡ = −RT ln h/kcat·h/kB·T. The kcat is 0.34 min−1 for δRzP1.1 and 0.13 min−1 for δRzP1.2; ΔG‡ is 18.8 kcal−1 mol−1 for δRzP1.1 and 19.4 kcal−1 mol−1 for δRzP1.2. R, molar gas constant; h, Planck constant; kB, Boltzman constant. Dashed lines indicate the values obtained for δRzP1.1.
The substrate specificity of the δ ribozyme was studied using δRzP1.1. First, we found that the δ ribozyme can cleave a substrate having a minimum of 6 nucleotides adjacent to the cleavage site. This result is in an agreement with those previously reported for both the cis-acting form (5) and the trans-systems (11) that a minimum of 6 base pairing is required for cleavage. The kobs of the 10-nt substrate is at least 10 times slower than that of SP1.1 (Table II). We also used shorter substrates generated by alkali hydrolysis as described by Perrotta and Been (11) to verify the cleavage reactions catalyzed by the two similar trans-acting δ ribozymes. Due to the slow cleavage rate, the detection of the disappearance of shorter substrates in the mixtures could not accurately be measured (data not shown).
Second, to estimate the contribution of base pairing interaction of the P1 stem to the cleavage reaction, a collection of single mismatched substrates was generated by introducing point mutations into the substrate sequence. Although there are a number of reports on the base pairing requirement of the P1 region (8, 10–12, 14), no extensive investigation has been performed on each individual nucleotide of either cis- or transacting δ ribozymes. The determination of ribozyme specificity against various substrates was first attempted by comparing the apparent second-order rate constant (kcat/Km′) of each substrate to that of wild type substrate. We found that the ribozyme cleaved single mismatched substrates very slowly and gave a low percent cleavage (maximum of 2–20%) within the reaction time studied (3.5 h). As a consequence, the measurement of the apparent second-order rate constants as a function of ribozyme concentration yielded values with a high margin of error. We thus reported the cleavage activity of the ribozyme against various single mismatched substrates in terms of extent of cleavage and kobs, which at a high ribozyme concentration reflects the kcat of the cleavage reaction. In all cases, we observed the decrease in cleavage extent, which we suspected to be due mainly to the poor binding between the substrate and the ribozyme. The wobble base pair (G-U) at the cleavage site is required to maintain a high level of cleavage (10, 11). Mismatches at this position, which create either an A-U or a C-U pairing, decreased the cleavage activity in a manner analogous to that reported in another version of trans-acting δ ribozymes (10). It is interesting to note that the extent of cleavage decreases proportionally to the mismatches introduced into the 3′ and 5′ positions of the middle of the P1 stem. The simultaneous alteration of two nucleotides in the middle of the P1 stem was reported to give rise to an uncleavable substrate in both the cis-and trans-acting systems (11). However, in both cases the activity could be restored by the generation of a complementary ribozyme or a substrate.
The calculated free energy of transition-state stabilization (ΔΔG‡) for each substrate listed in Table II varies between −0.9 and −2.25 kcal−1 mol−1. Each position of base pairing between the substrate and the ribozyme appears to affect the reaction pathway differently, at least with regard to transition state complex formation. If we assume that mismatched substrates yield the same level of ΔGE·S, various end points of cleavage for mismatched substrates could be resolved depending upon the height of the energy barrier level to be overcome in the transition state. To address these questions precisely, more experiments on the equilibrium binding constant and the internal equilibrium of the reactions are required. We have determined the calculated Kd of P1 duplex formation using the equation described by Serra and Turner (25) to be 28.5 nM. By using an analog, we have shown that the Kd of the wild type substrate to its ribozyme is 31.9 nM. It is very interesting to note that the mismatch introduced at position U8 of the substrate has little effect on substrate binding affinity. However, the change completely eliminated cleavage activity. The mismatch introduced at position G7 of the substrate affected both the binding and chemical steps since it not only lowered the binding affinity of the substrate for the ribozyme, but also destroyed the cleavage activity. These findings suggest that some base pairs of the P1 stem have dual roles, participating in the substrate binding and subsequent steps leading a chemical cleavage, as was observed for the base pair interactions between the hammer-head ribozyme and its substrates (26). To address these findings more precisely some preliminary experiments have been carried out using the metal-ion induced cleavage method to study the tertiary structure of δ ribozyme 3. The data obtained to date suggests that positions U8 and G7 are likely involved in the formation of an essential metal-ion binding site. The mismatches introduced at either of the two positions destroyed the formation of this metal-ion binding site, a process which has been found to be highly associated with cleavage activity.
We present here evidence that aside from the base pairing between the substrate and the ribozyme, tertiary interactions, especially ones involving the P1 stem, appear to dictate the reaction pathway of δ ribozyme. To fully comprehend how the cleavage reactions are governed, the elucidation of these tertiary interactions is essential.
Acknowledgments
We thank Dr. Stephane Mercure for the pδRzP1.1 construct.
Footnotes
This work was supported in part by a grant from the Medical Research Council (MRC) of Canada (to J. P. P.).
The abbreviations used are: HDV, hepatitis δ virus; nt, nucleotide(s).
S. Mercure and J. P. Perreault, unpublished data.
D. Lafontaine and J. P. Perreault, unpublished data.
References
- 1.Lazinski DW, Taylor JM. RNA (New York) 1995;1:225–233. [PMC free article] [PubMed] [Google Scholar]
- 2.Perrotta AT, Been MD. Nature. 1991;350:434–436. doi: 10.1038/350434a0. [DOI] [PubMed] [Google Scholar]
- 3.Wu HN, Lin YJ, Lin FP, Makino S, Chang MF, Lai MMC. Proc Natl Acad Sci U S A. 1989;86:1831–1835. doi: 10.1073/pnas.86.6.1831. [DOI] [PMC free article] [PubMed] [Google Scholar]
- 4.Branch AD, Robertson HD. Proc Natl Acad Sci U S A. 1991;88:10163–10167. doi: 10.1073/pnas.88.22.10163. [DOI] [PMC free article] [PubMed] [Google Scholar]
- 5.Kumar PKR, Suh YA, Taira K, Nishikawa S. FASEB J. 1993;7:124–129. doi: 10.1096/fasebj.7.1.8422958. [DOI] [PubMed] [Google Scholar]
- 6.Kawakami J, Yada K, Suh YA, Kumar PKR, Nishikawa F, Maeda H, Taira K, Ohtsuka E, Nishikawa S. FEBS Lett. 1996;394:132–136. doi: 10.1016/0014-5793(96)00941-6. [DOI] [PubMed] [Google Scholar]
- 7.Wu HN, Huang ZS. Nucleic Acids Res. 1992;20:5937–5941. doi: 10.1093/nar/20.22.5937. [DOI] [PMC free article] [PubMed] [Google Scholar]
- 8.Wu HN, Wang YJ, Hung CF, Lee HJ, Lai MMC. J Mol Biol. 1992;223:233–245. doi: 10.1016/0022-2836(92)90728-3. [DOI] [PubMed] [Google Scholar]
- 9.Wu HN, Lee JY, Huang HW, Huang Y, Hsueh TG. Nucleic Acids Res. 1993;21:4193–4199. doi: 10.1093/nar/21.18.4193. [DOI] [PMC free article] [PubMed] [Google Scholar]
- 10.Nishikawa F, Fauzi H, Nishikawa S. Nucleic Acids Res. 1997;25:1605–1610. doi: 10.1093/nar/25.8.1605. [DOI] [PMC free article] [PubMed] [Google Scholar]
- 11.Perrotta AT, Been MD. Biochemistry. 1992;31:16–21. doi: 10.1021/bi00116a004. [DOI] [PubMed] [Google Scholar]
- 12.Been MD, Perrotta AT, Rosenstein S. Biochemistry. 1992;31:11843–11852. doi: 10.1021/bi00162a024. [DOI] [PubMed] [Google Scholar]
- 13.Makino S, Chang MF, Shieh CK, Kamahora T, Vannier DM, Govindarajan S, Lai MMC. Nature. 1987;329:343–346. doi: 10.1038/329343a0. [DOI] [PubMed] [Google Scholar]
- 14.Fauzi H, Kawakami J, Nishikawa F, Nishikawa S. Nucleic Acids Res. 1997;25:3124–3130. doi: 10.1093/nar/25.15.3124. [DOI] [PMC free article] [PubMed] [Google Scholar]
- 15.Hertel KJ, Herschlag D, Uhlenbeck OC. EMBO J. 1996;15:3751–3757. [PMC free article] [PubMed] [Google Scholar]
- 16.Fedor MJ, Uhlenbeck OC. Biochemistry. 1992;31:12042–12054. doi: 10.1021/bi00163a012. [DOI] [PubMed] [Google Scholar]
- 17.Milligan JF, Groebe DR, Witherell GW, Uhlenbeck OC. Nucleic Acids Res. 1987;15:8783–8798. doi: 10.1093/nar/15.21.8783. [DOI] [PMC free article] [PubMed] [Google Scholar]
- 18.Been MD, Perrotta AT. RNA (New York) 1995;1:1061–1070. [PMC free article] [PubMed] [Google Scholar]
- 19.Esteban JA, Banerjee AR, Burke JM. J Biol Chem. 1997;272:13629–13639. doi: 10.1074/jbc.272.21.13629. [DOI] [PubMed] [Google Scholar]
- 20.Amiri KM, Hagerman PJ. J Mol Biol. 1996;261:125–135. doi: 10.1006/jmbi.1996.0446. [DOI] [PubMed] [Google Scholar]
- 21.Traut TW. Mol Cell Biochem. 1994;140:1–22. doi: 10.1007/BF00928361. [DOI] [PubMed] [Google Scholar]
- 22.Chartrand P, Usman N, Cedergren R. Biochemistry. 1997;36:3145–3150. doi: 10.1021/bi962219p. [DOI] [PubMed] [Google Scholar]
- 23.Fersht AR. Biochemistry. 1988;27:1577–1580. doi: 10.1021/bi00405a027. [DOI] [PubMed] [Google Scholar]
- 24.Been MD. Trends Biochem Sci. 1994;19:251–256. doi: 10.1016/0968-0004(94)90151-1. [DOI] [PubMed] [Google Scholar]
- 25.Serra MJ, Turner DH. Methods Enzymol. 1995;259:242–261. doi: 10.1016/0076-6879(95)59047-1. [DOI] [PubMed] [Google Scholar]
- 26.Hertel KJ, Peracchi A, Uhlenbeck OC, Herschlag D. Proc Natl Acad Sci U S A. 1997;94:8497–8502. doi: 10.1073/pnas.94.16.8497. [DOI] [PMC free article] [PubMed] [Google Scholar]