Abstract
We studied whether mitochondrial functions and Ca2+ metabolism were altered in Wistar Kyoto normotensive (WKY) and spontaneous hypertensive rats (SHR). Ca2+ uptake was decreased in SHR compared to WKY rats. Accumulation of Ca2+ was more efficient in WKY than in SHR rats. mΔΨ was lower in SHR compared to WKY rats. Basal complex IV activity was higher in SHR than WKY rats, whereas basal l-citrulline production, an indicator of nitric oxide synthesis, was decreased in SHR and dependent on Ca2+ concentration (p < 0.05). Impact of Ca2+ was counteracted by EGTA. These data show an age-dependent decreased mitochondrial functions in brain mitochondria during hypertension.
Keywords: Brain mitochondria, Calcium uptake, Nitric oxide, Cytochrome c oxidase, Hypertension, Aging
1. Introduction
Intracellular free calcium ([Ca2+]i), plays an important role in cellular signaling. Accordingly, [Ca2+]i, is a second-messenger, implicated in the action of growth factors, hormones via transmitting signals to various kinases and enzymes (McCormack and Denton, 1993; Brini, 2003). Regulation of [Ca2+]i concentration is controlled by the uptake and release via Ca2+ channels of plasma membrane, endoplasmic reticulum, and inner mitochondrial membrane (Nicholls, 1986). Intramitochondrial Ca2+ ([Ca2+]m) concentrations are maintained by active transport. It has been shown that rat liver and heart mitochondria contain 1–2 nmol Ca2+ per milligram of mitochondrial protein (cited in Ghafourifar and Saavedra-Molina, 2006). Mitochondria contain tightly regulated transport systems to maintain mitochondrial Ca2+ levels. The Ca2+ uptake takes place via an electrophoretic uniporter that is driven by the transmembrane potential (Nicholls, 2004, 2005). Mitochondrial release of Ca2+ ions is achieved by reversal of the influx carrier, and by a Na+ dependent (Ca2+/Na+) or independent (Ca2+/H+) exchanger. The Ca2+/Na+ pathway predominates in mitochondria of heart, brain, skeletal muscle, adrenal cortex, brown fat, and most tumor tissues. The Ca2+/H+ system is important in liver, kidney, lung, and smooth muscle mitochondria (McCormack and Denton, 1993; Richter, 1997; Bringold et al., 2000).
The hypertension is an established risk factor for cerebrovascular disease. A mechanism contributing to maintain high blood pressure during acute hypertension is the increased generation of superoxide (O2 •−) in the vessel wall, which leads to vascular injury (Hougaku et al., 1992; Ohtsuki et al., 1995; Halliwell and Gutteridge, 1999). The chronic hypertension selectively causes cell damage and injury in hypertensive-vulnerable organs like brain. Brain and nervous tissue are particularly prone to oxidative damage for several reasons: the high Ca2+ traffic across neuronal membranes, the presence of excitotoxic amino acids; some neurotransmitters are autoxidizable molecules and could generate O2 •−, the neuronal membrane lipids contains a high content of polyunsaturated fatty-acids, which are targets of oxygen-derived free radicals, the brain is relatively deficient in antioxidants defenses and the high rate of O2 consumption in the tissue (Ohtsuki et al., 1995; Halliwell and Gutteridge, 1999). Brain mitochondria consume about 90% of the oxygen used by cells, and the mitochondrial respiratory chain generates high concentrations of reactive oxygen species (ROS) that attack cellular macromolecules, oxidize membranous phospholipids, proteins and DNA (Ohtsuki et al., 1995).
Spontaneously hypertensive rats (SHR) exhibit several abnormalities regarding Ca2+ metabolism. These abnormalities include decrease in Ca2+ level in the serum, hypercalciuria, and alteration in intestinal Ca2+ transport. An increment in [Ca2+]I, had been reported in platelets and lymphocytes from hypertensive humans and in SHR (Arab et al., 1990). In mitochondria the basal matrix Ca2+ concentration is significantly lower in heart and kidney tissues from SHR compared to normotensive control animals (Aguilera-Aguirre et al., 2002). Over production of ROS in respiratory chain of brain mitochondria during hypertension can impair progressively mitochondrial energy metabolism and may be implicated in the vulnerability of SHR to cerebral ischemia, resulting in a progressive neuronal cell death (Ohtsuki et al., 1995).
Mitochondrial enzymes, such as pyruvate dehydrogenase, NAD(P)+-dependent isocitrate dehydrogenase, 2-oxoglutarate dehydrogenase, and mitochondrial nitric oxide synthase (mtNOS) can be activated by increase in Ca2+ level (Hansford and Zorov, 1998; Ghafourifar and Cadenas, 2005). mtNOS catalyzes the oxidation of l-arginine to nitric oxide (NO•) and citrulline. NO• is a free radical that binds to cytochrome c oxidase (complex IV) of the mitochondrial electron transport chain to inhibit respiration by competitive action with oxygen in complex IV, and therefore regulates the membrane potential (ΔΨ) and ATP synthesis (Giulivi et al., 1998; Ghafourifar and Richter, 1999; Aguilera-Aguirre et al., 2002; Calderón-Cortés et al., 2006). mtNOS and the enzymes mentioned above regulate ATP synthesis to support cellular energetic requirements (Bringold et al., 2000; Traaseth et al., 2004).
The goal of this study was to address the hypothesis that during hypertension, [Ca2+]m and Ca2+-regulated NOS activity are altered in brain mitochondria by the impairment on ΔΨ establishment, due to decreased mitochondrial electron transport chain at the level of complex IV.
In this study we utilized healthy young, pre-hypertensive (1-month) and adult (7-months) rats with established hypertension (middle age, spontaneously hypertensive: SHR). In control experiments, the normotensive Wistar Kyoto (WKY) rats were used (1- and 7-months-old), We studied whether Ca2+-driven NO•-mediated inhibition of complex IV activity could alter calcium transport-energy dependent mitochondrial function in brain of rats, which may be related to augmentation of blood pressure.
2. Materials and methods
2.1. Chemicals
EGTA, KH2PO4, MgCl2, mannitol, sucrose, bovine serum albumin (fatty acid free), MOPS, sodium deoxycholate, percoll, calcium chloride, KH2PO4, succinic acid, arsenazo III, safranine, rotenone, antimycin-A, ascorbic acid, ruthenium red (RR), N,N,N,N-tetramethyl-p-phenylenediamine (TMPD), carbonylcyanide-m-chlorophenylhydrazone (CCCP), and potassium cyanide (KCN) were purchased from Sigma Chemical Co. Stigmatellin was obtained from Fluka Biochemika. 4-(6-Acetoxymethoxy-2,7-dichoro-3-oxo-9-xanthenyl)-4′-methyl2,2′-(ethylene dioxy)dianiline-N,N,N′,N′-tetraacetic acid tetrakis (acetoxymethyl) ester (Fluo-3/AM), S-nitroso-N-acetylpenicilamine (SNAP), and pluronic acid were purchased from Molecular Probes.
2.2. Animals
Normotensive genetic control (WKY) and SHR rats of 1-and 7-months of age were fed ad libitum and kept under controlled conditions of light:darkness in our animal facilities. All animal procedures were conducted in accordance with our Federal Regulations for the Use and Care of Animals (NOM-062-ZOO-1999, Ministry of Agriculture, Mexico), and were approved by the Institutional Committee of the Universidad Michoacana de San Nicolás de Hidalgo, on the use of animals. Systolic blood pressure was determined by plethysmography.
2.3. Isolation of rat brain mitochondria
Brain mitochondria were isolated by differential centrifugation in a Percoll gradient as described (Thakar and Hassan, 1988; Sims, 1990). Briefly, rats were decapitated and the brain was extracted and placed in a cold medium that contained 210 mM mannitol, 70 mM sucrose, 1 mM EGTA, 0.5% bovine serum albumin, 10 mM MOPS (pH 7.4). The brain was homogenized manually in a glass homogenizer and centrifuged at 400g; the supernatant was centrifuged at 9000g. Centrifugations were carried out for 10 min at 4 °C. The pellet was suspended in 15% Percoll and placed in a discontinuous Percoll gradient (23 and 40%). The gradient was centrifuged at 30,700g, 15 min. at 4 °C, and mitochondria were isolated, diluted 1:4, centrifuged and washed at 16,700g in the isolation medium to which 0.5% bovine serum albumin had been added, followed by centrifugation at 6900g for 10 min. Mitochondrial protein concentration was measured by the Lowry technique (Lowry et al., 1951). The purity of mitochondrial preparations was assessed by Western blotting. The endoplasmic reticulum marker calreticulin was present in crude tissue preparations but was decreased to insignificant amounts in purified mitochondria. In contrast, the mitochondrial marker cytochrome c oxidase was highly enriched in mitochondrial preparations.
2.4. Measurement of free intramitochondrial calcium
Brain mitochondria (0.125 mg/ml) were incubated in a medium (210 mM mannitol, 70 mM sucrose, 0.5% bovine serum albumin, 10 mM MOPS) with 10 µM Fluo-3/AM and 0.003% pluronic acid in presence of 10 mM succinate as substrate, and 2 µM rotenone (complex I inhibitor) for 20 min at 25 °C with shaking at 80 rpm. Mitochondria were then centrifuged and washed twice in an Eppendorf microfuge for 2 min and re-suspended in the medium. Fluorescence of mitochondrial suspensions were measured in a Shimadzu RF5000U spectrofluorometer; excitation wavelength was 506 nm (slit 10 nm) and emission wavelength 526 nm (slit 10 nm). Intramitochondrial free Ca2+ ions were determined by measuring the fluorescence minimum by addition of EGTA/deoxycholate, DOC (0.6 mM/0.05%) and the fluorescence maximum by subsequent addition of 5 mM Ca2+. The computer program Winmax (Patton, 1999) was used to determine the concentrations of extramitochondrial free Ca2+ that were added. Quantification of mitochondrial matrix Ca2+ was determined as described (Saavedra-Molina et al., 1990) and the relative percentage of Ca2+ concentration was calculated with respect to Ca2+ basal concentration.
2.5. Uptake and release of mitochondrial calcium
Ca2+ movements across the inner mitochondrial membrane were followed with an Aminco DW-2a UV/VIS spectrophotometer at 675–685 nm with Arsenazo III as indicator (Bringold et al.,2000; Ghafourifar, 2002). Purified brain mitochondria (0.3 mg of mitochondrial protein/ml) was suspended in an incubation medium (210 mM mannitol, 70 mM sucrose, 0.5% bovine serum albumin, 10 mM MOPS (pH 7.4), 5 mM KH2PO4, 1 mM MgCl2) and energized with 10 mM succinate in presence of 2 µM rotenone. Ca2+ uptake was initiated by repeated additions of 80 nmol Ca2+ and once net uptake was completed, 0.5 mM EGTA was added to sequester Ca2+ (Ghafourifar, 2002).
2.6. Determination of mitochondrial transmembrane potential
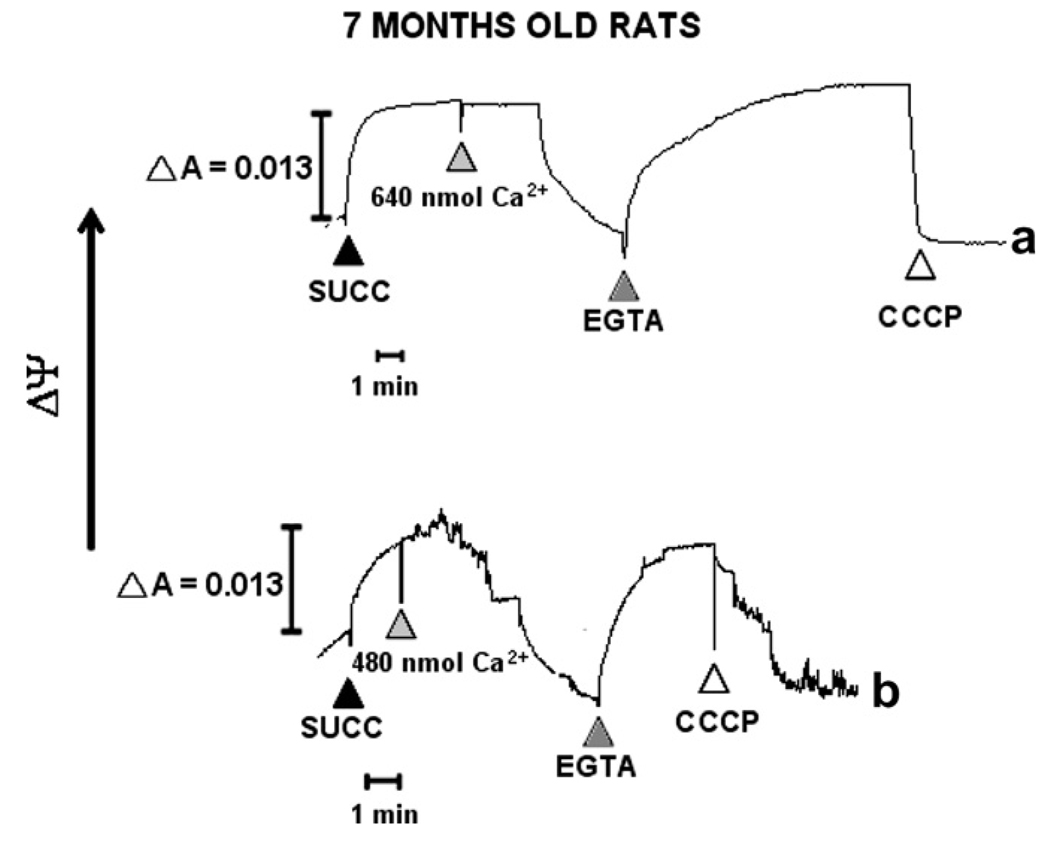
The mitochondrial mΔΨ was measured using safranine in an Aminco DW-2a UV/VIS spec at 533-511 nm. Brain mitochondria (0.3 mg/ml) suspensions were incubated in a medium containing 210 mM mannitol, 70 mM sucrose, 0.5% bovine serum albumin, 10 mM MOPS, 5 mM KH2PO4, 1 mM MgCl2, and 2 µM rotenone as complex I inhibitor. Ten micromolar safranine was added to mitochondria. Mitochondria suspension was energized by addition of 10 mM succinate. Mitochondrial ΔΨ was assessed by determining changes in safranine absorbance in presence of respiratory substrate. Energized mitochondria suspension was exposed to increasing concentrations of Ca2+ (160, 480, and 640 nmol Ca2+) to determine changes in ΔΨ due to Ca2+ uptake. 0.5 mM EGTA was added to sequester Ca2+. The uncoupler CCCP (1 µM) was added to collapse ΔΨm (Rottenberg and Marbach, 1989; Bringold et al., 2000).
2.7. Measurement of oxygen consumption
Ca2+-dependent mitochondrial nitric oxide synthase (mtNOS) regulates mitochondrial oxygen consumption through competitive inhibition of complex IV. Oxygen consumption was determined polarographically with a Clark-type electrode placed in a 2 ml chamber at 30 °C under continuous stirring, in an air-saturated phosphate buffer (50 mM KH2PO4). Complex IV activity was measured by oxygen consumption in the presence or absence of inhibitors of complex I and III. Brain mitochondria (0.3 mg/ml) were incubated in a phosphate buffer (50 mM KH2PO4). Complex I was inhibited with 2 µM rotenone. Complex III was inhibited by 2 µg/ml antimycin-A and 1 µg/ml stigmatellin. TMPD is an ascorbate-reducible redox carrier that transfers electrons directly to cytochrome c. Addition of TMPD (50 µM) and ascorbate (5 mM) to the antimycin A-stigmatellin inhibited mitochondria allows the measurement of oxygen consumption through complex IV. Endogenous inhibition of complex IV by mtNOS was accomplished when increasing concentrations of Ca2+ were added (stimulated NO• synthesis) (Dedkova et al., 2004; Ghafourifar, 2002). KCN and SNAP was used to inhibit complex IV (Sigel and Carafoli, 1979; Madapallimattam et al., 2002; Cortés-Rojo et al., 2007).
2.8. Measurement of l-citrulline synthesis
Nitric oxide synthase catalyzes the oxidation of l-arginine to l-citrulline and NO•. Therefore, the production of l-citrulline is used as an indirect determination of NO•. l-Citrulline production was determined as described by Knipp and Vasak (2000), in a medium containing 190 mM mannitol, 5 mM KH2PO4, 15 mM KCl, 3 mM MgCl2, 10 mM MOPS (pH 7.4), plus 10 mM succinate, and 2 µM rotenone. Brain mitochondria were incubated 1 h at 30 °C, in a shaking bath (30 rpm), in the presence of different concentrations of Ca2+ (80, 160, 240, 320, 400, and 480 nmol). Basal values of l-citrulline were obtained without exogenous addition of Ca2+ and samples were incubated during the same time. l-Citrulline was quantified in a Perkin–Elmer Lambda 10 spectrophotometer at 530 nm using a calibration curve.
2.9. Statistical analysis
Statistical differences of the data were determined with the Student’s t-test and considered statistically significant at p < 0.05.
3. Results
3.1. Intramitochondrial calcium
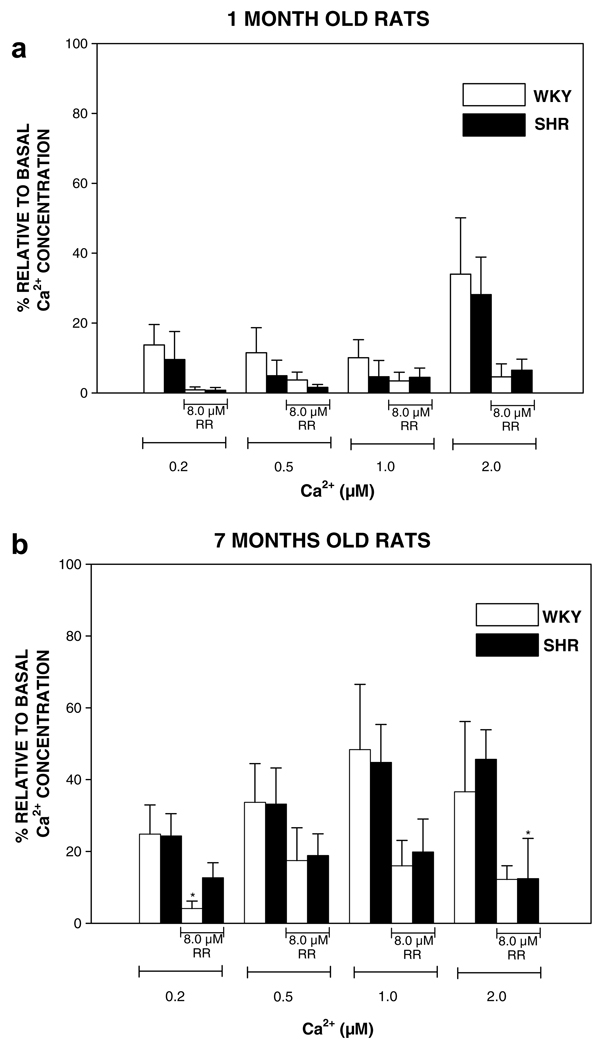
Isolated mitochondria have the capacity to accumulate and retain calcium (Chalmers and Nicholls, 2003). Here, we studied calcium transport and accumulation in freshly isolated brain mitochondria of SHR animals before the onset of hypertension (healthy 1-month) and when hypertension is established (7-months), which had a blood pressure of 125 ± 3 mmHg and 203 ± 14 mmHg, respectively. Age-matched WKY rats were used as normotensive control. Fig. 1 shows [Ca2+]m levels in WKY and SHR of different ages. Level of [Ca2+]m in 1-month SHR was lower than in healthy rats, though the results are statistically nonsignificant at all (0.2, 0.6, 1.0, 2.0 µM) Ca2+ concentrations (Fig. 1a). Non-significant differences were observed between SHR and WKY rats at age 7-months (Fig. 1b). Addition of RR, an inhibitor of the calcium uniporter (Bringold et al., 2000) caused a reduction in [Ca2+]m (Fig. 1a and b).
Fig. 1.
Measurement of free intramitochondrial Ca2+. Free mitochondrial Ca2+ concentration was followed spectrofluorometrically with Fluo-3/AM as indicator. (a and b) One- and 7-months old rats, respectively. Eight micromolar Ruthenium red (RR) was added to mitochondria. Several different concentrations of free Ca2+ were added (calculated with Winmax computer program) to mitochondria (0.125 mg/ml). Minimal and maximal fluorescence was determined by the addition of 0.6 mM EGTA/0.05% DOC and 5 mM Ca2+, respectively. Wistar Kyoto normotensive genetic control (WKY) and spontaneously hypertensive (SHR) rats were compared. Each point represents the mean ± SEM of 3–5 separate experiments. *p < 0.05 vs. respective control values.
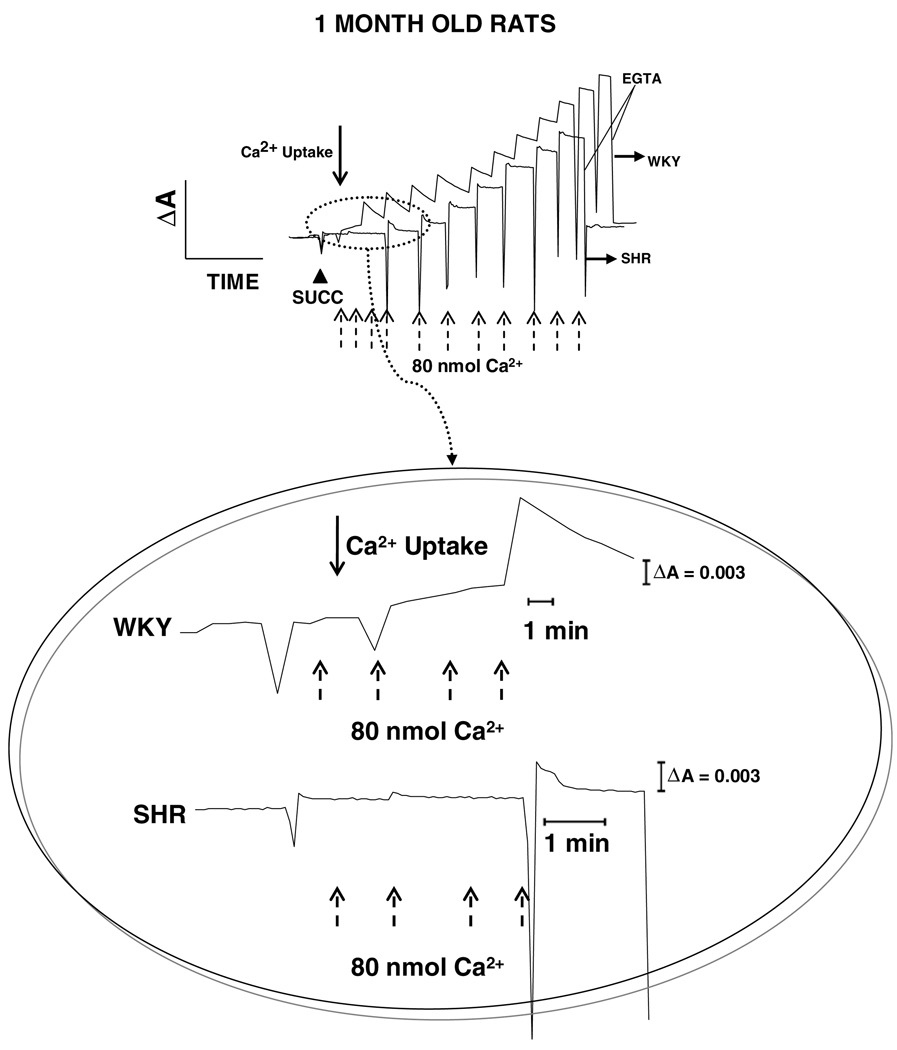
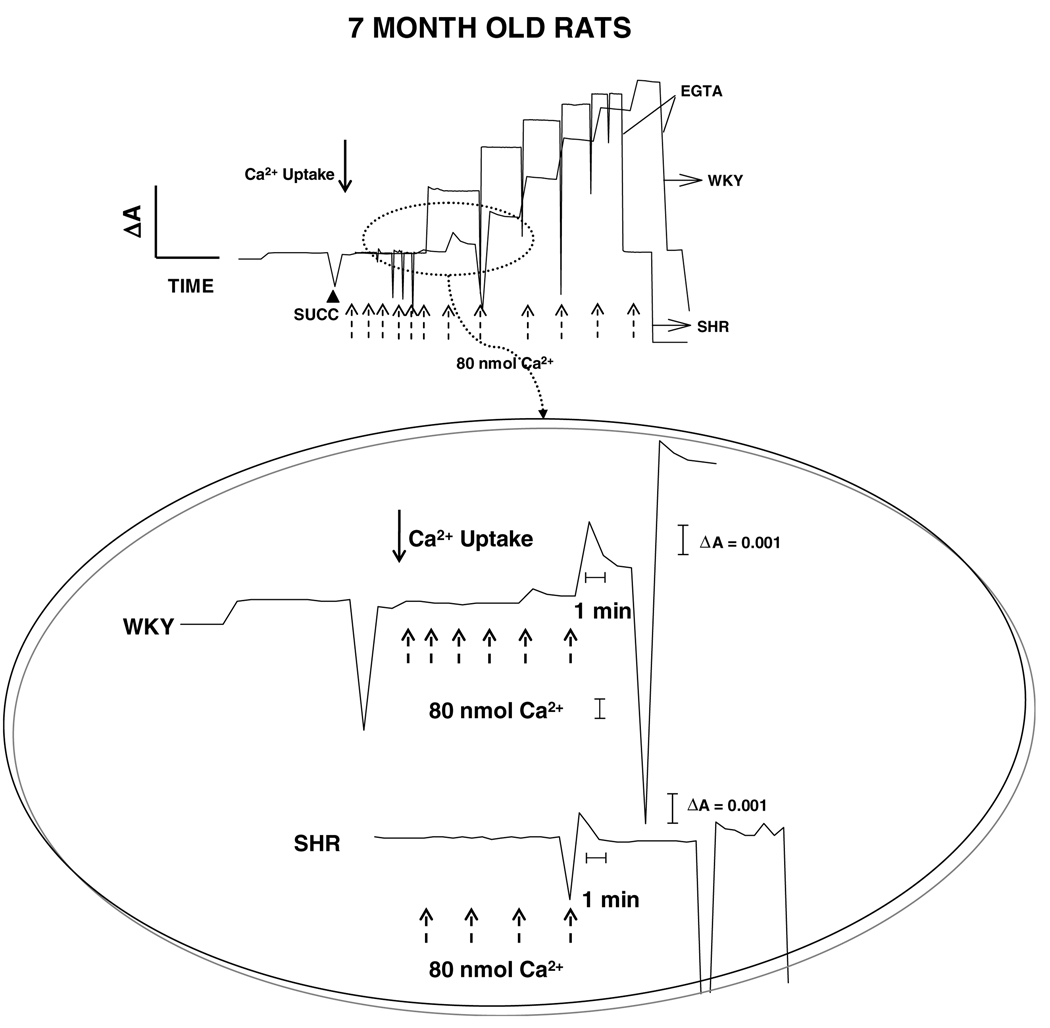
These findings were corroborated by qualitative measurements of Ca2+ uptake and release using Arsenazo III as an indicator. Fig. 2 shows Ca2+ uptake plots of WKY and SHR brain mitochondria for 1-month old rats. The trace of Ca2+ uptake was started when mitochondria were incubated with Arsenazo III and line base in the trace was observed, which represent Arsenazo III-mitochondria absorbance. Succinate was added to energize mitochondria and allow Ca2+ uptake (McCormack and Denton, 1993). In both WKY and SHR mitochondria, Ca2+ uptake was instantaneous during first three additions. However, Ca2+ uptake was more efficient in WKY mitochondria (zoom, Fig. 2), which is evident when a drop on absorbance is observed after seven times addition of 80 nmol Ca2+ until a saturating intramitochondrial Ca2+ concentration was reached. By other hand, hypertensive rats showed a relative resistance to Ca2+ uptake, which is observed as an absence of significant changes in absorbance after six-times addition of 80 nmol Ca2+ (zoom, Fig. 2). Fig. 3 shows plots for mitochondrial Ca2+ uptake of WKY and SHR 7-months rats. As well as in 1-month rats, repetitive additions of 80 nmol of Ca2+ (three and five additions for WKY and SHR, respectively) were rapidly taken in both groups, which is evident as an absence of changes in absorbance during these additions. WKY 7-months rat mitochondria showed a better efficiency in Ca2+ uptake than age-matched SHR mitochondria. However, in comparison to 1-month WKY rat mitochondria, both 7-months WKY and SHR mitochondria showed a lower efficiency in Ca2+ uptake, which is observed as a lower drop in absorbance after repetitive addition of 80 nmol Ca2+ during 6–8 times in both cases (see zoom, Fig. 3).
Fig. 2.
Uptake and release of mitochondrial Ca2+. Ca2+ movement across the inner mitochondrial membrane was followed spectrophotometrically with Arsenazo III as indicator. One-month old normotensive genetic control (WKY) and spontaneously hypertensive (SHR) rats were compared. Mitochondria (0.3 mg/ml) were energized with 10 mM succinate (▲ succ) in the presence of rotenone (not shown). Thereafter, 80 nmol of Ca2+ was added for several times which is indicated with arrows. Once net uptake was completed, 0.5 mM EGTA was added to sequester Ca2+. The graph inside the circle shows a zoom corresponding to a more detailed view of the first portion of the plots. Five separate experiments were carried out in duplicates. A representative trace is shown.
Fig. 3.
Uptake and release of mitochondrial Ca2+. Ca2+ movement across the inner mitochondrial membrane was followed spectrophotometrically with Arsenazo III as indicator. Seven-months old normotensive genetic control (WKY) and spontaneously hypertensive (SHR) rats were compared. Mitochondria (0.3 mg/ml) were energized with 10 mM succinate (▲ succ) in the presence of rotenone (not shown). Thereafter, 80 nmol of Ca2+ was added for several times which is indicated with arrows. Once net uptake was completed, 0.5 mM EGTA was added to sequester Ca2+. The graph inside the circle shows a zoom corresponding to a more detailed view of the first portion of the plots. Five separate experiments were carried out in duplicates. A representative trace is shown.
3.2. Mitochondrial membrane potential in SHR rats
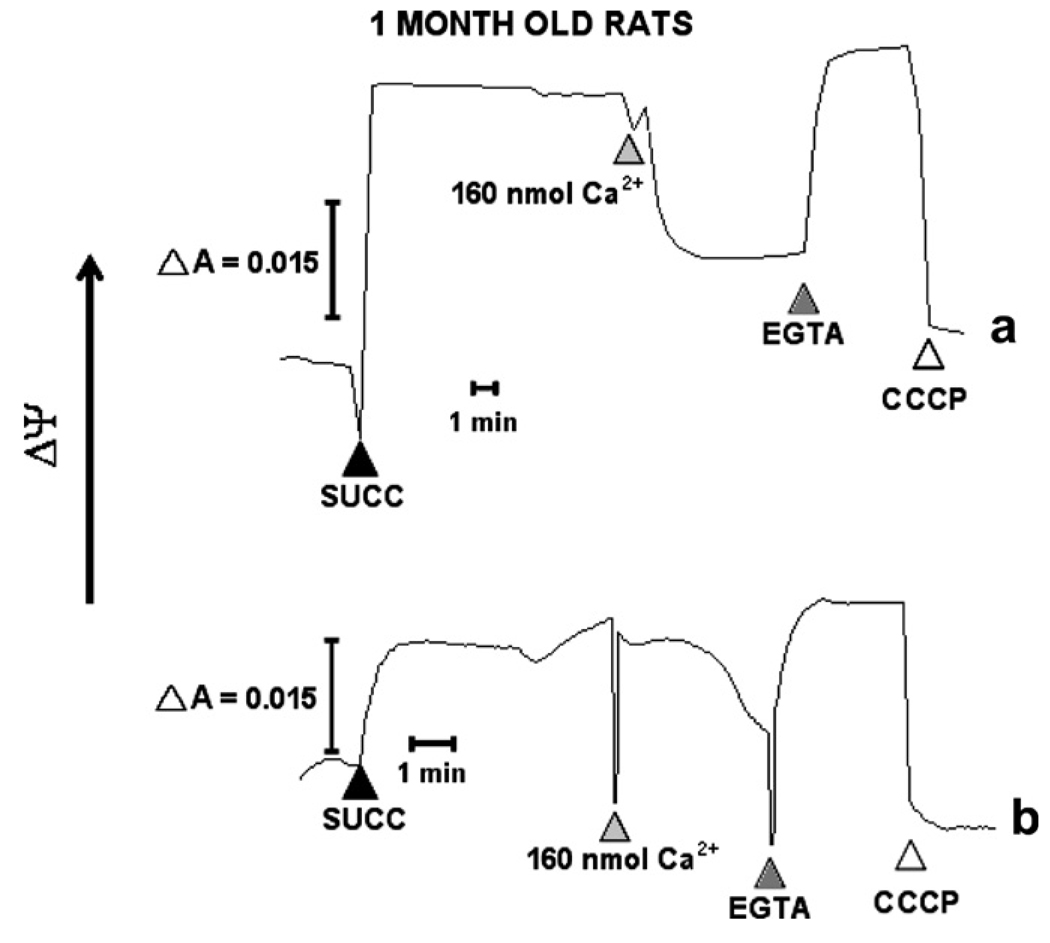
Mitochondrial Ca2+ uptake is an energy dependent process driven by the electrical potential produced by the mitochondrial respiratory chain (Nicholls, 2004, 2005). In this study, we investigated the mΔΨ of brain mitochondria during the development of hypertension using the cationic dye safranine. Mitochondria were incubated in a medium with safranine and rotenone to inhibit the complex I. The addition of succinate to energize mitochondria increased mΔΨ. Fig. 4 shows two representative traces of mΔΨ in 1-month WKY and SHR rats. These results show a significant difference in mΔΨ between 1-month SHR and WKY rats, where 1-month SHR rats present a lower mΔΨ of approximately one half of mΔΨ generated in WKY mitochondria (Fig. 4b). These data also show the abolition of mΔΨ when 160 nmol of Ca2+ was added to mitochondria, being the drop in mΔΨ fast in WKY and gradual in SHR mitochondria.
Fig. 4.
Mitochondrial membrane potential (mΔΨ) measurements. mΔΨ was followed spectrophotometrically with the indicator safranine. Mitochondria (0.3 mg/ml) were de-energized with rotenone (not shown) and subsequently energized with 10 mM succinate (▲ succ). After addition of 160 nmoles Ca2+ to 1-month old (a) WKY and (b) SHR rats and establishing a stable mΔΨ, 0.5 mM EGTA (▲) and CCCP (∆) (carbonyl cyanide m-chlorophenylhydrazone) were added to the mitochondria with collapsed mΔΨ. Five separate experiments were carried out in duplicates. A representative trace is shown.
In 1-month WKY rats and SHRs mΔΨ was recovered by the addition of EGTA. Mitochondrial function was tested through addition of CCCP, which rapidly abolished mΔΨ in both cases. To determine the effect of established hypertension, mΔΨ was measured in 7-months of WKY and SHR rats. After succinate addition, mΔΨ was established in a fast way in WKY mitochondria and gradually in SHR rats (Fig. 5a and b). Results showed no difference between SHR and WKY rats. On the other hand, to depolarize WKY and SHR mitochondria, additions of 640 and 480 nmol Ca2+ were needed, respectively. mΔΨ was recovered in a faster way in SHR mitochondria than in WKY mitochondria after addition of EGTA. mΔΨ dissipation achieved with CCCP was faster in WKY mitochondria than in SHR mitochondria.
Fig. 5.
Mitochondrial membrane potential (mΔΨ) measurements. mΔΨ was followed spectrophotometrically with the indicator safranine. Mitochondria (0.3 mg/ml) were de-energized with rotenone (not shown) and subsequently energized with 10 mM succinate (▲ succ). After addition of 640 and 490, 160 nmoles Ca2+ to 7-months old WKY and SHR rats, respectively, and establishing a stable mΔΨ, 0.5 mM EGTA (▲) and CCCP (∆) (carbonyl cyanide m-chlorophenylhydrazone) were added to the mitochondria with collapsed mΔΨ. (a) WKY and (b) SHR rats were compared. Five separate experiments were carried out in duplicates. A representative trace is shown.
Taken together these results showed that the Ca2+ concentration required to inhibit the transmembrane potential was greater as age increased (Figs. 4b and 5b). There were no differences in mΔΨ between age groups in SHR; however, mΔΨ in 7-month-old WKY was lower than in the 1-month-old WKY rats (Figs. 4a and 5a).
3.3. Mitochondrial activity of cytochrome c oxidase and nitric oxide synthase
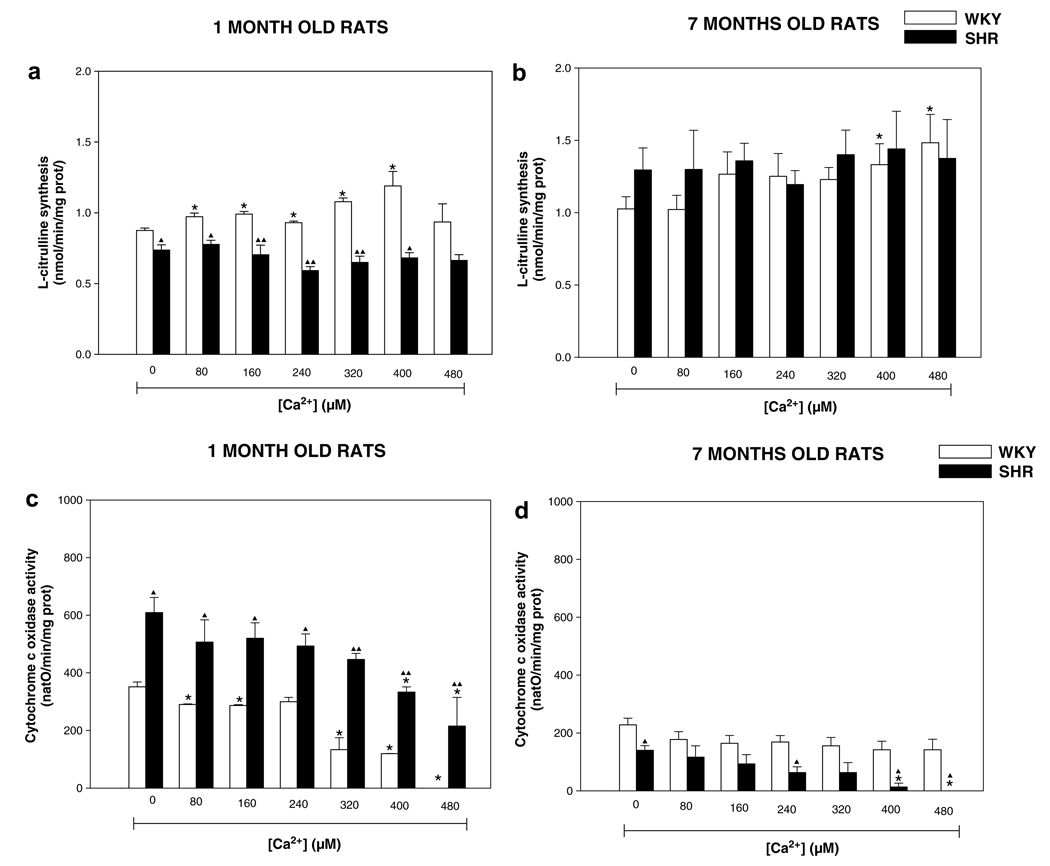
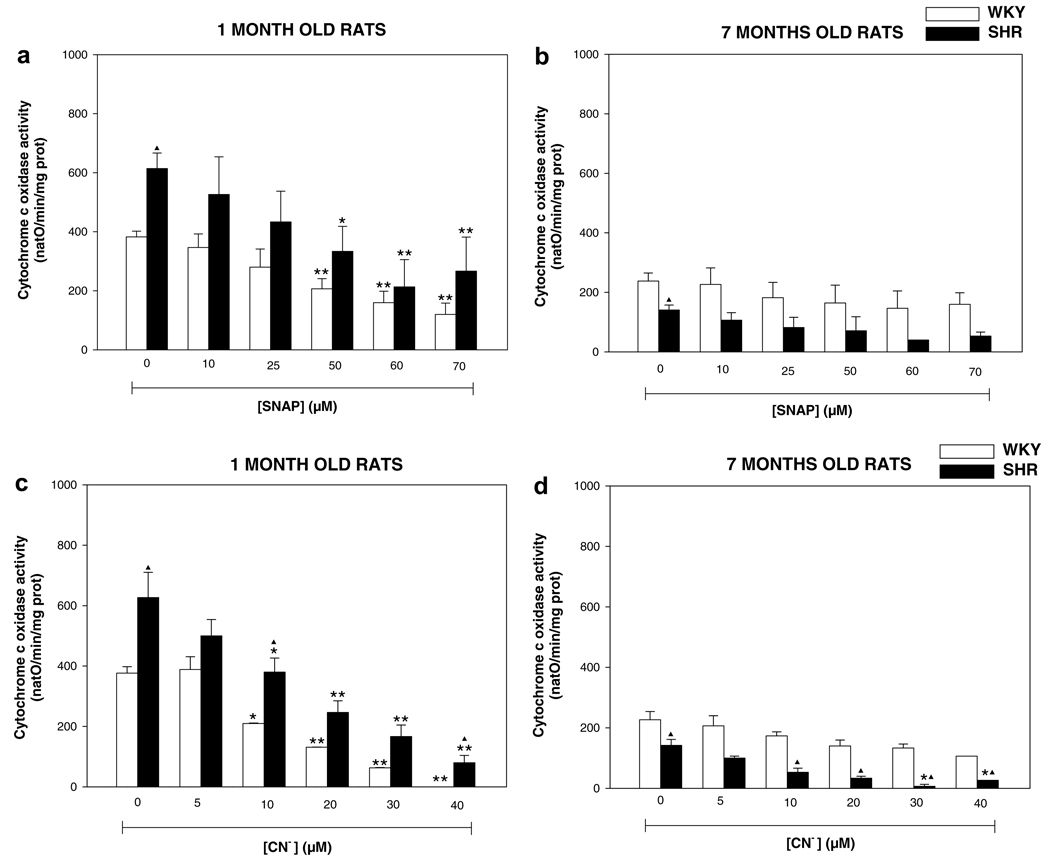
mtNOS is activated at increased mitochondrial Ca2+ uptake/levels (Dedkova et al., 2004; Kanai et al., 2004). Therefore, we evaluated whether increased Ca2+ uptake in mitochondria of SHR and WKY rats affected Ca2+-dependent mtNOS activity and NO-sensitive complex IV activity. Fig. 6 shows the results of l-citrulline production and complex IV activity of WKY and SHR for 1- and 7-months old rats. One month WKY and SHR basal value of l-citrulline were 0.87 ± 0.01 and 0.73 ± 0.03 nmol/min/mg prot, respectively (Fig. 6a). While in 7-months rats the basal value found for l-citrulline were 1.03 ± 0.08 (WKY) and 1.29 ± 0.15 nmol/min/mg prot (SHR). Addition of Ca2+ evoked significant (p < 0.05) NO• production (l-citrulline) in 1-month WKY rats, whereas SHR of the same age did not show changes of l-citrulline synthesis with different addition of Ca2+ (Fig. 6a). In contrast, 7-months WKY and SHR showed non-significant increments in l-citrulline levels with different concentration of Ca2+ (Fig. 6b). However, basal value of l-citrulline in 7-months SHR was higher than 1-month SHR (p < 0.05) (Fig. 6a and b). On the other hand, the basal values of complex IV activity in 1-month rats were 351.7 ± 16.6 natO/min/mg prot for WKY and 609.2 ± 52.4 natO/min/mg prot for SHR (Fig. 6c). Seven-months WKY and SHR rats showed a basal activity of complex IV of 228.3 ± 22.9 (WKY) and 140.0 ± 16.0 natO/min/mg (SHR) (Fig. 6d). Consecutive additions of Ca2+ provoked a progressive inhibition of complex IV activity in WKY rats of 1-month and full inhibition was observed at 480 nmol Ca2+ (p < 0.05), whereas 1-month SHR exhibited a poor response of complex IV activity to consecutive additions of Ca2+ and full inhibition of the activity was not observed even at 480 nmol Ca2+ (Fig. 6c). Seven-months SHR complex IV activity was fully inhibited with 480 nmol of Ca2+, whereas 7-months WKY are insensitive to any concentration of Ca2+ (Fig. 6d). These results suggest that Ca2+ concentration needed to stimulate production of mitochondrial NO• and subsequent inhibition of complex IV by this species is different in healthy and hypertensive animals. To verify that complex IV inhibition was due to increased mitochondrial NO• production in response to mitochondrial Ca2+ uptake, synthesis of NO was tested in the presence of 100 µM L-NMMA, a competitive inhibitor of mtNOS (Ghafourifar, 2002). We found that L-NMMA augmented complex IV activity in mitochondria of 7-months WKY and 7-months SHR (data not shown); indicating that inhibition of oxygen consumption was indeed due to mtNOS activation in response to Ca2+ uptake. In the case of the young SHR and WKY rats, oxygen consumption was not affected by L-NMMA. These results showed both different basal activity and susceptibility to inhibition of complex IV activity between strains and age. Therefore it was investigated if differences in complex IV activity could be associated to differential sensitivity of this complex to NO• during hypertension. Oxygen consumption was measured in the presence of different concentrations of the NO• donor SNAP, and CN−, which are inhibitors of binuclear CuB haem aa3 center in complex IV (Fig. 7). The results of complex IV activity in 1-month WKY and 1-month SHR showed to be more susceptible to inhibition for different concentrations of NO• and CN−, and presented differential susceptibility to both inhibitors (Fig. 7a and c) (p < 0.05), whereas 7-months rats showed an no susceptible inhibition for both NO• and CN− (Fig. 7b and d), which means that 1-month rats WKY and SHR requires lower concentrations of NO• and CN− to inhibit complex IV, whereas both WKY and SHR rats of 7-month-old required higher concentrations of these inhibitors. These data suggest an alteration in the CuB haem aa3 center in complex IV in 7-month-old WKY and SHR rats.
Fig. 6.
Mitochondrial activity of nitric oxide synthase (mtNOS) and cytochrome c oxidase (complex IV). Mitochondrial protein (0.3 mg/ml) were incubated in presence of different concentrations of Ca2+ 80, 160, 240, 320, 400, and 480 nmol in the medium as described in Section 2. mtNOS was evaluated measured the production of l-citrulline in (a) 1-month old and (b) 7-months old rats. Complex IV was evaluated measuring oxygen consumption of purified mitochondria isolated from rat brain of (c) 1-month old and (d) 7-months old WKY and SHR. WKY, Wistar Kyoto; SHR, Spontaneously hypertensive rats. Results are the means ± SEM of 3–6 separate experiments in duplicates. *p < 0.05, **p < 0.01 vs. control values and ▲▲p < 0.01 vs. strains of same age.
Fig. 7.
Mitochondrial activity of cytochrome c oxidase (complex IV). Complex IV was evaluated measuring oxygen consumption of purified mitochondria isolated from rat brain. Mitochondrial (0.3 mg/ml) were incubated in phosphate buffer, pH 7.4, at room temperature. Complex I was inhibited with rotenone. Complex III was inhibited with antimycin A, and stigmatellin. Subsequently, TMPD was added and the reaction was started by the addition of reduced ascorbate. Concentrations of 10, 25, 50, 60, and 70 µM of NO• donor (SNAP) were used in (a) 1-month old and (b) 7-months old rats, and concentrations of 5, 10, 20, 30, and 40 µM cyanide (CN−) were used in (c) 1-month old and (d) 7-months old rats. Results are the means ± SEM of 3–6 separate experiments in duplicates. *p < 0.05, **p < 0.01 vs. control values and ▲p < 0.01 vs. strains of same age.
4. Discussion
The respiratory chain of mammalian mitochondria consists of a series of electron carriers, most of which are integral membrane proteins, capable of accept and donate electrons (Nicholls and Ferguson, 2002). Cytochrome c oxidase (complex IV) is the terminal electron acceptor in mitochondria respiratory chain. During catalysis of this complex, cytochrome c is oxidized, oxygen is reduced to water and redox energy is converted to a proton motive force, which drives ATP synthesis (Cooper, 2002). NO• is a reversible inhibitor of complex IV, competing with oxygen for binding at the binuclear CuB/cytochrome aa3 site (Nicholls and Ferguson, 2002). Therefore, NO• is an active modulator of mitochondrial respiration and ATP synthesis. Key hallmarks of mitochondrial dysfunction are decreased expression of mitochondrial components and defects in the assembly of respiratory complex. The mitochondrial dysfunction has been increasingly associated with the development of hypertension (Lopez-Campistrous et al., 2008). This pathological process induces abnormalities in Ca2+ metabolism (Arab et al., 1990), including [Ca2+]m levels, which may affect activity of intramitochondrial enzymes like mtNOS and thus the energy production by the mitochondria. On the other hand, brain is highly susceptible to oxidative damage because its lower antioxidant capacity and higher oxygen uptake when compared with other organs (Halliwell and Gutteridge, 1999), which could contribute to mitochondrial injury and neuronal degeneration (Ohtsuki et al., 1995). These facts lead us to search if mitochondrial dysfunction is in part caused by functional defects in complex IV activity during hypertension, which could altered mΔΨ and, as a consequence, Ca2+ mitochondrial uptake and activity of mtNOS. We found that basal activity of complex IV was higher in 1-month SHR than 1-month WKY rats (Fig. 6a); this result correlate with the lower production of NO• in the same group of rats (Fig. 6a) and corroborate previous results from our laboratory (Calderón-Cortés et al., 2006), which indicate that in brain mitochondria from hypertensive rats the activity of mtNOS was lower in 1-month SHR than in healthy rats of the same age. Thus, if mitochondrial NO• concentration in SHR mitochondria was lower due to decreased activity of mtNOS, regulation of complex IV by this radical could not be possible. Contrary to these results, the SHR rats of 7-months old showed an increased activity of mtNOS (Fig. 6b) in comparison with its normotensive control (7-months WKY), which contributed a decrease on oxygen consumption (Fig. 6d). The results in 7-months old rats suggest that complex IV activity could decrease as age and hypertension occur. The activity of mtNOS in 1-month WKY rats exhibited a significant (p < 0.05) concentration-dependent response to Ca2+ (Fig. 6a); however, 1-month SHR and 7-months WKY and SHR rats did not show changes in mtNOS activity in response to exogenous addition of Ca2+ (Fig. 6a and b), which may explain the insensitivity of the NO•-mediated complex IV inhibition by Ca2+ in these groups of rats (Fig. 6c and d). These results lead us to thought that Ca2+ uptake is diminished before and after hypertension is established in SHR, which was corroborated when lower Ca2+ uptake and [Ca2+]m level were observed in brain SHR mitochondria of 1 and 7-months when compared with WKY rats (Figs. 1a and 2). These results are in agreement with previous reports (Arab et al., 1990), in which Vmax of Ca2+ uptake in jejunal mitochondria was found decreased in SHR during suckling and weaning periods, before the development of hypertension and in hypertensive adult SHR.
Ca2+ uptake in brain mitochondria of 7-months SHR and WKY rats was found decreased compared to 1-month WKY rats (Figs. 2 and 3), suggesting that calcium handling is disrupted by both hypertension and age, which would contribute to progressive cell damage because mitochondria play an important role buffering cytosolic calcium concentration.
In addition, we found a differential activity of complex IV between WKY and SHR rats in presence or absence of Ca2+. Consequently, it was important to know if this activity change was due to differences in the sensitivity of complex IV to substrate binding at the binuclear CuB haem aa3 center, which is the site of binding for inhibitors like NO• and CN−. The results of complex IV activity in the presence of different concentrations of NO• and CN− show that 1-month-WKY and 1-month-SHR rats are more susceptible to inhibition than 7-months SHR and WKY rats (Fig. 7). These results suggest that the activity of complex IV is affected in its haem aa3/CuB binuclear center when hypertension is established, which could be possibly related with assembly defects of this complex during hypertension and contributing to mitochondrial dysfunction in brain mitochondria (Lopez-Campistrous et al., 2008). In the case of 1-month rats we found a similar NO• and CN− sensitivity between both rat strains (Fig. 7a and c). However, 1-month SHR rats showed an increased activity of complex IV due to a lower Ca2+-dependent production of NO• (Fig. 6a and c). The decreasing of Ca2+ uptake in this case could be attributed to defects of assembly in the other respiratory complexes (I and III) as reported for Lopez-Campistrous et al. (2008), which could affected mΔΨ and then levels of Ca2+ (Figs. 1a and 2).
Mitochondria are the center of bioenergetics interactions that control several functions in cells. Three fundamental functions, ATP generation, Ca2+ uptake and the generation and detoxification of ROS, are driven by the mitochondrial mΔΨ (Nicholls, 2004). The mΔΨ is driving force for the uptake of Ca2+, therefore, we investigated the relationship between mΔΨ and [Ca2+]m. Our results show a difference in mitochondrial functionality in pre-hypertensive rats, as evidenced by a lower mΔΨ in SHR 1-month rats when compared to normotensive rats. As well, a gradual drop in mΔΨ due to uptake of 160 nmol of Ca2+ was observed in SHR mitochondria, which was in contrast with the rapid mΔΨ collapse presented at the same Ca2+ concentration in WKY 1-month rat. Therefore, these data suggest a disturbance in Ca2+ uptake of 1-month SHR rats, which may be explained by lower mΔΨ found in these rats and support the results where the Ca2+ levels and its uptake were lower in 1-month SHR rats (Figs. 1 and 2). There were no differences in mΔΨ between 1 and 7-months SHR; however, Ca2+ concentration necessary for mΔΨ collapse was higher in 7-months rats than in 1-month rats (Figs. 4b and 5b). In 7-months normotensive rats the mΔΨ was similar to that found in SHR (Fig. 5a and b), suggesting that age could lead to progressive mitochondrial damage that could be related with mitochondrial dysfunction reported for mice with accelerated senescence (Nakahara et al., 1998). It is well known that overproduction of ROS in respiratory chain of brain mitochondria during hypertension impairs mitochondrial energy metabolism (Ohtsuki et al., 1995). Increased ROS generation corroborates our results because impaired mitochondrial function may lead to mitochondrial energy insufficiency resulting in neuronal cell death. mΔΨ in young and hypertensive rats as well as in 7-months WKY rats were lower than WKY rats of 1-month. The relative diminution of mΔΨ would be sufficient to keep the energetic mitochondrial requirement, but this possibility should be explored. Decreased mΔΨ could be attributed to mtNOS activation. However, our results of Ca2+ uptake showed that influx of this cation to mitochondria was affected in 1- and 7-months SHR rats and 7-months WKY rats (Figs. 1–3), which could explain the higher concentrations needed to drop mΔΨ and the differential responses to Ca2+ addition with respect to the rate of mΔΨ collapse (Figs. 4 and 5). The drop mΔΨ in brain mitochondria of WKY and SHR rats due to the addition of Ca2+ excess (160, 480, and 640 nmol Ca2+) was restored by the addition of Ca2+ chelating agents, this suggest that Ca2+ excess did not cause mitochondrial damage, which would be attributed to the relative resistance of brain mitochondria to Ca2+ overload. Accordingly, other studies found that depending on the brain region, mitochondria are differentially sensitive to Ca2+ overload (LaFrance et al., 2005; Brown et al., 2006), without undergoing mitochondrial permeability transition (Berman et al., 2000).
Abnormal mitochondrial calcium uptake and release during hypertension may contribute to mitochondrial injury in the brain and lead to neuron degeneration in SHR. On the other hand, the increased superoxide anion generation in brain mitochondria of SHR combined with deficit in superoxide dismutase activity cause oxidative stress conditions (Ohtsuki et al., 1995), which may damage expression of mitochondrial components and lead to defective assembly of respiratory complexes (Lopez-Campistrous et al., 2008). Hence, these findings may be the underlying cause behind decreased mΔΨ and complex IV activity reported here (Figs. 4–7). Our results demonstrate an association between [Ca2+]m metabolism and mΔΨ that may indicate the importance of this organelle in blood pressure elevation and a crucial role in aging associated hypertension. Alteration of mitochondrial energetics might play a role in vascular aging and aging processes.
Our results suggest that during age-associated hypertension, decreased complex IV activity caused consequent diminishing in mitochondrial inner-membrane potential and changes in ΔΨ-dependent Ca2+ movements, which leads to impairment in the activity of Ca2+-dependent enzymes like mtNOS. The scheme pictured here may be related to progression of mitochondrial energetics metabolism dysfunction and progressive neuronal cell death during hypertension.
In conclusion, our results suggest that pathological and physiological process as age-associated hypertension lead to changes in Ca2+ metabolism injury of respiratory chain enzymes as cytochrome c oxidase activity, which may lead to decrease in mitochondrial inner-membrane potential and consequently changes in Ca2+ metabolism that could be related to progression of mitochondrial dysfunction and neuronal cell death in brain during hypertension.
Acknowledgements
The authors appreciate the partial financial support of CONACYT (43705, ASM and 47481, RVM), Fondos Mixtos CONACYT-Gobierno Estado Michoacán (64277, ASM; 64308, SMA), COECYT (CB0702182_2, ASM) and CIC-UMSNH (2.16, ASM) grants. This work was also supported by P01 AG 021830 (IB) from the U.S NIA. ECC and CCR are CONACYT fellows.
References
- Aguilera-Aguirre L, González-Hernández JC, Pérez-Vázquez V, Ramírez J, Clemente-Guerrero M, Villalobos-Molina R, Saavedra-Molina A. Role of intramitochondrial nitric oxide in rat heart and kidney during hypertension. Mitochondrion. 2002;1:413–423. doi: 10.1016/s1567-7249(02)00002-8. [DOI] [PubMed] [Google Scholar]
- Arab N, Shibata SH, Ghishan FK. Ontogeny of mitochondrial calcium transport in spontaneously hypertensive (SHR) and WKY rats. J. Dev. Physiol. 1990;14:59–67. [PubMed] [Google Scholar]
- Berman SB, Watkins SC, Hastings TG. Quantitative biochemical and ultrastructural comparison of mitochondrial permeability transition in isolated brain and liver mitochondria: evidence for reduced sensitivity of brain mitochondria. Exp. Neurol. 2000;164:415–425. doi: 10.1006/exnr.2000.7438. [DOI] [PubMed] [Google Scholar]
- Bringold U, Ghafourifar P, Richter C. Peroxynitrite formed by mitochondrial NO synthase promotes mitochondrial Ca2+ release. Free Radic. Biol. Med. 2000;29:343–348. doi: 10.1016/s0891-5849(00)00318-x. [DOI] [PubMed] [Google Scholar]
- Brini M. Ca2+ signalling in mitochondria: mechanism and role in physiology and pathology. Cell Calcium. 2003;34:399–405. doi: 10.1016/s0143-4160(03)00145-3. [DOI] [PubMed] [Google Scholar]
- Brown MR, Sullivan PG, Geddes JW. Synaptic mitochondrial are more susceptible to Ca2+ overload than nonsynaptic mitochondria. J. Biol. Chem. 2006;281:11658–11668. doi: 10.1074/jbc.M510303200. [DOI] [PubMed] [Google Scholar]
- Calderón-Cortés E, Clemente-Guerrero M, Sierra-Campos E, Cortés-Rojo C, Gaona-Zamudio FJ, Villalobos-Molina R, Saavedra-Molina A. Functional characterization of brain mitochondrial nitric oxide synthase during hypertension and aging. Amino Acids. 2006;30:73–80. doi: 10.1007/s00726-005-0213-x. [DOI] [PubMed] [Google Scholar]
- Chalmers S, Nicholls DG. The relationship between free and total calcium concentrations in the matrix of liver and brain mitochondria. J. Biol. Chem. 2003;278:19062–19070. doi: 10.1074/jbc.M212661200. [DOI] [PubMed] [Google Scholar]
- Cooper CE. Nitric oxide and cytochrome oxidase: substrate, inhibitor or effector? Trends Biochem. Sci. 2002;27:33–39. doi: 10.1016/s0968-0004(01)02035-7. [DOI] [PubMed] [Google Scholar]
- Cortés-Rojo C, Calderón-Cortés E, Clemente-Guerrero M, Manzo-Avalos S, Uribe S, Boldogh I, Saavedra-Molina A. Electron transport chain of Saccharomyces cerevisiae mitochondria is inhibited by H2O2 at succinate-cytochrome c oxidoreductase level without lipid peroxidation involvement. Free Radic. Res. 2007;41:1212–1223. doi: 10.1080/10715760701635082. [DOI] [PMC free article] [PubMed] [Google Scholar]
- Dedkova EN, Ji X, Lipsius SL, Blatter LA. Mitochondrial calcium uptake stimulates nitric oxide production in mitochondria of bovine vascular endothelial cells. Am. J. Physiol. Cell Physiol. 2004;286:406–415. doi: 10.1152/ajpcell.00155.2003. [DOI] [PubMed] [Google Scholar]
- Ghafourifar P. Methods Enzymol. 359. vol. 31. Elsevier Science; 2002. Characterization of mitochondrial nitric oxide; pp. 339–350. [DOI] [PubMed] [Google Scholar]
- Ghafourifar P, Cadenas E. Mitochondrial nitric oxide synthase. Trends Pharmacol. Sci. 2005;26:190–195. doi: 10.1016/j.tips.2005.02.005. [DOI] [PubMed] [Google Scholar]
- Ghafourifar P, Richter C. Mitochondrial nitric oxide synthase regulates mitochondrial matrix pH. Biol. Chem. 1999;380:1025–1028. doi: 10.1515/BC.1999.127. [DOI] [PubMed] [Google Scholar]
- Ghafourifar P, Saavedra-Molina A. Functions of mitochondrial nitric oxide synthase. In: Lamas S, Cadenas E, editors. Nitric Oxide, Cell Signaling, and Gene Expression. Boca Raton, USA: CRC, Taylor & Francis; 2006. pp. 77–98. [Google Scholar]
- Giulivi C, Poderoso JJ, Boveris A. Production of nitric oxide by mitochondria. J. Biol. Chem. 1998;273:11038–11043. doi: 10.1074/jbc.273.18.11038. [DOI] [PubMed] [Google Scholar]
- Halliwell B, Gutteridge JMC. Free Radicals in Biology and Medicine. third ed. vol. 9. England: Oxford University Press; 1999. Oxidative stress and disorders of the nervous system: general principles and ageing, nutrition, disease and therapy: a role for antioxidants? pp. 721–731. [Google Scholar]
- Hansford RG, Zorov D. Role of mitochondrial calcium transport in the control of substrate oxidation. Mol. Cell Biochem. 1998;184:359–369. [PubMed] [Google Scholar]
- Hougaku H, Matsumoto M, Kitagawa K, Harada K, Oku N, Itoh T, Maeda H, Handa N, Kamada T. Silent cerebral infarction as a form of hypertensive target organ damage in the brain. Hypertension. 1992;20:816–820. doi: 10.1161/01.hyp.20.6.816. [DOI] [PubMed] [Google Scholar]
- Kanai A, Epperly M, Pearce L, Birder L, Zeidel M, Meyers S, Greenberger J, de Groat W, Apodaca G, Peterson J. Differing roles of mitochondrial nitric oxide synthase in cardiomyocytes and urothelial cells. Am. J. Physiol. Heart Circ. Physiol. 2004;286:13–21. doi: 10.1152/ajpheart.00737.2003. [DOI] [PubMed] [Google Scholar]
- Knipp M, Vasak M. A colorimetric 96-well microtiter plate assay for the determination of enzymatically formed citrulline. Anal. Biochem. 2000;286:257–264. doi: 10.1006/abio.2000.4805. [DOI] [PubMed] [Google Scholar]
- LaFrance R, Brustovetsky N, Sherburne C, Delong D, Dubinsky JM. Aged-related changes in regional brain mitochondrial from Fischer 344 rats. Aging Cell. 2005;4:139–145. doi: 10.1111/j.1474-9726.2005.00156.x. [DOI] [PubMed] [Google Scholar]
- Lopez-Campistrous A, Hao L, Xiang W, Ton D, Semchuk K, Sander J, Ellison MJ, Fernandez-Patron C. Mitochondrial dysfunction in the hypertension rat brain. Respiratory complexes exhibit assembly defects in hypertension. Hypertension. 2008;51:412–419. doi: 10.1161/HYPERTENSIONAHA.107.102285. [DOI] [PubMed] [Google Scholar]
- Lowry OH, Rosebrough NJ, Farr AL, Randall RJ. Protein measurement with the folin phenol reagent. J. Biol. Chem. 1951;193:265–275. [PubMed] [Google Scholar]
- Madapallimattam AG, Law L, Jeejeebhoy KN. Effect of hypoenergetic feeding on muscle oxidative phosphorylation and mitochondrial complex I–IV activities in rats. Am. J. Clin. Nutr. 2002;76:1031–1039. doi: 10.1093/ajcn/76.5.1031. [DOI] [PubMed] [Google Scholar]
- McCormack JG, Denton RM. Mitochondrial Ca2+ transport and the role of intramitochondrial Ca2+ in the regulation of energy metabolism. Dev. Neurosci. 1993;15:165–173. doi: 10.1159/000111332. [DOI] [PubMed] [Google Scholar]
- Nakahara H, Kanno T, Inai Y, Utsumi K, Hiramatsu M, Mori A, Packer L. Mitochondrial dysfunction in the senescence accelerated mouse (SAM) Free Radic. Biol. Med. 1998;24:85–92. doi: 10.1016/s0891-5849(97)00164-0. [DOI] [PubMed] [Google Scholar]
- Nicholls DG. Intracellular calcium homeostasis. Brit. Med. Bull. 1986;42:353–358. doi: 10.1093/oxfordjournals.bmb.a072152. [DOI] [PubMed] [Google Scholar]
- Nicholls DG. Mitochondrial membrane potential and aging. Aging Cell. 2004;3:35–40. doi: 10.1111/j.1474-9728.2003.00079.x. [DOI] [PubMed] [Google Scholar]
- Nicholls DG. Mitochondrial and cell signalling. Cell Calcium. 2005;38:311–317. doi: 10.1016/j.ceca.2005.06.011. [DOI] [PubMed] [Google Scholar]
- Nicholls DG, Ferguson SJ. Bioenergetics 35. London, UK: Academic Press; 2002. pp. 89–154. [Google Scholar]
- Ohtsuki T, Matsumoto M, Suzuki K, Taniguchi N, Kamada T. Mitocondrial lipid peroxidation and superoxide dismutase in rat hypertensive target organs. Heart Circ. Physiol. 1995;37:H1418–H1421. doi: 10.1152/ajpheart.1995.268.4.H1418. [DOI] [PubMed] [Google Scholar]
- Patton C. WinMAXC. Version 2.0. Pacific Grove, CA, USA: Stanford University Hopkins-Marine Station; 1999. [Google Scholar]
- Richter C. Reactive oxygen and nitrogen species regulate mitochondrial Ca2+ homeostasis and respiration. Biosci. Rep. 1997;17:53–66. doi: 10.1023/a:1027387301845. [DOI] [PubMed] [Google Scholar]
- Rottenberg H, Marbach M. Adenine nucleotides regulate Ca2+ transport in brain mitochondria. FEBS Lett. 1989;247:483–486. doi: 10.1016/0014-5793(89)81396-1. [DOI] [PubMed] [Google Scholar]
- Saavedra-Molina A, Uribe S, Devlin TM. Control of mitochondrial matrix calcium: studies using Fluo-3 as a fluorescent calcium indicator. Biochem. Biophys. Res. Commun. 1990;167:148–153. doi: 10.1016/0006-291x(90)91743-c. [DOI] [PubMed] [Google Scholar]
- Sigel E, Carafoli E. The charge stoichiometry of cytochrome c oxidase in the reconstituted system. J. Biol. Chem. 1979;254:10572–10574. [PubMed] [Google Scholar]
- Sims NR. Rapid isolation of metabolically active mitochondria from rat brain and subregions using Percoll density gradient centrifugation. J. Neurochem. 1990;55:698–707. doi: 10.1111/j.1471-4159.1990.tb04189.x. [DOI] [PubMed] [Google Scholar]
- Thakar JH, Hassan MN. Effects of 1-methyl-4phenyl-1, 2, 3, 6-tetrahydropyridine (MPTP), cyperquat (MPP+) and paraquat on isolated mitochondria from rat striatum cortex and liver. Life Sci. 1988;43:143–149. doi: 10.1016/0024-3205(88)90291-3. [DOI] [PubMed] [Google Scholar]
- Traaseth N, Elfering S, Solien J, Haynes V, Giulivi C. Role of calcium signaling in the activation of mitochondrial nitric oxide synthase and citric acid cycle. Biochim. Biophys. Acta. 2004;1658:64–71. doi: 10.1016/j.bbabio.2004.04.015. [DOI] [PubMed] [Google Scholar]


