Abstract
Circulating tumor cells (CTCs) quantified in cancer patients’ blood can predict disease outcome and response to therapy. However, the CTC analysis platforms commonly used cannot capture live CTCs and only apply to tumors of epithelial origin. To address these limitations, we have developed a novel cancer detection platform which measures telomerase activity from live CTCs captured on a Parylene-C slot microfilter. Using a constant low-pressure delivery system, the new microfilter platform was capable of cell capture from 1 ml of whole blood in less than 5 minutes, achieving 90% capture efficiency, 90% cell viability and 200-fold sample enrichment. Importantly, the captured cells retained normal morphology by scanning electron microscopy and could be readily manipulated, further analyzed, or expanded on or off filter. Telomerase activity – a well-recognized universal cancer marker – was reliably detected by qPCR from as few as 25 cancer cells spiked into 7.5 ml whole blood and captured on microfilter. Moreover, significant telomerase activity elevation also was measured from patient blood samples and from single cancer cells lifted off the microfilter. Live CTC capture and analysis is fast and simple yet highly quantitative, versatile, and applicable to nearly all solid tumor types, making this a highly promising new strategy for cancer detection and characterization.
Keywords: Circulating tumor cell, telomerase, cancer biomarker
Introduction
Circulating tumor cells (CTCs) captured from peripheral blood recently were shown to predict disease outcome and therapy response in cancer patients (1–7). Currently, CTCs are isolated from blood by methods which rely on immuno-magnetic binding of cell surface epithelial cell adhesion molecules (EpCAMs), an expensive, labor-intense approach that is limited to EpCAM-expressing tumors (7–8). We previously reported an alternative platform using a novel parylene-C pore microfilter which traps CTCs quickly and efficiently based on their size differential from other blood cells (9). However, like the EpCAM-based approach, our pore microfilter relied on fixation, staining, and visual enumeration of captured cells, a laborious and subjective process prone to reader/operator variability. These limitations can be surmounted by measuring telomerase activity from microfilter-captured live CTCs. As a CTC biomarker, telomerase activity offers several advantages: 1. It is a widely-applicable tumor marker with validated diagnostic and prognostic utility in multiple cancer types (10–17); 2. It is a uniquely “functional” assay that reflects the presence of live cancer cells; 3. It can be amplified and measured accurately from small numbers of cells using quantitative PCR (qPCR) without the need to visualize or count the cells; 4. It can be scaled up cheaply and rapidly to yield quantitative, operator-independent results. Reasoning that such an approach would be widely applicable to nearly all solid tumor types regardless of EpCAM expression, we set out to develop a novel microfilter-based platform capable of measuring telomerase activity from live-captured CTCs.
Material and methods
Filter Fabrication
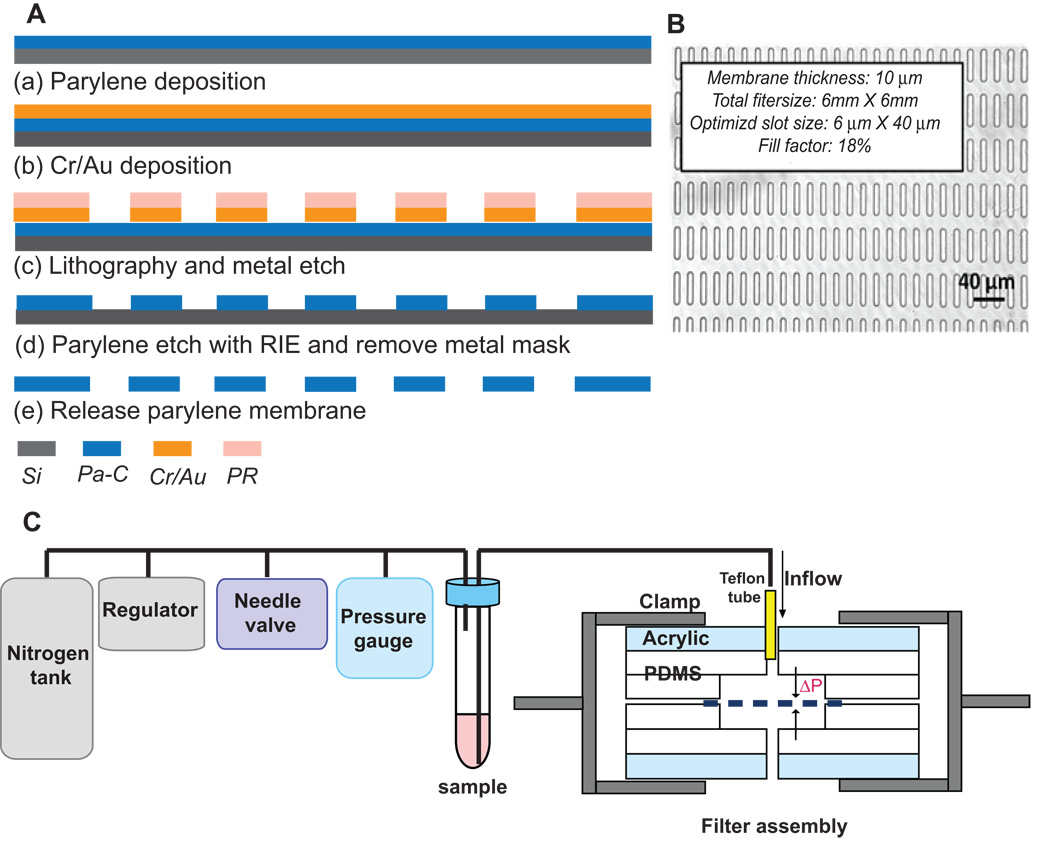
A 10 µm-thick parylene-C layer was deposited on prime silicon wafer (Figure 1A). Then, either Cr/Au or Al was deposited using a thermal evaporator, followed by wet-etch patterning. Using the metal layer as a mask, an array of 30,401 slot openings was etched through the parylene-C membrane by reactive ion etching (RIE). Lastly, the parylene-C membrane was peeled off from the silicon substrate.
Figure 1. Microfilter fabrication and constant-pressure fluid delivery system.
(A). Microfilter fabrication process. (B) Bright-field micrograph of slot microfilter. (C) Constant-pressure fluid delivery system and filter assembly.
Constant pressure fluid delivery system
Pressure from a nitrogen tank was reduced below 1 psi by a two-stage regulator (Figure 1C) and further down regulated accurately by adjusting a needle valve to 0.1 – 0.13 psi. A 15 ml conical tube containing the sample was connected as a reservoir. The filter was sandwiched between two thin pieces of polydimethylsiloxane (PDMS) with wells and then clamped between PDMS/acrylic jigs to form a sealed chamber.
Cell lines
PC3 and DU145 human prostate cancer cell lines were generously provided in 2007 by the laboratory of Elizabeth Blackburn (UCSF) and were not re-authenticated prior to use in these experiments. Both cell lines were maintained in standard culture conditions (RPMI/10%FBS at 37°C).
Capture efficiency, cell viability and enrichment
PC3 and DU145 cancer cells were stained with Calcein-AM fluorescent dye, and 10 cells were spiked into 1 ml human blood. After filtration, captured cells were co-stained with Propidium iodide (PI) on filter and counted under a fluorescent microscope (Zeiss Imager.Z1 microscope) with Axiovision software. Viable Calcein-AM-retaining cells were fluorescent green while dead cells were fluorescent red by PI.
Capture efficiency was calculated as:
Cell viability was calculated as:
Enrichment was determined by staining and counting the PBMCs remaining on filter with Acridine Orange and was calculated as:
7.5 ml blood samples were processed similarly but with the addition of Ficoll-paque gradient centrifugation and resuspension in 2 ml PBS.
Patient specimen collection and processing
7.5 ml blood samples were drawn from patients with metastatic prostate cancer under an IRB-approved protocol, as well as from healthy volunteer controls into EDTA K2 vacutainer tubes, processed within 24 hours.
Scanning electron microscopy (SEM)
The microfilter containing captured cells was processed per standard protocol, then photographed on a SEM with 3,500× magnification (JEOL JSM/6390LV).
Telomeric Repeat Amplification Protocol (TRAP) assay
Telomerase activity from cell extracts was analyzed using a previously described real-time PCR-based telomeric repeat amplification protocol (TRAP) (18).
Statistics
All cell capture and telomerase activity experiments were performed in triplicate and reported with standard error bars. Telomerase activity (Ct) mean and specificity range for true negatives (healthy cohort) were calculated using the SAS statistical package version 9.2. Telomerase activity (Ct) differences for filtration in series between filter 1, 2, and 3 were compared using Analysis of Variance (ANOVA). All tests were 2-sided at a 0.05 significance level and performed using the SAS statistical package version 9.2.
Results
We used parylene-C because of its mechanical strength and flexibility, biocompatibility, and easy machinability. The microfilter was fabricated by a multi-step deposition and etching process (Figure 1A and Methods), resulting in an array of 30,401 slot openings. We chose a slot design to maximize cellular deformation and passage of blood cells in the longitudinal axis while capturing the larger and less deformable CTCs (Figure 1B). The slot design generated a large fill factor (~18%), thus greatly reducing the flow resistance and pressure gradient (ΔP) across the filter, critical for preserving the structural integrity and viability of live CTCs. To achieve reproducible and gentle delivery of unfixed sample, we assembled a constant low-pressure system consisting of a nitrogen pressure source in series with a pressure regulator and fine pressure valves capable of driving the sample with an accuracy of ±0.01 psi (Figure 1C).
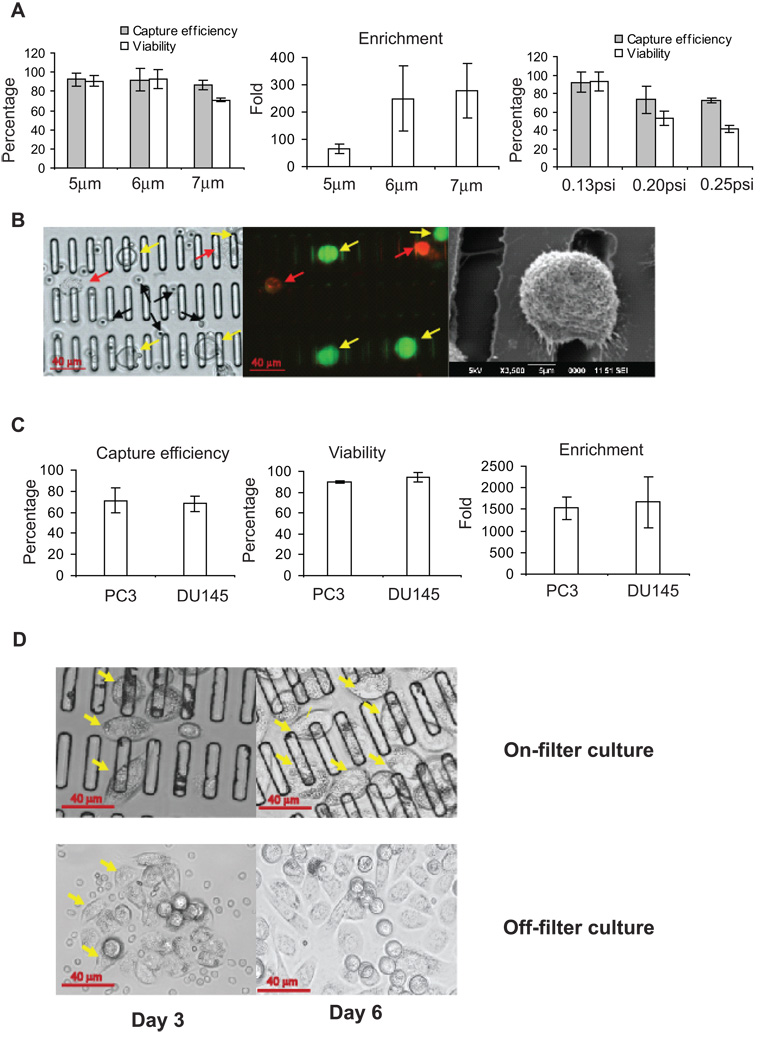
To optimize microfilter slot width and drive pressure, we tested various designs using whole blood samples (1 ml) spiked with 10 PC3 prostate cancer cells. All tested slot widths were considerably smaller than the mean PC3 cancer cell diameter, resulting in similar capture efficiencies of approximately 90% (Figure 2A). However, cellular viability was significantly diminished from 90% to 70% at the larger (7 µm) slot width, possibly because the cells became more deeply “wedged” into the wider slots and sustained greater deformation and mechanical damage. On the other hand, CTC enrichment diminished from 200-fold to only 70-fold at the smaller slot width (5 µm), because many more PBMCs were trapped along with the CTCs. Therefore, we settled on an optimal slot width of 6 µm, which provided the highest capture efficiency (90%), cell viability (90%) and enrichment (200-fold) of cancer cells relative to PBMCs.
Figure 2. Microfilter optimization and validation.
(A). Slot size and filtration pressure optimization. Left: Comparison of cell capture efficiency and viability with different slot sizes. Center: Measurement of enrichment with different slot sizes. Right: Comparison of capture efficiency and viability with various filtration pressures using 6 µm slot filter. (B) Cancer cells captured on microfilter and imaged under bright-field (left) and fluorescence (center) of the same field; yellow arrows indicate live captured cancer cells, red arrows indicate dead cancer cells, and black arrows indicate PBMCs. Right: SEM of captured cancer cell. (C) Validation of cancer cell capture from 7.5 ml whole blood. Shown are capture efficiency (left), cell viability (middle) and enrichment (right). (D) On-filter (top) and off-filter (bottom) cell culture of PC3 cells captured from whole blood after 3 days and 6 days. Yellow arrows denote foci of cancer cell proliferation. All histogram results are means of triplicate independent experiments.
The 6 µm slot filter was used to determine the optimal filtration drive pressure, and ultimately 0.13 psi was chosen as the optimal pressure for speed, capture efficiency and viability (Figure 2A). This pressure preserved the morphology of captured cells (Figure 2B) and allowed filtration of 1mL whole blood in less than 5 minutes, a capture rate that is approximately 10-fold faster than that of other recently-published microfluidic platforms (8).
We validated these slot and pressure parameters for capture of cells from a standard 7.5 ml blood sample. After Ficoll-Paque gradient centrifugation (to reduce sample volume and eliminate red blood cells), the optimized filtration settings yielded ~70% capture efficiency, 90% viability, and 1500 fold enrichment (Figure 2C). The viability of captured cancer cells was further validated by expanding the cells in culture either directly on filter or by first washing them into a culture dish (Figure 2D). Notably, the microfilter provided a biocompatible environment for cancer cell adherence and growth.
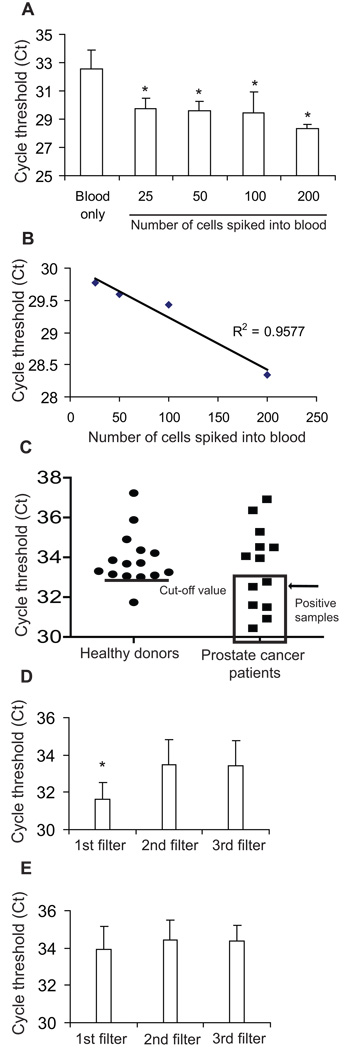
We tested whether telomerase activity can be detected from live-captured cancer cells by spiking DU145 prostate cancer cells into 7.5 ml whole blood, then lysing the live-captured cells on filter and analyzing the lysate by qPCR-TRAP (Figure 3A). Remarkably, this method was capable of detecting as few as 25 cancer cells spiked into 7.5 ml of whole blood. (Figure 3A, p=0.01 for each spiked sample compared to blood only), and the threshold cycle value (Ct) value was inversely proportional and linearly correlated with the number of spiked cells (Figure 3B). To test whether cell capture and telomerase signal degraded significantly over 24 hours, we spiked 100 cancer cells into 1ml aliquots of whole blood drawn from 3 healthy donors and kept the samples at room temperature for 1, 6, 12, and 24 hours prior to processing. At all time points the assay yielded statistically significant positive telomerase activity readings; activity was essentially unchanged in the first 6 hours, and there was a subsequent trend (not statistically significant) towards lower activity at 12 and 24 hours (Supplemental Figure 1).
Figure 3. Detection of telomerase activity from live cancer cells captured on slot microfilter.
(A) Telomerase activity detected from 7.5ml blood samples spiked with a range of cancer cell numbers or blood only (p=0.01 for each sample compared with blood-only sample). (B) Linear correlation of Ct values with the numbers of spiked cells. All histogram results are means of triplicate independent experiments. (C) Telomerase activity of patient samples versus healthy donor controls. The line in healthy donors indicates the calculated true negative Ct cut-off value of 33; patient samples falling within positive range (Ct<cut-off value) are boxed. (D) Serial filtration to internally control for PBMC background telomerase activity on 6 positive patient samples (p=0.029) (E) Serial filtration on healthy donor samples (p=0.5).
We conducted a limited proof-of-principle experiment wherein blood samples from 15 healthy donors and 13 cancer patients were tested (Figure 3C) using slot microfilter capture and qPCR-TRAP. Among healthy donors, the average Ct was 33.9±1.32. To maximize assay specificity based on this true negative cohort, we defined Ct=33 as the cut-off threshold for a positive telomerase activity assay, thus yielding a specificity of 93% (95%CI: 68%–100%) within the training set of healthy donors. When a test cohort of patient samples was tested using this cut-off, 6 of 13 patients were found to have Ct values below the threshold of Ct=33. These 6 patients with positive CTC telomerase activity assays had a mean Ct of 31, approximately 8-fold telomerase activity relative to the mean telomerase activity of the healthy control cohort.
We internally controlled the telomerase activity assay for inter-sample variability such as fluctuations in background peripheral blood mononuclear cells (PBMCs) by passing each sample through 3 microfilters in series. When this approach was applied to the 6 telomerase-positive cancer patients identified above, telomerase activity was significantly higher in the first filter (reflecting captured CTCs) than in the second or third filters (reflecting background PBMCs) (Figure 3D; ANOVA p = 0.029). In contrast there was no significant telomerase activity difference between the first, second and third filters in the other 7 patients with low telomerase activity (ANOVA p = 0.28, data not shown), or between serial filters in healthy donors (Figure 3E, ANOVA p = 0.51). This approach further strengthened the assay by enabling telomerase activity readings to be internally controlled for PBMC background and inter-sample variability.
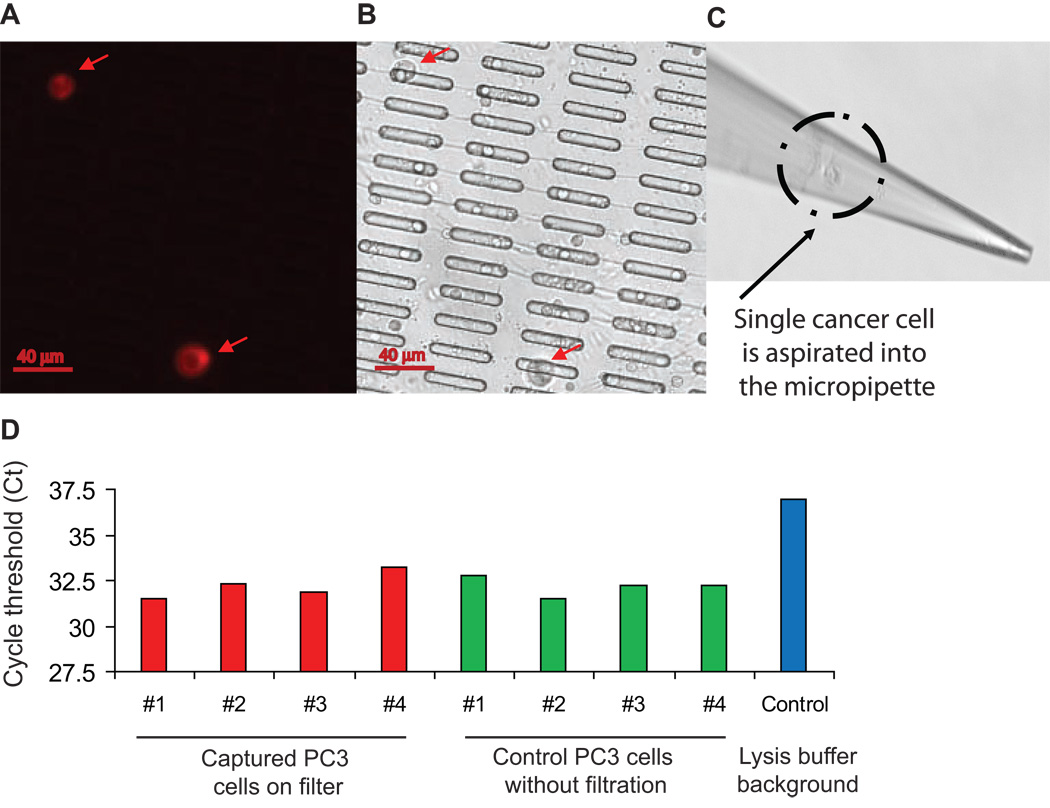
We tested whether the platform would support single-cell analysis of live-captured cells. PC3 cancer cells were captured from whole blood on microfilter, localized by immunofluorescent staining (PE-conjugated anti-CD49 antibody), and recovered individually using a micropipette mounted onto a XYZ manipulating stage (Figure 4). Single cancer cells were deposited in CHAPS lysis buffer and subjected to qPCR-TRAP, which yielded a significantly elevated telomerase activity level relative to negative controls.
Figure 4. Telomerase activity measurement from single live cancer cells captured on microfilter.
(A) Captured cells stained by PE-CD49b. (B) Matched bright field image. (C) Micropipette recovery of single cell. (D) Single cell telomerase activity assays.
Discussion
Here we present a novel cancer biomarker platform capable of assaying telomerase activity in live CTCs captured from human blood. This new platform offers several important advances: Most current cell capture techniques which rely on immune enrichment are limited to tumor types that express the cell surface antigen being targeted (usually EpCAM) (7–8); however, EpCAM expression can be quite variable (19) or even downregulated (20) in disseminating epithelial tumor cells. Furthermore, existing systems either require prior sample fixation and do not yield live CTCs, or capture live cells in a manner that is slow and precludes removal of the cells for further study (7–9). In contrast, the new slot microfilter is capable of rapidly and efficiently capturing live CTCs that can be studied on or off filter, enabling sophisticated characterization and possibly expansion of these cells for further study.
The current slot microfilter design achieves viable cell capture without fixation and yields statistically significant telomerase activity up to 24 hours from the time of blood draw, with a moderate (non-significant) drop-off in activity from 12 to 24 hours, an ample time window for on-site, same-day processing of blood samples. Future microfilter platforms could be envisioned to integrate a compact constant pressure delivery cartridge with the filter chamber to produce a simple point-of-care device for processing of blood samples. The current platform design also employs Ficoll-Paque centrifugation for 7.5ml blood samples; predictably, this additional step causes some loss (~20%) of capture efficiency; nevertheless, 70% capture rate from 7.5ml whole blood in 15 minutes still compares quite favorably with other technologies (7–9). Future platforms will eliminate the Ficoll step for large volume processing via use of hydrophobically-coated filters for reduced resistance, as well as multiple filters for parallel processing of smaller volumes.
Measurement of telomerase activity from live CTCs on slot microfilter constitutes a tumor biomarker strategy with broad applicability. Telomerase activity is a well-recognized cancer marker in >90% of human malignancies (15) and therefore is ideally suited to the microfilter, which can capture CTCs across all tumor types regardless of surface markers. Telomerase activity also constitutes a uniquely “functional” assay which reflects the presence of live cancer cells. Moreover, qPCR-TRAP can amplify the telomerase activity signal from as few as one cancer cell, raising the prospect of applying CTC-telomerase for early detection of occult malignancy.
The current platform is capable of detecting telomerase activity from as few as 25 cancer cells seeded into 7.5ml whole blood. It may be possible to increase platform sensitivity by further reducing capture of background PBMCs (e.g. hydrophobically-coated filters). On the other hand, the current detection level may already be sufficient to identify clinically significant disease, because the absolute range of significant CTC numbers has not been defined to date (each platform is biased by its own capture strategy). Another factor which may affect telomerase activity measurement is potential PBMC variability in various clinical states such inflammatory conditions (increased PBMC telomerase) or chemotherapy (decreased PBMC numbers). This variability is addressed to a large extent by processing each blood sample through 3 filters in series and recording the difference in telomerase activity between the first filter (where CTCs are caught) and the second and third filters (which contain background PBMCs), thus internally controlling each assay for its individual blood sample.
Low pressure slot microfiltration offers new and versatile capabilities for live CTC capture and analysis. Detection of telomerase activity highlights the potential utility of this novel platform, which can be applied to advance cancer research and enhance patient care.
Supplementary Material
Acknowledgments
Financial Support: Funded in part by NCI K08 CA126983-01 (AG).
The authors thank Dr. David I. Quinn for his critical review of this manuscript and his ongoing support of these studies.
Footnotes
Conflict of Interest: The authors’ institutions (Cal Tech and USC) have submitted patent applications (pending) based on the new technologies presented in this manuscript.
References
- 1.Cohen SJ, Punt CJ, Iannotti N, et al. Relationship of circulating tumor cells to tumor response, progression-free survival, and overall survival in patients with metastatic colorectal cancer. J Clin Oncol. 2008;26:3213–3221. doi: 10.1200/JCO.2007.15.8923. [DOI] [PubMed] [Google Scholar]
- 2.de Bono JS, Scher HI, Montgomery RB, et al. Circulating tumor cells predict survival benefit from treatment in metastatic castration-resistant prostate cancer. Clin Cancer Res. 2008;14:6302–6309. doi: 10.1158/1078-0432.CCR-08-0872. [DOI] [PubMed] [Google Scholar]
- 3.Gasent Blesa JM, Alberola Candel V, Esteban Gonzalez E, et al. Circulating tumor cells in breast cancer: methodology and clinical repercussions. Clin Transl Oncol. 2008;10:399–406. doi: 10.1007/s12094-008-0222-9. [DOI] [PubMed] [Google Scholar]
- 4.Goodman OB, Jr, Fink LM, Symanowski JT, et al. Circulating tumor cells in patients with castration-resistant prostate cancer baseline values and correlation with prognostic factors. Cancer Epidemiol Biomarkers Prev. 2009;18:1904–1913. doi: 10.1158/1055-9965.EPI-08-1173. [DOI] [PubMed] [Google Scholar]
- 5.Ignatiadis M, Xenidis N, Perraki M, et al. Different prognostic value of cytokeratin-19 mRNA positive circulating tumor cells according to estrogen receptor and HER2 status in early-stage breast cancer. J Clin Oncol. 2007;25:5194–5202. doi: 10.1200/JCO.2007.11.7762. [DOI] [PubMed] [Google Scholar]
- 6.Shaffer DR, Leversha MA, Danila DC, et al. Circulating tumor cell analysis in patients with progressive castration-resistant prostate cancer. Clin Cancer Res. 2007;13:2023–2029. doi: 10.1158/1078-0432.CCR-06-2701. [DOI] [PubMed] [Google Scholar]
- 7.Cristofanilli M, Budd GT, Ellis MJ, et al. Circulating tumor cells, disease progression, and survival in metastatic breast cancer. N Engl J Med. 2004;351:781–791. doi: 10.1056/NEJMoa040766. [DOI] [PubMed] [Google Scholar]
- 8.Nagrath S, Sequist LV, Maheswaran S, et al. Isolation of rare circulating tumour cells in cancer patients by microchip technology. Nature. 2007;450:1235–1239. doi: 10.1038/nature06385. [DOI] [PMC free article] [PubMed] [Google Scholar]
- 9.Zheng S, Lin H, Liu JQ, et al. Membrane microfilter device for selective capture, electrolysis and genomic analysis of human circulating tumor cells. J Chromatogr A. 2007;1162:154–161. doi: 10.1016/j.chroma.2007.05.064. [DOI] [PubMed] [Google Scholar]
- 10.Bravaccini S, Sanchini MA, Amadori A, et al. Potential of telomerase expression and activity in cervical specimens as a diagnostic tool. J Clin Pathol. 2005;58:911–914. doi: 10.1136/jcp.2004.024158. [DOI] [PMC free article] [PubMed] [Google Scholar]
- 11.Hiyama E, Saeki T, Hiyama K, et al. Telomerase activity as a marker of breast carcinoma in fine-needle aspirated samples. Cancer. 2000;90:235–238. [PubMed] [Google Scholar]
- 12.Marchetti A, Bertacca G, Buttitta F, et al. Telomerase activity as a prognostic indicator in stage I non-small cell lung cancer. Clin Cancer Res. 1999;5:2077–2081. [PubMed] [Google Scholar]
- 13.Meeker AK. Telomeres and telomerase in prostatic intraepithelial neoplasia and prostate cancer biology. Urol Oncol. 2006;24:122–130. doi: 10.1016/j.urolonc.2005.11.002. [DOI] [PubMed] [Google Scholar]
- 14.Poremba C, Willenbring H, Hero B, et al. Telomerase activity distinguishes between neuroblastomas with good and poor prognosis. Ann Oncol. 1999;10:715–721. doi: 10.1023/a:1008333500733. [DOI] [PubMed] [Google Scholar]
- 15.Shay JW, Bacchetti S. A survey of telomerase activity in human cancer. Eur J Cancer. 1997;33:787–791. doi: 10.1016/S0959-8049(97)00062-2. [DOI] [PubMed] [Google Scholar]
- 16.Streutker CJ, Thorner P, Fabricius N, Weitzman S, Zielenska M. Telomerase activity as a prognostic factor in neuroblastomas. Pediatr Dev Pathol. 2001;4:62–67. doi: 10.1007/s100240010108. [DOI] [PubMed] [Google Scholar]
- 17.Wright WE, Piatyszek MA, Rainey WE, Byrd W, Shay JW. Telomerase activity in human germline and embryonic tissues and cells. Dev Genet. 1996;18:173–179. doi: 10.1002/(SICI)1520-6408(1996)18:2<173::AID-DVG10>3.0.CO;2-3. [DOI] [PubMed] [Google Scholar]
- 18.Xu T, Xu Y, Liao CP, Lau R, Goldkorn A. Reprogramming murine telomerase rapidly inhibits the growth of mouse cancer cells in vitro and in vivo. Mol Cancer Ther. 2010;9:438–449. doi: 10.1158/1535-7163.MCT-09-0682. [DOI] [PMC free article] [PubMed] [Google Scholar]
- 19.Went PT, Lugli A, Meier S, et al. Frequent EpCam protein expression in human carcinomas. Hum Pathol. 2004;35:122–128. doi: 10.1016/j.humpath.2003.08.026. [DOI] [PubMed] [Google Scholar]
- 20.Polyak K, Weinberg RA. Transitions between epithelial and mesenchymal states: acquisition of malignant and stem cell traits. Nat Rev Cancer. 2009;9:265–273. doi: 10.1038/nrc2620. [DOI] [PubMed] [Google Scholar]
Associated Data
This section collects any data citations, data availability statements, or supplementary materials included in this article.


