Abstract
Purpose
To elucidate the causation mechanism of Spectral Doppler ultrasound signals (DUS) observed during high temperature thermal ablation and evaluate their potential for image-guidance.
Methods
Sixteen ex vivo ablations were performed in fresh turkey breast muscle, eight with radiofrequency ablation (RFA) devices, and eight with a conductive interstitial thermal therapy (CITT) device. Temperature changes in the ablation zone were measured with thermocouples located at 1 to 10mm away from the ablation probes. Concomitantly, DUS were recorded using a standard diagnostic ultrasound scanner. Retrospectively, sustained observations of DUS were correlated with measured temperatures. Sustained DUS was arbitrarily defined as the Doppler signals lasting more than 10 s as observed in the diagnostic ultrasound videos captured from the scanner.
Results
For RFA experiments, minimum average temperature (T1±SD) at which sustained DUS were observed was 97.2±7.3°C, while the maximum average temperature (T2±SD) at which DUS were not seen was 74.3±9.1°C. For CITT ablation, T1 and T2 were 95.7±5.9°C and 91.6±7.2°C, respectively. It was also observed, especially during CITT ablation, that temperatures remained relatively constant during Doppler activity.
Conclusions
The value of T1 was near the standard boiling point of water (99.61°C) while T2 was below it. Together, T1 and T2 support the conclusion that DUS during high temperature thermal ablation are the result of boiling (phase change). This conclusion is also supported by the nearly constant temperature histories maintained at locations from which DUS emanated.
Keywords: boiling, conductive interstitial thermal therapy, doppler ultrasound, radio frequency ablation, tissue water, vaporization
Introduction
Thermal ablation is gaining acceptance as a technique to irreversibly destroy tissues with coagulating temperatures that induce extremely high thermal doses [1–11]. Independently of the energy source device used to raise tissue temperature, be it optical, radiofrequency, microwaves, ultrasonic, or thermal conductive, real time image-guidance is essential to ensure complete coagulation necrosis of target tissue and avoidance of adjacent normal tissues.
Several imaging modalities and techniques have been investigated for monitoring thermal ablation. The most sophisticated and effective imaging method thus far is magnetic resonance imaging (MRI), which has been successfully used to monitor thermal ablation using a large variety of heating systems [8, 12–14]. MRI for guidance and thermometry has excellent spatial, temporal and temperature resolutions and can provide information on multiple planes through the treatment volume. However, the initial cost of a facility as well as the routine operation of a magnet remains an impediment to its widespread application in the emerging field of thermal ablation. Therefore, the development of alternative, less costly, clinical imaging systems/techniques to guide heat delivery in real time is presently a priority.
Ultrasound imaging is a non-ionising, convenient, portable and inexpensive modality in widespread use, and thus attractive for image guidance [15–17]. This particular work was motivated by clinical observations of intense Doppler ultrasound signals (DUS) during radiofrequency ablations of breast lesions and post-lumpectomy cavities [18]. Based on these observations, we hypothesise that DUS can be further analysed and techniques developed for image-guidance of thermal ablation of soft tissues and for assessing the extension of coagulation necrosis (ablation zone). The first step in investigating the feasibility and potential uses of DUS in thermal ablation is to elucidate their causation mechanism. This was the objective of the work we report in this paper.
Materials and methods
Ultrasound imaging
A standard diagnostic ultrasound scanner (Logiq 700, GE, Fairfield, CT) with a 6–13 MHz probe (Model LA-39, GE) was used to image the DUS in turkey breast tissue preparation undergoing thermal ablation as explained below. The scanning speed was 11 frames/s and the dynamic range was 72. The Doppler gain was 47 and the grey colour gain was 26. The gain and scanning speed of the ultrasound scanner were selected to minimise artefacts in the images. Images of B-mode with superimposed colour Doppler signals were acquired continuously in cine mode during heating and later saved as video files. The imaging plane chosen was perpendicular to the longitudinal axis of the ablation probe at the axial location of expected maximum temperature elevation. The collected ultrasound images of the ablation areas were compiled into video clips using MATLAB® (MathWorks, Natick, MA). In each video frame, temperatures measured at the locations of the thermocouples were superimposed. The resulting movie allowed determination of the time and the temperatures when sustained DUS were observed. Sustained DUS was arbitrarily defined as the Doppler signals persisting for more than 10 s. The 10-s threshold time was set to avoid the inclusion of short-lived DUS such as those that can result from tissue thermal expansion prior to boiling.
Ex vivo radiofrequency ablation (RFA) experiments in turkey breast muscle
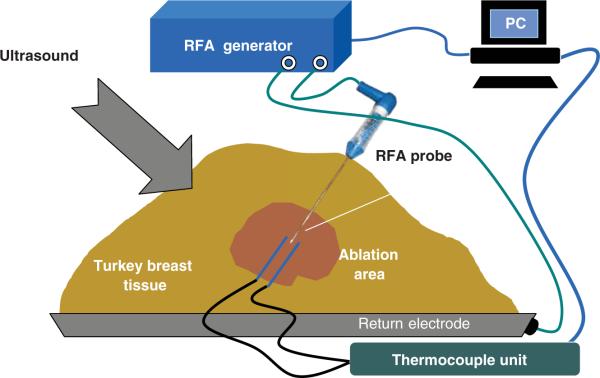
A series of ablation procedures was performed in ex vivo fresh turkey breast muscle at room temperature. The general experimental set-up for the RFA experiments is shown in Figure 1. A commercial RFA generator (Model 1500 ×, RITA Medical Systems, Fremont, CA) and a probe with retractable tines (StarBurst XL, RITA Medical Systems) and a single-electrode probe (UniBlade, RITA Medical Systems), were used in the RFA experiments. Noteworthy, during the experiments, the tines were retracted in the StarBurst probe, to prevent interference with the thermocouples and the ultrasound system. After inserting a probe into turkey breast muscle 25mm in depth, two hypodermic thermocouples (HYPO-33-1-T-G-60-SMPW-M, Omega Engineering, Stamford, CT) were positioned on opposite sides of a RFA probe's tip to monitor temperatures in its vicinity. The thermocouples were connected to an eight-channel data acquisition system (DI-1000-TC, DATAQ Instruments, Akron, OH). The average distance between the RFA probe and hypodermic thermocouples was 3 ± 1mm. In all experiments the measured temperatures increased with time gradually from room temperature of about 21°C to 115–120°C. Power input into the needle probe did not exceed 17 W while for the expandable multi-tine probe it did not exceed 30 W. In addition to temperatures and power input into the probes, tissue electrical impedance (as reported by the RITA system) was also collected.
Figure 1.
Experimental set-up for the ex vivo RFA of turkey breast muscle (not to scale). The RFA needle probe is shown.
A pre-planned RFA heating/ablation experiment was performed eight times in the following manner. The target temperature was set to 120°C; this was the temperature the control algorithm of the RITA system tried to reach and maintain. In the case of the needle probe, the temperature measured by the built-in sensor at the tip of the RFA probe was used as the control temperature, while the average of the temperatures measured at the tips of the tines was used as the control temperature for the multi-tine probe. The heating (power-on) time was 15 min followed by a shorter cooling period.
Ex vivo CITT thermal ablation in turkey breast muscle
Conductive thermal ablation experiments were performed using a custom made conductive interstitial thermal therapy (CITT) system developed in our institution. The CITT probe raised tissue temperature via heat conduction from the probe to the tissue. The body of the probe was made of a stainless steel cylinder 10mm in diameter. Inside the tip of the cylinder there was an electrical (resistive) heating element that was connected to an external controllable power supply. The principles of operation of the CITT device along with characterising experimental data and numerical simulations are described in previous publications [16, 17]. Eight ex vivo experiments were conducted. The experimental set-up was similar to that one described above for RFA except for the different ablation device. The probe was positioned approximately 40mm deep inside the turkey breast muscle.
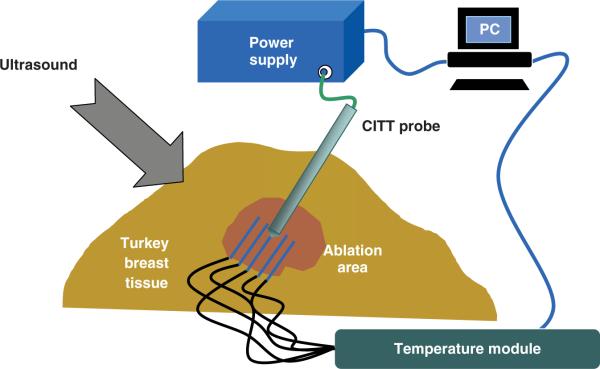
The electric power input into the probe was provided by a programmable DC power supply (Model 1786 B, BK Precision, Yorba Linda, CA). The input power level was set equal to 25 W in all eight experiments. The experimental set-up for CITT ablations is shown in Figure 2. Four fine needle thermocouples (HYPO-33-1-T-G-60-SMPW-M, Omega) inserted into the fresh turkey breast muscle and positioned 3 ± 1mm apart in a radial direction parallel to and on opposite sides of the CITT probe as shown in Figure 2. An identical thermocouple was firmly fastened on the surface of the CITT probe near the tip to record temperature adjacent to the probe. The thermocouples were connected to the same temperature acquisition system described above. Likewise, temperature and image collection data was as described for the RFA experiments.
Figure 2.
Experimental set-up for ex vivo CITT ablation in a turkey breast muscle (not to scale).
Results
DUS during radio frequency ablation
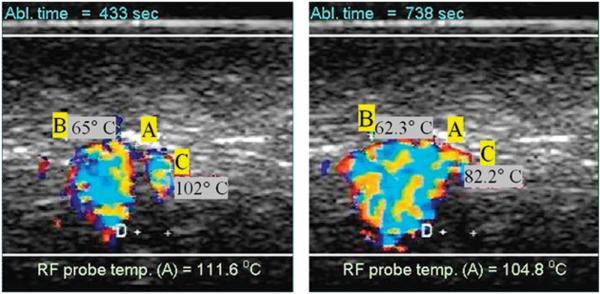
The DUS and temperature measurements results were similar for the Uniblade and the Starburst probe (without tines deployment), so the data for both probes was pooled and averaged together. Sample images showing colour DUS observed during high temperature radio frequency ablation (RFA) are shown in Figure 3. The two images shown were taken at different times, as noted, during an RFA ablation experiment using the needle RFA probe. The letter A indicates the location of the RFA probe while letters B and C denote thermocouple positions. The distance between the two plus signs near the letter D measured 2mm using the scanner's distance tool.
Figure 3.
Example of observed colour Doppler ultrasound signals (DUS) superimposed on B-mode images. The two images shown were taken at different times during an RFA ablation experiment using the needle probe. The letter A indicates the location of the RFA probe while letters B and C denote thermocouple locations (2mm apart as measured with the scanner).
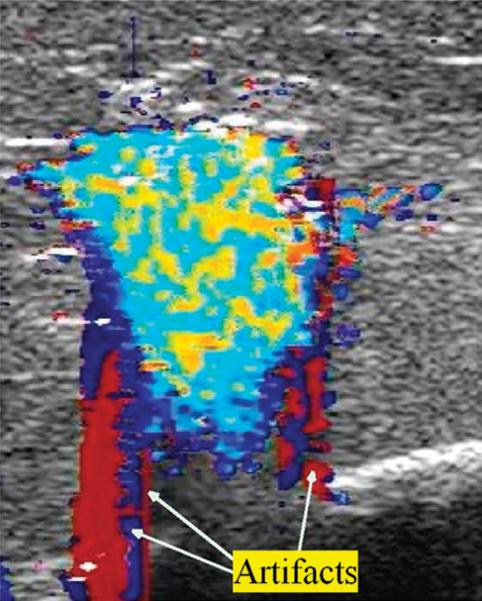
Image artefacts were occasionally observed. Since our study was done ex vivo, with no blood flow, we assume that the artefacts were twinkle artefacts. Twinkle artefacts are machine dependent. They are believed to be caused by a narrow band of intrinsic machine noise called phase (or clock) jitter [19]. Typically, they took the form of wide red or blue coloured stripes extending to the top and/or to the bottom of an image and periodically flashing on the screen, as shown in Figure 4. These were a nuisance but for the most part did not prevent the observation or analysis of DUS generated from the high temperature ablation process.
Figure 4.
Example of Doppler imaging artefacts during RFA in the form of monochromatic strips.
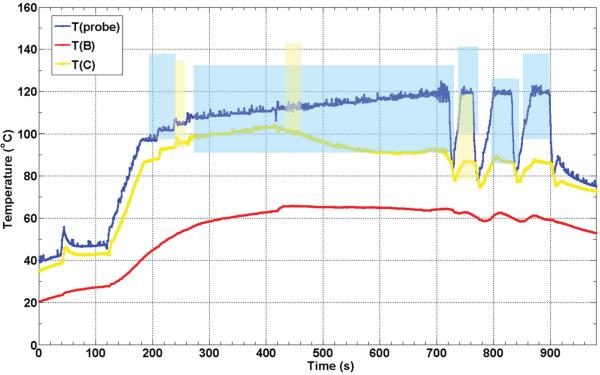
Figure 5 shows thermocouple recorded temperature histories during one of the eight ex vivo RFA experiments. The colour-coded shaded areas denote the times and temperatures of observed sustained Doppler activity for their respective thermocouple (see figure legend). The positions of the RFA probe and thermocouples B and C are shown in Figure 3. This plot is representative of the eight RFA experiments performed.
Figure 5.
Thermocouple recorded temperature histories during an ex vivo RFA experiment in turkey breast muscle. The colour-coded shaded areas denote the times and temperatures of observed sustained Doppler activity for the respective thermocouples (e.g. blue shaded area corresponds to temperatures as function of time measured at the probe). The positions of the RFA probe (A) and thermocouples B and C are as shown in Figure 3.
As can be seen in Figure 5, the maximum temperature recorded was adjacent to the RFA probe, as expected, and the first and most of the DUS observed were at this location as well. When the RFA probe reached temperatures near 100°C (at about 200 s) the sustained DUS signals like those shown in Figure 3 appeared. The temperature and DUS fluctuations seen after 700 s for this RFA probe (blue) were caused by the control algorithm of the RITA system which was trying to keep the probe at the set temperature of 120°C while in the presence of significant electrical impedance variations due to the formation of gas. Note that DUS ceased shortly after the probe temperature dropped, but returned as the probe temperature increased again, with the threshold temperature for sustained DUS usually close to 100°C as the next figure shows. Note that there was sustained DUS observed in the vicinity of thermocouple C (yellow curve). Again, sustained DUS was usually observed at temperatures close to 100°C.
In order to quantify the threshold temperature for sustained DUS, T1 was defined as the average minimum temperature at which sustained DUS activity was observed for the first time in each of the eight RFA experiments, while T2 was defined as the average maximum temperature reached by any probe at which no DUS were observed. T1 and T2 for the RFA experiments are plotted in Figure 6.
Figure 6.
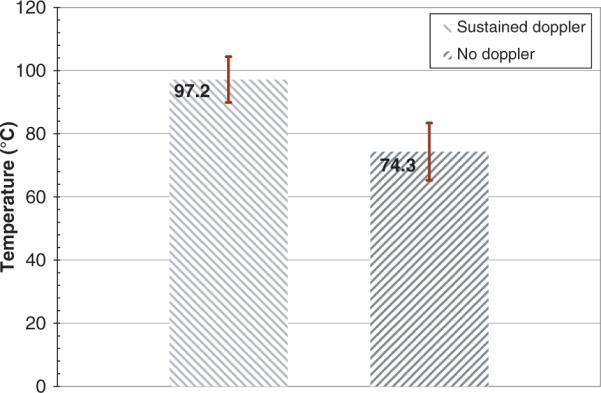
T1 and T2 for the eight RFA experiments. Error bars correspond to standard deviations.
DUS during conductive interstitial thermal therapy
During the ex vivo thermal ablation with the conductive interstitial thermal therapy (CITT) probe, temperatures were monitored with four thermocouples positioned in tissue and one thermocouple fastened on the CITT probe (Figure 2). Example ultrasound images taken during CITT ablation are shown in Figure 7. The circles in the images show the location of the surface of the CITT probe in the imaging plane. The Doppler patterns characterised by rapid cyclic changes in colours were similar to those seen during RFA.
Figure 7.
Example of sustained DUS at two different instances during one of the eight CITT ablation experiments. Letters B, C, D, and E denote the locations of the thermocouples with their corresponding temperatures at that time. The circular echo (pointed with red arrow) shows the position of the surface of the CITT probe at point A (10mm in diameter).
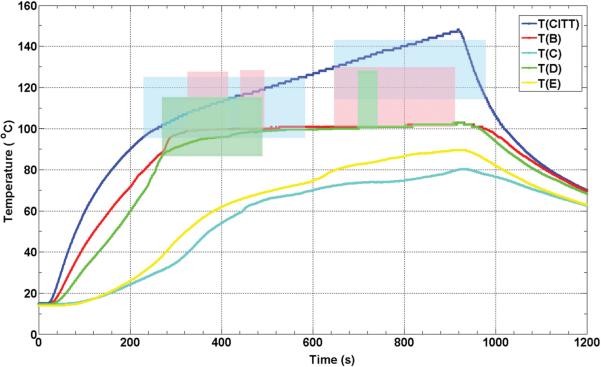
Figure 8 is for CITT ablation what Figure 5 is for RFA. Figure 8 shows the temperature histories from five thermocouples from one of the eight CITT ablation experiments. However, the temperature dynamics are different due to the significant differences between RFA and CITT ablation approaches and the way each technology controls the ablation process. For the CITT, experiments presented in this paper were all conducted at a constant power level of 25 W. This explains the temperature of the CITT probe continuously increasing during the 15 min of power-on time. Similarly with the RFA results, the formation of sustained DUS began in areas adjacent to the heat source where the temperatures were always higher, as expected. Unlike RFA, locations that reached the threshold temperature for sustained DUS remained at that temperature until the power to the probe was switched off (see thermocouples B and C in Figure 8). Interestingly, DUS was not always observed at these locations, and even at the CITT probe location there was a cessation of DUS before and after 600 s. The temperatures measured by thermocouples C and E never reached a threshold temperature necessary for generation of Doppler signals.
Figure 8.
Thermocouple recorded temperature histories during a CITT ablation experiment in turkey breast muscle. The colour-coded shaded areas denote the times and temperatures of observed sustained Doppler activity for the respective thermocouples (e.g. blue shaded area corresponds to temperatures as function of time measured at the probe, the pink shaded area corresponds to the red line, T(B)). The locations of the CITT probe and the thermocouples B through E are as shown in Figure 7.
Again, in order to quantify the threshold temperature for sustained DUS during the CITT ablation experiments, T1 and T2 were calculated and plotted in Figure 9, showing that the value of T1 for CITT ablation is close to 100°C.
Figure 9.
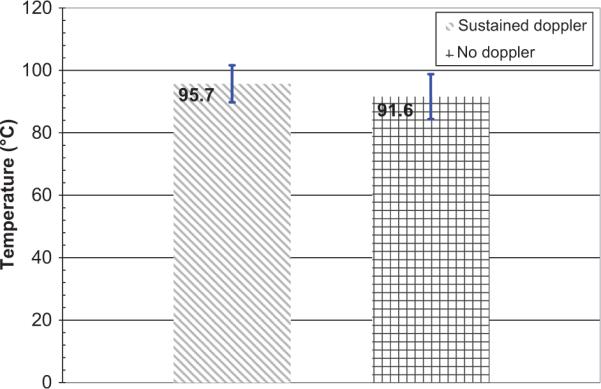
T1 and T2 for the eight CITT ablation experiments. Error bars correspond to standard deviations.
Discussion and conclusions
The experiments presented in this report were done ex vivo, therefore Doppler activity due to blood perfusion or flow in vessels was not possible. This is not to say that the kind of DUS observed in our experiments cannot also be observed in vivo. Indeed they can. It was the observation of DUS during clinical radiofrequency ablation that motivated this study [18]. In short, the first point is that in this study perfusion and blood flow effects can be completely ruled out. Second, the flickering and cycling colour patterns of the DUS as shown in Figure 3 always first appeared where the maximum temperature in the region was expected – closest to the RFA and CITT probes. Third, the measured average minimum temperature (T1) for both RFA and CITT heating was close to the fluid–gas phase change of water, i.e. boiling (Figures 6 and 9). For temperatures higher than T1 DUS were almost always observed.
Water behaves like a two phase liquid in tissue, one that is free and one that is bound the macro molecules of the tissue (20). The water that is bound to the tissue molecules starts to evaporate at temperatures of about 65°C, and the free water will evaporate at temperatures around 100°C as observed by Ramachandran et al. 1996 [20]. We therefore suggest that in our study T2 corresponds to boiling of water bound to macro molecules of tissue and T1 corresponds to boiling of free water in tissue.
The lower T2 for the RFA in comparison to the CITT is, probably, because of the different heating mechanisms. During CITT, heating occurs by thermal conduction thus boiling will be initiated when the tissue exceeds the boiling temperature; this obviously happens adjacent to the probe. However, during RFA heat is generated by intracellular ions (i.e. mainly water) moving in response to the alternating electromagnetic current. Heating by the RFA is much more concentrated than heating by CITT. Thus, we postulate that during RFA minor DUS activity due to localised boiling will be seen at lower T2 temperatures in comparison to the CITT. The T1 (sustain DUS, due to boiling) temperature was similar for both CITT and RFA, 95.7° ± 5.9°C and 97.2° ± 7.3°C, respectively. These observations are in agreement with Kruskal et al. (2001) who imaged bubble formation, in vivo, when the RFA probe reached or exceeded 95°C [21]. In that study video microscopy was used to image the bubbles. The bubbles were visible 2 min after exposure to 95°C and lasted 20 seconds before they coalesced into larger aggregates and spread into the hepatic venules. Although they did not discuss the source of these bubbles, the similar temperatures of when those bubbles were observed suggest that they were also formed due to local boiling.
In addition to the above points is the message from the heating histories represented by Figures 5 and 8, where it is clearly seen that DUS are present when thermocouples are measuring temperatures generally above 90°C. Finally, from the CITT temperature histories (Figure 8), the flat profiles for thermocouples B and D fit perfectly with the constant temperature characteristics of phase-change even if the system continues to receive energy.
We posit that the points made above based on the data presented support the notion that the DUS observed are caused by boiling. That is, the fluids of the tissues, when heated beyond their particular boiling point temperature start to release gas bubbles. These bubbles are not only highly echogenic, but because of the continuous energy input during the experimental protocols they are continuously being formed and moving due to convection currents and buoyancy effects. Gas bubbles are extraordinarily efficient in producing backscattered signals as is well-known from ultrasonic contrast agent literature [22].
Our results are consistent with boiling being the mechanism for the appearance of the Doppler signals. DUS could be used as a control signal to the physician during thermal therapy, either because temperatures may be considered too high or too low for a given procedure. For example, temperatures much higher than 100°C seem to be more effective when using thermal conductive methods as with the CIIT device [9, 10]. Doppler signals may be also used to guide the position of the ablation probe or determine the location of hot spots as indicated by tissue boiling. Another possible clinical application is avoiding excessively high temperatures near the skin during excision-assisted RFA to prevent skin burns and perforations [8]).
If indeed tissue boiling is a more efficient thermal ablation approach in specific applications, then the therapy and its monitoring may be further enhanced by injecting a fluid (e.g. saline) into tissue at the ablation site. It may also be possible to inject a biocompatible additive with a lower boiling point, say 55–60°C, to monitor/guide lower temperature thermal ablation interventions. With further research, the development of specialised signal processing techniques, and in combination with other ultrasound imaging methods (e.g. strain imaging), the release of gas during thermal ablation could greatly aid in treatment delivery, monitoring, guidance and assessment.
This is perhaps the first comprehensive study clearly showing the connection of Doppler ultrasound signals and the creation of gas bubbles from tissue boiling. A literature search revealed one other work making this connection in the context of laser-tissue interactions. The work of Hartley et al. [23] showed two types of Doppler signals. Type 1 was linked to tissue movements due to rapid tissue expansion from laser heating, while type 2 activity was assumed to result from tissue vaporisation. In those cases that type 2 activity was observed in their experiments, it always followed type 1 activity by seconds or tenths of seconds depending on power level and tissue type. Hartley's type 2 activity is consistent with the DUS we observed during thermal ablation by radiofrequency and conductive heating. However, Hartley's et al did not make temperature measurements of direct observation of boiling. The work reported here complements the work of Hartley et al. and provides additional data supporting that the mechanism for the DUS indeed is phase-change.
Acknowledgments
Declaration of interest: V.N., E.G.M. and P.N. were supported in part by the Central Arkansas Radiation Therapy Institute (CARTI). G.S. and E.G.M. were supported in part by NIH grant no. 5R21 CA108678.
References
- 1.Boutros C, Somasundar P, Garrean S, Saied A, Espat NJ. Microwave coagulation therapy for hepatic tumors: Review of the literature and critical analysis. Surg Oncol. 2009;19(1):e22–32. doi: 10.1016/j.suronc.2009.02.001. [DOI] [PubMed] [Google Scholar]
- 2.Carraway WA, Raman JD, Cadeddu JA. Current status of renal radiofrequency ablation. Curr Opin Urol. 2009;19:143–147. doi: 10.1097/MOU.0b013e328323f5c2. [DOI] [PubMed] [Google Scholar]
- 3.Lau WY, Lai EC. The current role of radiofrequency ablation in the management of hepatocellular carcinoma: A systematic review. Ann Surg. 2009;249:20–25. doi: 10.1097/SLA.0b013e31818eec29. [DOI] [PubMed] [Google Scholar]
- 4.Noguchi M. Radiofrequency ablation therapy for small breast cancer. Semin Ultrasound CT MR. 2009;30:105–112. doi: 10.1053/j.sult.2008.10.001. [DOI] [PubMed] [Google Scholar]
- 5.Pennathur A, Abbas G, Schuchert M, Landreneau RJ, Luketich JD. Radiofrequency ablation for the treatment of lung neoplasm. Expert Rev Med Devices. 2008;5:613–621. doi: 10.1586/17434440.5.5.613. [DOI] [PubMed] [Google Scholar]
- 6.Stang A, Fischbach R, Teichmann W, Bokemeyer C, Braumann D. A systematic review on the clinical benefit and role of radiofrequency ablation as treatment of colorectal liver metastases. Eur J Cancer. 2009;45(10):1748–1756. doi: 10.1016/j.ejca.2009.03.012. [DOI] [PubMed] [Google Scholar]
- 7.Shen SH, Fennessy F, McDannold N, Jolesz F, Tempany C. Image-guided thermal therapy of uterine fibroids. Semin Ultrasound CT MR. 2009;30:91–104. doi: 10.1053/j.sult.2008.12.002. [DOI] [PMC free article] [PubMed] [Google Scholar]
- 8.Klimberg VS, Kepple J, Shafirstein G, Adkins L, Henry-Tillman R, Youssef E, Brito J, Talley L, Korourian S. eRFA: Excision followed by RFA – a new technique to improve local control in breast cancer. Ann Surg Oncol. 2006;13:1422–1433. doi: 10.1245/s10434-006-9151-4. [DOI] [PubMed] [Google Scholar]
- 9.Shafirstein G, Hennings L, Kaufmann Y, Novak P, Moros EG, Ferguson S, Siegel E, Klimberg SV, Waner M, Spring P. Conductive interstitial thermal therapy (CITT) device evaluation in VX2 rabbit model. Technol Cancer Res Treat. 2007;6:235–246. doi: 10.1177/153303460700600311. [DOI] [PubMed] [Google Scholar]
- 10.Shafirstein G, Novak P, Moros EG, Siegel E, Hennings L, Kaufmann Y, Ferguson S, Myhill J, Swaney M, Spring P. Conductive interstitial thermal therapy device for surgical margin ablation: In vivo verification of a theoretical model. Int J Hyperthermia. 2007;23:477–492. doi: 10.1080/02656730701591476. [DOI] [PubMed] [Google Scholar]
- 11.Wang Y, Liang P, Yu X, Cheng Z, Yu J, Dong J. Ultrasound-guided percutaneous microwave ablation of adrenal metastasis: Preliminary results. Int J Hyperthermia. 2009;25:455–461. doi: 10.1080/02656730903066608. [DOI] [PubMed] [Google Scholar]
- 12.Clasen S, Boss A, Schmidt D, Fritz J, Schraml C, Claussen CD, Pereira PL. Magnetic resonance imaging for hepatic radiofrequency ablation. Eur J Radiol. 2006;59:140–148. doi: 10.1016/j.ejrad.2006.04.006. [DOI] [PubMed] [Google Scholar]
- 13.Rieke V, Butts Pauly K. MR thermometry. J Magn Reson Imaging. 2008;27:376–390. doi: 10.1002/jmri.21265. [DOI] [PMC free article] [PubMed] [Google Scholar]
- 14.McDannold N. Quantitative MRI-based temperature mapping based on the proton resonant frequency shift: Review of validation studies. Int J Hyperthermia. 2005;21:533–546. doi: 10.1080/02656730500096073. [DOI] [PubMed] [Google Scholar]
- 15.Maruyama H, Yoshikawa M, Yokosuka O. Current role of ultrasound for the management of hepatocellular carcinoma. World J Gastroenterol. 2008;14:1710–1719. doi: 10.3748/wjg.14.1710. [DOI] [PMC free article] [PubMed] [Google Scholar]
- 16.Rubio IT, Henry-Tillman R, Klimberg VS. Surgical use of breast ultrasound. Surg Clin North Am. 2003;83:771–788. doi: 10.1016/S0039-6109(03)00070-7. [DOI] [PubMed] [Google Scholar]
- 17.Thompson M, Klimberg VS. Use of ultrasound in breast surgery. Surg Clin North Am. 2007;87:469–484. x. doi: 10.1016/j.suc.2007.02.002. [DOI] [PubMed] [Google Scholar]
- 18.Bland KL, Gass J, Klimberg VS. Radiofrequency, cryoablation, and other. North Am. 2006;44:805–835. doi: 10.1016/j.suc.2007.02.003. [DOI] [PubMed] [Google Scholar]
- 19.Ramachandran T, Sreenivasan K, Sivakumar R. Water vaporization from heated tissue: Modalities for breast cancer ablation. Surg Clin North Am. 2007;87:539–550. xii. [Google Scholar]
- 20.Rubens DJ, Bhatt S, Nedelka S, Cullinan J. Doppler artifacts and pitfalls. Radiol Clin North Am. 2006;44:805–835. doi: 10.1016/j.rcl.2006.10.014. [DOI] [PubMed] [Google Scholar]
- 21.Ramachandran T, Sreenivasan K, Sivakumar R. Water vaporization from heated tissue: An in vitro study by differential scanning calorimetry. Lasers Surg Med. 1996;19:413–415. doi: 10.1002/(SICI)1096-9101(1996)19:4<413::AID-LSM5>3.0.CO;2-V. [DOI] [PubMed] [Google Scholar]
- 22.Kruskal JB, Oliver B, Huertas JC, Goldberg SN. Dynamic intrahepatic flow and cellular alterations during radiofrequency ablation of liver tissue in mice. J Vasc Interv Radiol. 2001;12:1193–1201. doi: 10.1016/s1051-0443(07)61679-0. [DOI] [PubMed] [Google Scholar]
- 23.Deng CX, Lizzi FL. A review of physical phenomena associated with ultrasonic contrast agents and illustrative clinical applications. Ultrasound Med Biol. 2002;28:277–286. doi: 10.1016/s0301-5629(02)00475-1. [DOI] [PubMed] [Google Scholar]
- 24.Hartley CJ, Ying H, Motamedi M. Ultrasonic Doppler detection of laser-tissue interaction. Ultrasound Med Biol. 1994;20:655–663. doi: 10.1016/0301-5629(94)90114-7. [DOI] [PubMed] [Google Scholar]


