

Abstract
In order to understand the fundamental processes leading to biomineralization, this chapter focuses on the earliest events of homo/heterogeneous nucleation from an initial supersaturated solution phase and subsequent growth involving various possible precursor phases (amorphous or crystalline) to the final mineral phase by specific template and other influences. We also discuss how the combination of macroscopic constant composition and microscopic atomic force microscopy provides insights into the physical mechanisms of crystal growth and phase stability and the influences of proteins, peptides or other small molecules.
Biodemineralization reactions of tooth enamel and bone may be inhibited or even suppressed when particle sizes fall into certain critical nanoscale levels. This phenomenon actually involves particle-size-dependent critical conditions of energetic control at the molecular level. Clearly, this dissolution termination is a kinetic phenomenon and cannot be attributed to reaction retardation as a result of surface modification by additives. Almost all biomineralized structures are highly hierarchical at many different length scales. At the lowest level they often consist of tiny crystals, typically tens to hundreds of nanometers. This size is not arbitrary; rather, it seems to give biominerals such as bone and tooth remarkable physical characteristics.
Keywords: additive effect, biomineralization, constant composition, crystal growth, crystallization modulation, dissolution, homo/heterogeneous nucleation
1. Introduction
Nature is parsimonious in its use of ingredients and crystallization pathways, but even so, under mild physiological conditions, it achieves a tremendously diverse assortment of mineralized materials with a high degree of complexity and hierarchical structure. These highly organized composites, which exhibit superior mechanical strength [1,2] and other specialized functions [3–5], are therefore of interest to the emerging field of nanobiotechnology. In biomineralization, such as in the biosynthesis of bone [6], dental structures [7], mollusk shells [8], diatom cell walls [9], and bacterium magnetotactic particles [10], a significant aspect of biological control over mineral formation is through protein/inorganic recognition and interaction.
The studies on proteins extracted from biomineralized tissues that can control the nucleation, orientation, polymorphism, and morphology of the mineral phase have prompted a number of in vitro biomimetic mineralization studies in the presence of natural proteins [11,12] and synthetic organic molecules [13,14]. There is a substantial body of evidence to suggest that some proteins serve as soft templates (substrates) that control the sites for nucleation and the orientation of the resulting hard crystals [15]. For example, the collagen fibers in bone self-assemble into bundles with a periodicity and control over both the orientation and location of the initial crystal nuclei at the molecular scale [16,17]. The templated nucleation and subsequent growth of minerals at the organic-solution interface are further modulated by other soluble proteins or small impurities.
A central tenet of biomineralization is how organized organic surfaces can control the nucleation of inorganic materials by geometric, electrostatic, and stereochemical complementarity between nuclei and functionalized substrates. In general, the effect of the organic substrate is to lower the nucleation activation energy [18]. Moreover, equilibrium crystal phase and habit are controlled by the depths and shapes of the energy minima [18]. By varying the heights of the energy barriers, the growth kinetics can be controlled, and non-equilibrium final or intermediate states can be selected [15].
In addition to biological macromolecules, moderately-sized organic molecules [19,20] and small inorganic molecules [21,22] behaving as growth modifiers may influence mineralization kinetics and energetics and the shapes of crystals [23]. Other factors, including genetic and environmental processes and crystallization spatial (cell compartment) constraints, will also influence these physical crystallization processes [24].
In order to achieve a fundamental understanding of the processes leading to biomineralization, it is necessary to first focus on the earliest nucleation events from an initial solution phase and subsequent growth from various possible precursor phases (amorphous or crystalline) to the final mineral phases by specific templated controls and other additive molecule influences [25,26].
2. Nucleation and Crystal Growth
2.1. Nucleation
Despite the emergence of several theories in recent decades [27–30], much confusion still surrounds the dynamic processes. This has been due in part to the limitations of existing experimental approaches. Colloidal suspensions have been used as experimental model systems for the study of crystal nucleation and structural phase transitions [31–33], as their crystallization phase diagrams are analogous to those of atomic and molecular systems, but they can be visualized using confocal microscopy [34]. However, as the thermodynamic driving force remained undefined in these experimental systems, important factors such as the critical nuclei size and nucleation rate are at best semiquantitative. Zhang and Liu recently presented quantitative measurements of the pre- and post-nucleation processes of colloidal spheres by a new imaging approach under well-defined thermodynamic driving forces [35]. Moreover, computer simulations have been widely used to obtain quantitative predictions of homogeneous and hetergeneous nucleation in the absence and the presence of impurities [36–39].
The formation of a solid from a solution through crystallization is, at first glance a simple, familiar process. But despite Ostwald's 1897 work on crystal nucleation [40], and Gibbs's thermodynamic results [41], and development of classical nucleation theory (CNT), this process is not fully understood [41]. The central problem in nucleation theory and experiment is to express the nucleation rate as a function of the controlling parameters. The most important parameter for nucleation is the thermodynamic driving force or the supersaturation. To model the thermodynamic properties of a solution, it is first necessary to know the solubility product (Ksp) for all possible solid phases in a precipitation reaction at a given temperature.
2.1.1. Solubility and Thermodynamic Driving Forces
Interaction between ions in electrolyte solutions reduces the effective free ion concentrations as compared with the expected stoichiometric values as defined by equation (1) [42]:
| (1) |
where ai is the activity, ci is the concentration of the ith ion and y± is the mean activity coefficient, which can be expressed using an extended form of the Debye-Hückel equation (2) such as that proposed by Davies [42],
| (2) |
In equation (2), zi represents the charge on the ith ion, and A is a temperature-dependent constant. The ionic strength, I, usually adjusted to the physiological level for biomimetic mineralization studies, is defined as:
| (3) |
The crystallization of sparingly soluble electrolytes (this includes most biominerals) from a supersaturated solution may result from mixing cationic and anionic components, for example [26],
| (4) |
where n and m are the cationic and anionic valences, respectively. The actual ion activity product (IAP) and its value at equilibrium (e) (Ksp) (i.e., solubility product for a precipitation reaction)B are given by and [26].
The chemical potential of species of i is given by [26]:
| (5) |
where is the standard state (ai = 1) chemical potential of species i. This will yield the thermodynamic driving force,
| (6) |
The thermodynamic driving force for crystallization is often expressed in terms of the relative supersaturation that is defined by [26]:
| (7) |
and equation (6) can then be rewritten
| (8) |
The relative supersaturation can be expressed by
| (9) |
where S is the supersaturation ratio. Thus for hydroxyapatite (HAP),
For S = 1, the mineral and solution are in equilibrium, for S < 1 the solution is undersaturation and the mineral will dissolve, and for S > 1 the solution is supersaturated and the mineral will grow. However, a commonly used definition of S is given by [43]:
| (10) |
where υ is the number of ions in a formula unit. There are many advantages of using the mean to express IAP and Ksp; data for salts with different stoichiometries can be directly compared and thus the values of S would not depend on the choice of chemical formula. For example, Ksp = 2.35 × 10−59 for the half unit cell representation, Ca5(PO4)3OH, and Ksp = 5.52 × 10−118 for the corresponding full unit cell expression of Ca10(PO4)6(OH)2. From this example one can see that , which points to the necessity of normalizing by the number of growth units when making comparisons between minerals with different stoichiometries.
2.1.2. Homogeneous Nucleation
Nucleation is the initial appearance of a new phase during a first-order phase transition, in which small nuclei formed in a supersaturated solution overcome a nucleation barrier. Small crystal nuclei form spontaneously in supersaturated solutions, but unless their size exceeds a critical value – the so-called critical nucleus – they will re-dissolve rather than grow [26,36,37]. Using macroscopic arguments to estimate the free energy required to form a crystallite, classical nucleation theory (CNT) offers a simple thermodynamic explanation for why small crystal nuclei are less stable (that is, they have a higher free energy) than the supersaturated parent phase. The decrease in free energy due to the transfer of N particles from the metastable liquid to the solid state is approximated as NΔμ, where Δμ = μsolid − μliquid is the difference in chemical potential between the solid and the liquid state (Δμ < 0) [26,36,37]. The CNT estimate for the free-energy cost involved in the creation of the surface area A of the nucleus is γA, where γ is the surface free energy of the solid-liquid interface [44]. The free-energy costs are greater for small nuclei because they have a higher ratio of surface area to bulk volume, so small crystallites have to reach the ‘critical nucleus’ to survive. According to CNT, the total Gibbs free-energy cost to form a spherical crystallite with radius r is [36,37,44]:
| (11) |
where ρs is the number-density of the solid (ρs = 1/Ω, where Ω is the volume per molecule). The first term on the right in equation (11) is a ‘bulk’ term that expresses the fact that the solid is more stable than the supersaturated fluid. This term is negative and proportional to the volume of the crystallite. The second is a ‘surface’ term that takes into account the free-energy cost of creating a solid–liquid interface. This term is positive and proportional to the surface area of the crystallite. The function ΔG goes through a maximum where d ΔG/dr = 0 at and the height of the nucleation barrier is [36]:
| (12) |
The crystal nucleation rate J per unit volume at which nuclei are formed depends exponentially on ΔGcrit:
| (13) |
where T is the absolute temperature, k is Boltzmann's constant and κ is a kinetic preexponential. Equations (12) and (13) show that the height of the nucleation free-energy barrier ΔGcrit is proportional to γ3/|Δμ|2 emphasizing how strongly the nucleation rate depends on supersaturation and interfacial energy (γ).
Direct observation of crystal nucleation is difficult, often because once crystal nuclei are large enough to be seen they are well beyond the critical stage. Simulations provide insights into the structure, shape and packing of critical nuclei, as illustrated by Auer and Frenkel [36]. Analysis of snapshots of a critical nucleus observed in their simulations showed that the face-centered cubic (f.c.c.) and hexagonal close-packed (h.c.p.) stackings are equally likely [36]. In the early stages of nucleation, the random-hexagonal close-packed (r.h.c.p.) structure is simply more stable than f.c.c.. Only later does this metastable r.h.c.p. structure transform into the stable f.c.c. structure [36]. Auer and Frenkel also suggested that if the range of sizes of the suspension colloidal particles is large enough, the colloidal mixture will be truly amorphous and cannot crystallize due to increase of the solid–liquid interfacial free energy at high supersaturations [37]. These simulation results provide possible clues that the pathway to the final crystalline state will pass through all less stable states in order of increasing stability [45], or the resulting amorphous materials cannot transform into the crystallite phase.
The first observed example of such a process in a living organism is from the chiton, a mollusk that has mineralized teeth that are used for scraping rocks to extract algae buried beneath the surface [46]. The outer layer of the tooth contains magnetite, a hard magnetic mineral. It forms from a disordered ferrihydrite precursor phase [47]. The inner layer of the tooth contains carbonated apatite, the same mineral present in bone. It forms by way of an amorphous calcium phosphate precursor phase [48]. The hallmark of the biological strategy for making certain mineralized skeletal parts is that the first-formed solid deposits as disordered and often hydrated phases that, with time, transform into the stable crystalline deposit [45,46].
CNT assumes that the (pre-) critical nuclei are effectively spherical due to surface tension, and have the same structure as the stable bulk phase that is nucleating. However, Gasser et al. have observed elliptical nuclei by using confocal microscopy in which the crystallite surfaces are quite rough [34]. The surface roughness is associated with high surface free energy which may facilitate the attachment of particles to the nucleus, thereby contributing to a more rapid nucleation [15]. The assumption of a spherical nucleus may be disputed because the critical nucleus could be anisotropic with different free energy costs associated with different faces. This would have repercussions on the growth rate as different faces are likely to grow at different rates [49]. Yau and Vekilov reported direct observations of small (100-nanometer scale) “crystallites” taking part in the very first stages of crystallization of the protein apoferrition, which has a relatively slow time scale for crystallization because of its large size. Surprisingly, the critical nucleus of apoferrition resembles a raft, consisting of a nearly planar layer of crystal with a partial second layer on top [50]. The shape of the critical nucleus could have a large effect on its energy and therefore on the subsequent rate of crystal formation. One possibility is that the critical nucleus is not crystalline, but rather a disordered, liquid-like aggregate of 20–50 molecules, with crystallinity appearing only at later stages in the growth process [51].
2.1.3. Heterogeneous Nucleation
The addition of small “seed” particles to a supersaturated solution can greatly increase the rate at which crystals nucleate. This process is understood, at least qualitatively, when the seed has the same structure as the crystal that it spawns [38,40]. More than a century ago, Ostwald explained that supercooled liquids can be made to crystallize by the introduction of a small seed crystal. However, the microscopic mechanism of seeding by a ‘foreign’ substance is not well understood.
The classical theory of nucleation provides a natural explanation as to why a seed crystal or a foreign object facilitates crystal nucleation [44]; in the absence of a seed, a rare, spontaneous fluctuation is needed to form a crystal nucleus that exceeds the critical size. However, crystallization can proceed spontaneously if we add a seed crystal or a foreign object that is larger than the critical nucleus to the metastable liquid phase.
In the process of homogeneous nucleation, increase in the size of an embryo must overcome a free-energy nucleation barrier before it can reach a critical radius, and become a stable growing crystal. In the presence of foreign objects (organic substrates for biomineralization processes), the nucleation barrier is reduced to [26,52,53]:
| (14) |
where f(m, x) is the interfacial correlation factor, varying from 0 to 1, describing the lowering of the nucleation barrier due to the presence of additive molecule or the substrate [53]. This factor will depend on supersaturation, the interfacial interaction parameter m and the relative size of foreign particles x. m = (γaf − γac)/γcf, where γaf and γac are the interfacial free energies of the foreign particle (a)-fluid (f)-interface and of foreign particle-crystal nucleus (c) interface; γcf is the interfacial free energy between the crystal nucleus and the fluid, depending on the correlation and structural match between the nucleating phase and the substrate [26,52]. x = Rs/rc(rc, the critical size of nuclei, rc = 2Ωγcf/kT ln(1 + σ), where Ω is the molecular volume per growth unit and Rs is the average radius of spherical shaped foreign particles) [26]. When the interaction between the nucleating phase and the substrate is optimal, f(m, x) → 0. Conversely, if the interfacial correlation is very poor, f(m, x) → 1, and the additive molecule or the substrate exerts almost no influence on the nucleation barrier. It can be seen that f(m, x) describing the interfacial correlation between biominerals and substrates will increase with supersaturation [26,52,53]. This implies that an increase of supersaturation will drive the substrates/biominerals from an interfacial structural match state (a lower f(m, x)) to a state of higher mismatch (a higher f(m, x)). This phenomenon is referred to as supersaturation-driven interfacial structural mismatch. Figure 1 illustrates that changes from one state to the other occur abruptly at certain supersaturations (such as A, B, … in Figure 1) due to the anisotropy of the crystalline phase [53]. It follows that a good structural synergy between biominerals and additive molecules or substrates will promote an ordered biomineral structure and occurs only at low supersaturations [53].
Figure 1.
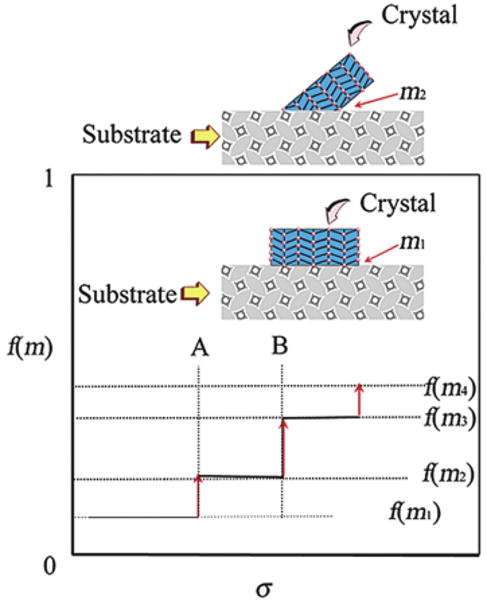
Supersaturation-driven interfacial structural mismatch. With the increase of supersaturation, the interfacial correlation factor f(m, x) will increase abruptly at certain supersaturations, such as A, B, …, corresponding to a transition from an ordered and structurally matched to a less ordered and structurally mismatched biomineral/substrate interface. m1 > m2 > m3 > m4. Reproduced from [53] by permission of the American Chemical Society, copyright 2003.
Taking into account the effect of the additive molecule or the substrate on both the nucleation barrier and the transport process, the nucleation rate is given by [26,53]:
| (15) |
where N0 is the density of the foreign particles or substrates, B is the kinetic constant.
The technical difficulties involved in directly evaluating crystal nucleation have led to other approaches to initial crystallization events. One of the most common ways to characterize the kinetics of nucleation is to measure the induction period (ts) prior to nucleation at different supersaturations. By definition [54], the nucleation rate J can be expressed as equation (16),
| (16) |
where V is the volume of the system. Combining equations (15) and (16) yields equation (17),
| (17) |
where , remains constant under a given set of conditions [53]. According to equation (17), the plot of ln(ts) against 1/[ln(1 + σ)]2 will give rise to a straight line whose slope is determined by κ and f(m) [26,53]. Obviously, for a given system (constant κ and B), the slope of the straight line will change accordingly to f(m, x). In this sense, the slope of the ln(ts) against 1/[ln(1 + σ)]2 plot gives the relative f(m, x) for the system [26,53]. Through the analysis of f(m, x) changes and correspondingly the interfacial correlations between the substrate and both HAP and calcite crystalline phases in terms of the variation of the slope, collagen fibers are found to serve much better as templates than common foreign particles by effectively lowering the nucleation barrier of HAP [53]. Interestingly, some biomolecules such as chondroitin sulfate may suppress the supersaturation-driven interfacial structure mismatch and promote the formation of ordered HAP crystallites [55,56].
Another example of the supersaturation-driven structure mismatch is found in studies of the ability of amelogenin in controlling apatite nucleation and growth [57]. A relatively low supersaturation was selected in order to acquire a slow and well-controlled mineralization by magnifying the amelogenin additive/template effect on the nucleation at relatively low protein concentrations. A precisely controlled constant composition (CC) crystallization method sensitive to ion concentration changes at the nanomolar level is used because it provides reliable rates of crystal growth and induction times of nucleation [58]. A relatively low supersaturation enabled data acquisition from well-controlled mineralization experiments in which effects of amelogenin on nucleation could be readily detected at relatively low protein concentrations. During the induction period, the solution concentration and pH were unchanged. Once nucleation took place, the reduction in solution pH with time due to deprotonation of acidic phosphate ions associated with the formation of mineral precipitates was monitored. Corresponding pH profiles with and without protein showed a characteristic nucleation reaction process.
Amelogenin dramatically accelerated nucleation by decreasing the induction time in a dose-dependent manner in this controlled CC in vitro crystallization system (Figure 2a). Remarkably, at relatively low supersaturations (σOCP = 1.45) and very low protein concentrations, elongated microstructures, similar in appearance to apatitic crystals in enamel were formed (Figure 2c). High resolution TEM shows a possible formation mechanism in which calcium phosphate nanocrystallites (3–4 nm) are formed and, bind with the hydrophilic “tails” of amelogenin nanospheres (3–10 nm, dynamic light scattering data) to form organic-inorganic hybrid building blocks. These then co-assemble and aggregate through interfacial structural synergy between structured amelogenin assemblies and apatite nanocrystallites [57]. When the nucleation barrier was overcome, the second, crystal growth, stage of the phase transition began. Figure 2d shows a typical CC crystal growth curve after the long induction time. The lowering of the pH triggered the simultaneous addition of two titrant solutions to maintain constant the pH, the concentrations of calcium and phosphate, and the ionic strength of the reaction solutions. A more rapid titrant addition reflected the exponential growth of crystals on the nuclei formed in the heterogeneous nucleation stage. SEM shows that thicker apatite crystals were grown in the presence of 5.0 μg mL−1 amelogenin, but they retained the ribbon-like morphology (Figure 2e). In accordance with the theoretical prediction, at a high supersaturation (σOCP = 2.32), the induction times for supersaturated solutions in the absence and presence of amelogenin show no significant change [57]; less ordered structures were formed when compared to those at a lower supersaturation (σOCP = 1.45). Notably, the structures are more ordered in the presence of amelogenin (Figure 3b) when compared to the control (in the absence of 5.0 μg mL−1 amelogenin) (Figure 3a).
Figure 2.
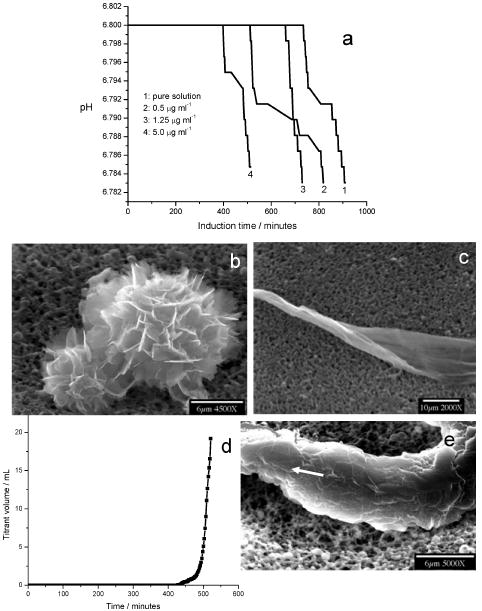
(a) pH curves for apatite nucleation in the absence and the presence of 5.0 μg mL−1 amelogenin at a low supersaturation (σOCP = 1.45, pH = 6.800 and 37 °C). Amelogenin dramatically accelerates the nucleation by decreasing the induction time in a dose-dependent manner. SEM images show calcium phosphate crystals, nucleated in the absence (b) and presence (c) of amelogenin, and collected from the bulk solution by filtration following the induction period. (d) CC Plot of titrant addition as a function of time for apatite crystal growth in the presence of 5.0 μg mL−1 amelogenin. (e) SEM of an ordered and thickened ribbon-like crystal. Reproduced from [57] by permission of the American Chemical Society, copyright 2007.
Figure 3.
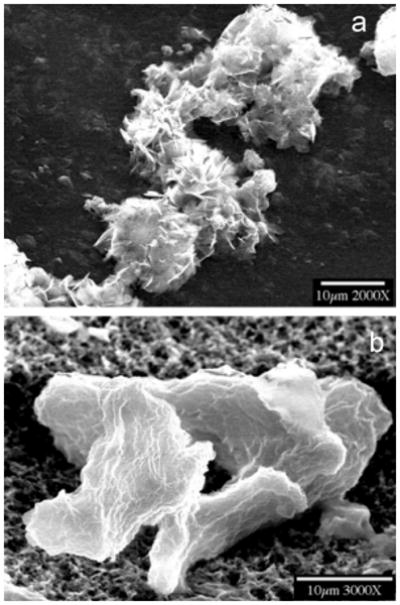
SEM of crystals formed at a high supersaturation (σOCP = 2.32, pH = 6.800 and 37 °C). Less ordered crystals are formed in the absence (a) and presence (b) of 5.0 μg mL−1 amelogenin. Reproduced from [57] by permission of the American Chemical Society, copyright 2007.
This heterogeneous crystallization study [57] provides experimental evidence to support not only the concept that templating by amelogenin very early in the crystallization process facilitates the formation of developing enamel crystals, but also that it is necessary to carefully select the driving forces (supersaturations) for simulated in vitro biomimetic mineralization studies. Nucleation and mineral growth may follow different mechanisms across the continuum of driving force.
The seed size of a foreign substance rather than a crystal of the same material will affect nucleation. The increase of foreign particle size may lower f(m, x) and promote the nucleation rate at lower supersaturations. Small particles may control the nucleation kinetics at higher supersaturations [59]. Cacciuto et al. have found that, to be effective crystallization promoters, the seed particles need to exceed a well-defined minimum size. Just above this size, seed particles act as crystallization “catalysts” [38]. Below this critical size, the seed hardly affects the height of the nucleation barrier; the precritical nuclei break away from the seed surface, and the critical nucleus is only formed in the bulk. This nucleus is therefore similar to the one observed in homogeneous nucleation [38]. As each crystal nucleus is detached, the seed again becomes free to produce a new crystal. As a consequence, the number of crystallites will be much larger than the number of seeds and the result is that the final crystallites will be small [38]. This has important consequences for the size distribution of crystallites formed in heterogeneous nucleation; large, nearly flat seeds tend to produce one single crystal that grows to macroscopic size [38,60]. In addition, surface properties of flat seeds such as amphiphilicity will also affect crystal nucleation and growth. An interesting result has been reported, after surgery, for the potential calcification of intraocular lens (IOL) surfaces implanted in cataract patients [61,62]. A hydrophilic surface may induce the nucleation and growth of octacalcium phosphate (OCP) crystallites under biological conditions when IOL surfaces were modified with functional groups such as carboxylate serving as active nucleation sites.
2.2. Crystal Growth
2.2.1. Constant Composition Kinetics
Constant composition (CC) is a quantitative crystal growth method where growth rates can be measured systematically as a function of the parameters controlling crystallization, especially for monitoring a slow reaction at very low driving forces. As a macroscopic crystal growth technique, CC overcomes the problems associated with the changing solution composition during crystallization and the chemical potential of the solution species that are maintained constant during the reaction [58]. For example, in seeded calcium phosphate crystallization, the initial consumption of crystal lattice ions, accompanying crystal growth, is detected by a change in the hydrogen ion activity as sensed by a glass electrode. The lowering of the pH is used to trigger the simultaneous addition of two titrant solutions from stepper-motor-driven burets that serve to maintain constant pH, the concentrations of calcium and phosphate, and the ionic strength of the reaction solutions. The crystal growth rate is obtained from the titrant addition rates after normalizing for the crystal surface area.
The CC method also allows the measurement of dissolution rates and induction times of homogeneous/heterogeneous nucleation. Although CC has many advantages for quantitative studies of crystal nucleation and growth, it is a bulk method with a limited ability to provide molecular scale information. Atomic force microscopy (AFM) is a complementary technique to quantify crystallization kinetics of specific crystal faces.
2.2.2. Atomic Force Microscopy Step Dynamics
Growth takes place by the deposition and incorporation of solute molecules from the bulk onto the steps on crystal surfaces, causing them to advance quickly along the surface, perpendicular to the step [63]. The steps themselves are incomplete, containing kinks that are the most active sites for growth. The growth of crystals by facets usually occurs in the classic spiral pattern predicted by Burton, Cabrera, and Frank (BCF) [64,65] (Figure 4a), whereby one or more screw dislocations on the crystal surface provide an unending source of steps. The important parameters controlling the growth rate are the energy required to create a step at the crystal surface and the free-energy barrier for an adsorbed solute molecule to be incorporated into the crystal [63]. Hannon et al. used low-energy electron microscopy to provide a real-time picture of the motion of steps on the surface, and such spiral shapes were observed [66]. Figure 4b shows the average distance between two steps as λ0 and their heights as dhkl. The growth rate of the surface is given by Rhkl = νstepdhkl/λ0. In the case of crystals grown from solutions, the delivery of molecules at the steps is governed by the diffusion of solute molecules from solution to the kinks (Figure 4c). In this process, the incorporation of these ‘growth units’ into kinks is rate-determining at relatively low supersaturation. At higher supersaturations, a “birth and spread” growth model predicts two-dimensional (2D) nucleation on existing crystal surfaces [67]. Pina et al. observed anisotropic growth of 2D nuclei and structural-induced self-inhibition of spiral growth of barite crystals [68]. Clearly, these results of crystal growth are limited to specific experimental conditions with various driving forces and require modification to provide a general description of crystal growth [69].
Figure 4.
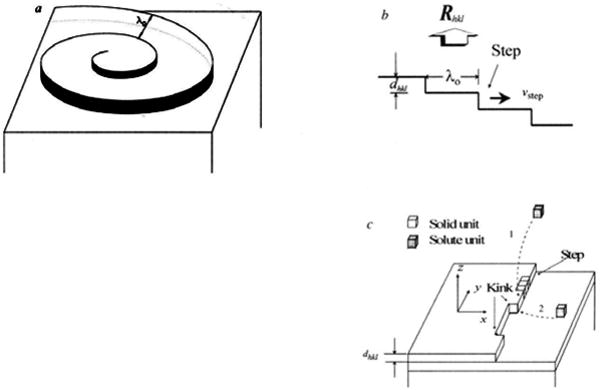
(a) Crystal surface growth spiral from solution. The spiral is rotating with constant angular velocity under constant supersaturation Δμ/kT(Δμ = μf − μs, where μf is the chemical potential of a solute molecule and μs that of the crystal molecule). The spiral is guided by the screw dislocation center. Some distance from the center, the spiral becomes roughly equivalent to concentric circular steps with a separation λ0 ≈ 19rc [29]. Here rc is the radius of the two-dimensional critical nucleus given by rc ≈ γ̄step Ω/Δμ, γ̄step is the average step energy of a step per growth unit and Ω is the molecular volume. Therefore, λ0 ∝ γstep at a given Δμ/kT. (b) From a two-dimensional cut through a, we see that the growth rate of a face (hkl), Rhkl is equal to the flux of steps given by Fstep= νstepρstep= νstep/λ0 times dhkl (ρstep is the step density). So Rhkl= υstepdhkl/λ0. (c) Surface model showing steps and kinks. A growth unit can be incorporated into the crystal structure at kink sites. The shape of υstep depends on the means of delivery of growth units to the steps. For the growth of crystals from a solution, the surface diffusion of solute molecules to steps (route 2) is irrelevant because the mean square displacement of an adsorbed solute molecule at the surface is short. Solute molecules are delivered directly from the bulk to steps at the surface by volume diffusion (route 1). This includes two main steps: the delivery of growth units to the steps by means of volume diffusion, and the integration of growth molecules into the crystal at kinks. At relatively low supersaturations, the latter is the rate determining step, and the rate is proportional to the concentration of adsorbed solute molecules XA(hkl) around the kinks, and exp is the activation free energy for adsorbed solute molecules to be incorporated into kinks; is the kink density and XA(hkl) is the solute concentration at the face (hkl)). Therefore, for a given Δμ/kT. The step energy γstep per structural unit corresponds to the energy cost to create a step of a structural unit length. The kink energy γkink is then the energy cost to create a kink at a step. Assume that the step energy in the x-direction (shown here) is , and in the y-direction . It can easily be seen that γkink in the x-direction step is roughly equal to , and in the y-direction step is . If . Otherwise, the average step energy γ̄step is equal to the average kink energy γ̄kink. Reproduced by permission from [63].
Many AFM studies have investigated step velocity (υi) and morphology [15]. A basic parameter controlling step growth is the step length; the classic Gibbs-Thomson (G-T) effect predicts that the critical length (Lc) near equilibrium is related to the step-edge free energy (γ) and supersaturation (σ) (Lc ∝ γ) [70]. Therefore, the step free energy can be obtained from the critical length as a function of supersaturation. Beside the aforementioned parameters, AFM studies of crystal growth provide molecular-scale information defining a kinetic coefficient (β) based on the following equation.
| (18) |
where a and ae are the actual and equilibrium solute activities; in the regime of linear kinetics, β is a constant known as the kinetic coefficient [71]. The magnitude of β is controlled by two primary factors, the first is the density of kink sites along the step nk and the second the net probability of attachment to a site [72]. β is assumed to scale with surface impurity coverage in the presence of impurity.
2.3. Crystallization Modulation through Impurity Interactions
Impurities are either unavoidable in crystal growth processes or intentionally introduced to modify the mineralized products. These growth modifiers can be biomacromolecules including peptides and proteins, but small inorganic modifiers especially in cellular fluids, may also play a role [73]. Indeed, organisms have already applied these strategies to tune physical and chemical properties, reflecting a specific control over the nucleation, growth and shape of mineralized tissues. For example, in the case of inorganic impurities, fluoride ions incorporate into the outer layer of tooth enamel that are composed mainly of HAP, and the formation of a fluorapatite (FAP) film reduces the onset of apatite dissolution [74]. In contrast, enhanced mineral solubility through magnesium incorporation inhibits calcite growth [75]. Some small organic molecules such as chiral amino acids adsorbed to calcite surface steps result in macroscopic crystal shape modifications by a surfactant-mediated change of interfacial energies [20].
In a review of AFM step dynamics influenced by impurities [15], De Yoreo and Vekilov proposed four mechanisms: (1) step pinning, (2) incorporation, (3) kink blocking, and (4) step edge adsorption. Each of these major mechanisms for growth inhibition exhibits a characteristic dependence of step speed on supersaturation and impurity concentration [15]. In the following section, we will discuss how a combination of macroscopic CC and microscopic AFM provides an understanding of the dynamics of crystallization and inhibition of calcium phosphates and calcium oxalate in the presence of impurities or additives.
2.3.1. Cabrera-Vermilyea Model of Step Pinning
Recent AFM studies of the atomic-scale dynamics of the crystallization of calcium oxalate monohydrate (COM), the primary constituent of most human kidney stones, have provided a comprehensive molecular-scale view of COM shape modification by citrate [19,76]. In the absence of citrate, AFM images show that growth of COM crystals occurs on atomic steps generated at dislocation hillocks on the (−101) face (Figure 5a) [77]. Addition of citrate markedly alters the morphology and kinetics on the (−101) face but has little effect on the (010) face. This high selectivity leads to preferential binding to steps on the (−101) face. The changes in steps at a dislocation hillock on the (−101) face are shown in Figure 5b, where the [101] step has been slowed and dramatically roughened because of step pinning. SEM images of crystals grown by CC in pure solution showed that the crystals developed a prismatic habit with (−101), (010), and (120) as the principal faces and were elongated along the [101] direction (Figure 5c). In the presence of citrate, the crystals were less elongated and this effect increased with increasing citrate concentrations (Figures 5d and 5e) [78]. These AFM and SEM results have confirmed that citrate molecules, with high specificity, adsorb to step-edges or accumulate on terraces ahead of migrating steps, thereby pinning step motion and decreasing the velocity of the steps.
Figure 5.
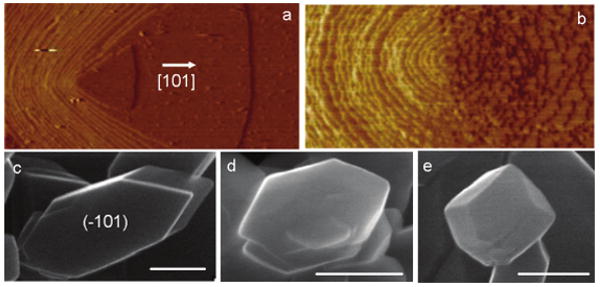
Morphology modification of COM crystals. AFM images of dislocation hillocks on a 1.8 × 1 μm (−101) face (a) in pure solution and (b) 60 minutes after the introduction of 1.0 × 10⁻⁵ mol L−1 citrate. SEMs of COM crystals grown in pure supersaturated solution (c) and in the citrate-containing solutions at citrate concentrations, 2.5 × 10⁻⁴ mol L−1 (d), and 10−3 mol L−1 (e). Scale bars: 600 nm. Reproduced from [77] and [78] by permission of the American Chemical Society, copyright 2006.
The classic theory of Cabrera and Vermilyea (C-V) postulates that inhibition of crystallization by impurities is the result of pinning of step motion [15,79]. In this model, the effects of impurities on crystal growth are caused by their adsorption at kinks, edges and terraces of a growing surface, thus reducing the growth rate by hindering the movement of growth steps [80,81]. Impurities adsorbed at step-edges or on the terraces ahead of migrating steps, create a field of ‘impurity stoppers’ that act to block the motion of elementary steps, thereby decreasing their velocity. When the average spacing between impurity molecules (Li) is less than a critical distance, whose magnitude is approximately given by the Gibbs–Thomson critical diameter (2rc), the steps are unable to advance. As a consequence, the C-V model predicts the presence of a “dead zone”, a region of positive supersaturation (σd) where no growth occurs. As the supersaturation is increased beyond σd and the critical diameter becomes smaller than Li, the steps begin to squeeze through the ‘fence’ of impurities and the step speed (υi) rises rapidly, eventually reaching that of the pure system [82]. Despite the general acceptance of this theory, no macroscopic observations of growth rates have ever been directly linked to this microscopic impurity step-pinning model. Consistent with the AFM step speed observations, bulk CC growth rates gradually decreased with increase of citrate concentration at different supersaturations (Figure 6a).
Figure 6.
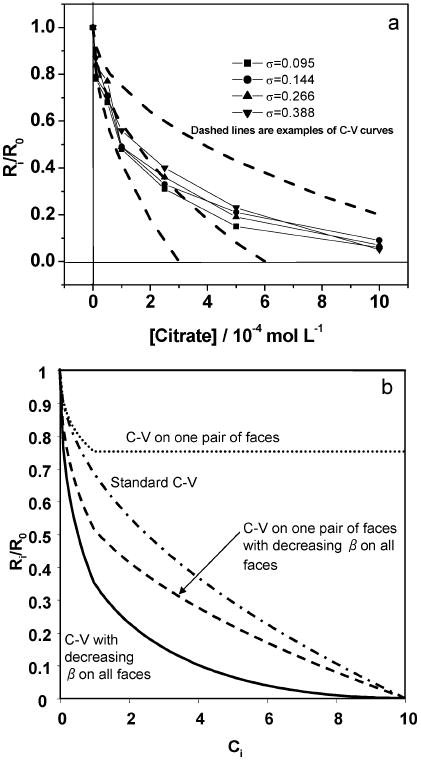
(a) Relative growth rates of COM crystals in the presence of various concentrations of citrate at different supersaturations. R0 and Ri are the rates of reaction in the absence and presence of citrate, respectively (pH 7.0, 37 °C and I = 0.15 molL −1). Dashed lines in (a) are examples of the C-V curves. (b) The C-V curves for four different cases. Reproduced from [78] by permission of the American Chemical Society, copyright 2006.
Irrespective of which faces are affected, the theoretical C-V relationship for the relative growth rate and impurity concentration is as follows:
| (19) |
where D is a coefficient that reflects a combination of geometric factors of the crystal lattice, sticking probability, and impurity lifetime on the surface. Ci is the bulk solution concentration of impurity. rc is the Gibbs–Thomson critical radius that is given by:
| (20) |
Here γ is the step-edge free energy per unit step height, Ω is the molecular volume, k is Boltzmann's constant, and T is the absolute temperature.
There are deviations between the theoretical C-V curves and CC experimental results (Figure 6a). Recent AFM step movement measurements show that the kinetic coefficient β on the (−101) face is decreased by the addition of citrate [83]. Therefore, in addition to pinning of step motion on the (−101) face through the Gibbs–Thomson effect, the decrease of β with increasing citrate levels on all faces including (010) and (120) faces must be considered (Figure 6b). Therefore, we can use the fact that step pinning predicts a non-linear dependence of R on σ to assess the degree to which high citrate levels lead to step pinning as distinct from a reduction in β on the (010) and (120) faces. For any face, we can write:
| (21) |
where G is a number of order 1 that depends on the geometry of the crystal lattice and is of order 2 for a square lattice [81]. The first term of equation (21) reflects the effect of step pinning, and the second gives the decrease in β. E is a proportionality constant that, like D, reflects a combination of geometric factors, impurity lifetimes, and sticking probabilities. Growth on the (−101) face ceases at low citrate levels. If the continued decrease in Ri/R0 with increasing citrate, seen in Figure 7a, were due to step pinning on the other two faces, then, for all values of Ci and σ used here, the inequality, σ > σ* must hold otherwise there would be no growth. Then, according to equation (21), a plot of R versus σ should be an increasing non-linear function of σ. As Figure 7a shows, while there is a small amount of curvature at low σ, over most of the range of σ used here, Ri/R0 is constant. Figure 7b emphasizes this point by showing the behavior of equation (21) for a range of impurity levels in: (1) the limit of no pinning (G = 0 in equation (21)) and (2) the limit of constant β (E = 0 in equation 21). These results show that the decrease in β is the dominant effect of citrate on the (010) and (120) faces. In addition, the three different values of D, by fitting the data to an equation of the form given in equation (19) where , are considered based on the fraction of each face in all 8 faces of COM crystals.
Figure 7.
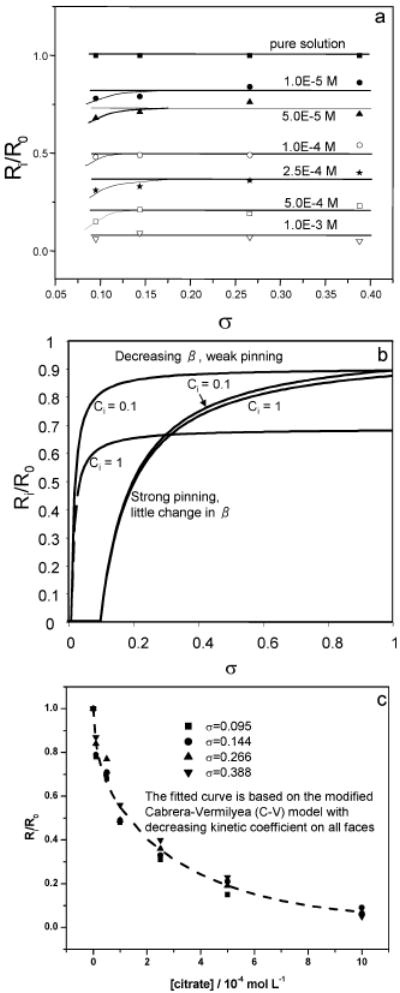
(a) Plots of relative growth rates, Ri/R0 against σ for COM crystallization kinetics in the presence of various concentrations of citrate, showing that while there is a small amount of curvature at low σ, over most of the range of σ used here, Ri/R0 is constant and is independent on supersaturation for σ < σ*. (b) Predications of the behavior of equation (21) for a range of impurity levels in the limit of no pinning (G = 0 in equation (21)) and the limit of constant β (E = 0 in equation 21), showing that the decrease in β is the dominant effect of citrate on the (010) and (120) faces. (c) Fit of experimental data to the C-V model modified to take into account decreasing b on all faces with increasing citrate. The fitted dashed line is calculated using equation (23). Reproduced from [78] by permission of the American Chemical Society, copyright 2006.
The behavior of the COM-citrate system was found to be in reasonable agreement with the predictions of the C-V model. Equation (21) constrains the number of parameters needed to fit the data to a C-V model with decreasing kinetic coefficient:
| (22) |
and gives A(−101) = 165.1, B(−101) = 17.8, B(010) = 13.58 and B(120) = 7.0. The final form of the modified C-V is given by equation (22):
| (23) |
The dashed curve in Figure 7c shows this model gives an excellent fit to the data. This is first experimental evidence of the inhibition of bulk COM crystallization that can be reasonably explained by a microscopic C-V model.
Molecular modeling also revealed that citrate has maximum binding energy, −166.5 kJ mol−1, occurring for the [101] step on the (−101) face, while the value for the [021] step on the (010) face is only −56.9 kJ mol−1. This high selectivity leads to preferential binding to steps on the (−101) face that pins step motion [76]. However, for the aspartic acid-rich peptides (DDD in the 27-mer peptide sequence with serine (S) or glycine spacers (G)) [84], there is no obvious selective step binding. All straight steps on the (010) and (−101) faces are pinned due to adsorbed peptides and step velocities are further reduced by DDDS rather than DDDG [85]. CC nucleation experiments showed the marked differences in inhibitory effects of DDDS and DDDG on COM growth by the measurements of induction times for nucleation (Figure 8). According to previous discussions (see Section 2.1.3), equation (17) shows that the increase of the interfacial tension γSL, following the introduction of peptide subsegments, results in inhibition of COM growth and increase of induction time. Figure 8 shows that the relationship between induction time and surface tension is a function of peptide concentration. Thus the results indicate COM has a higher interfacial energy, γSL, after the adsorption of DDDS than that following the adsorption of DDDG in bulk CC crystallization.
Figure 8.
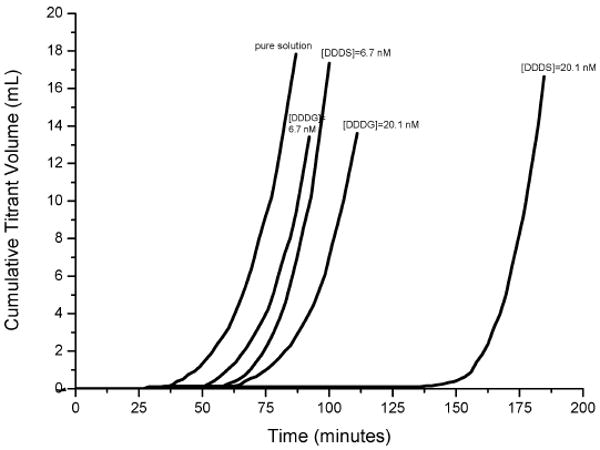
Nucleation of COM at σCOM = 1.53 in pure solution and in the presence of different DDDG or DDDS concentrations showing dose-dependent inhibition by both peptides. Reproduced from [85] by permission of the American Chemical Society, copyright 2006.
The increase of interfacial energy may be directly related to modulation of kink kinetic barriers to dehydration of solvated growth units in the presence of additives. The roles of desolvation barriers to the incorporation of growth units within kink sites may be the rate-limiting step during crystallization [86]. During growth, the solute, solvent and additive molecules that have been absorbed on both the kink sites and the surfaces of the growth units must be desolvated [87]. Because rates of step propagation depend on the uptake of growth units into kink sites at step edges, the kink kinetics energy barrier must be overcome to remove solvent molecules and additive molecules absorbed at kink sites. Therefore, the adsorption of additives at the kink sites will enhance the kink kinetics energy barrier, and, consequently, the integration of growth units into crystal nuclei will be significantly reduced [88].
2.3.2. Step Density and Interfacial Energies
The interaction of citrate with brushite (DCPD) reveals another mechanism by which impurity molecules reduce step density without influencing the step speed and morphology. Figure 9a shows that the velocities of all three steps on brushite (010) faces are not significantly changed in the presence of citrate. Although the measured step velocities are not perfectly constant, the maximum variation is only about 10%. Nevertheless, in parallel CC experiments, citrate effectively retards the bulk growth rate (Figure 9b) [89]. It is important to question how the microscopic AFM step kinetics can be reconciled with the bulk CC kinetics. One possibility is that citrate may modify the step kinetics of other faces rather than the (010) face, or decrease the step density. Figure 4a shows the average distance between two steps as SLλ0 (spacing) and their heights as dhkl in a spiral growth. The growth rate of one face is given by, Rhkl = νstepdhkl/SLλ0 thus showing that a lower density (larger spacing between parallel steps) has a lower face growth rate.
Figure 9.
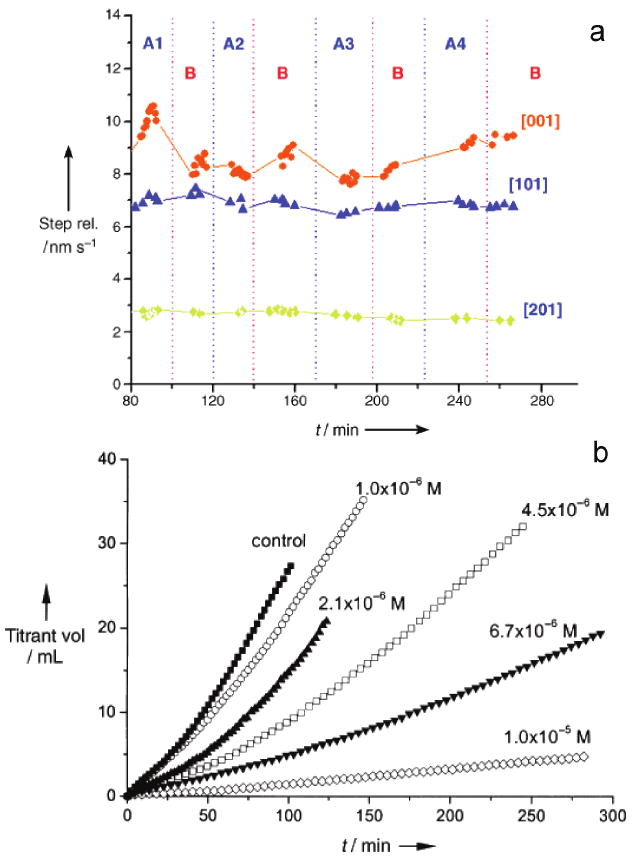
(a) Evolution of the velocities of all three steps for brushite crystal grown in solutions with and without citrate. All experimental conditions were kept constant, and there was no change in the spreading rates of steps in the absence and presence of citrate. The vertical red dotted lines indicate the time at which the crystals were exposed to a pure growth solution supersaturated with calcium phosphate (marked as B areas), while the blue dotted lines indicate the times at which the growth solutions contained citrate. In areas A1, A2, A3, and A4, the citrate concentrations were 1.0 × 10⁻⁶, 5.0 × 10⁻⁶, 1.0 × 10⁻⁵, and 2.0 × 10⁻⁵ M, respectively. (b) CC growth curves of brushite in the presence of citrate. The relative supersaturation with respect to brushite (σ) was 0.250; the pH value and ionic strength were 5.60 and 0.15 M, respectively; the curves have been normalized to the same seed mass of 10.0 mg. Reproduced by permission from [89].
Figure 10 shows that citrate dramatically decreases the step densities, especially those of [101] and [001] steps, and this accounts for the observed inhibition in the bulk CC growth experiments. The birth of a new spiral segment is shown in Figure 11. If this new step segment remains at equilibrium with the adjacent reservoir of growth units, then it will only advance with the change in free energy, Δg. The total change in free energy of the system is given by equation (24):
Figure 10.
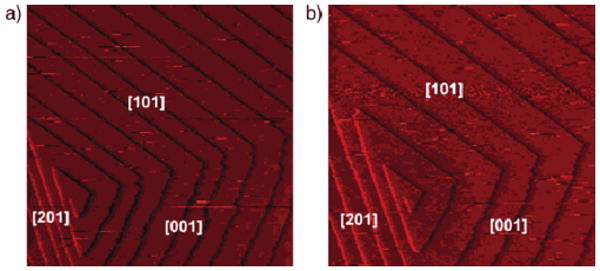
AFM images of a brushite (010) face: (a) in the absence and (b) in the presence of citrate. Introduction of citrate molecules reduces the brushite growth rate by changing the terrace spacing between the growth steps rather than the morphology or velocity of the steps, which results in a marked decrease of the step density on the growing surface. Reproduced by permission from [89].
Figure 11.
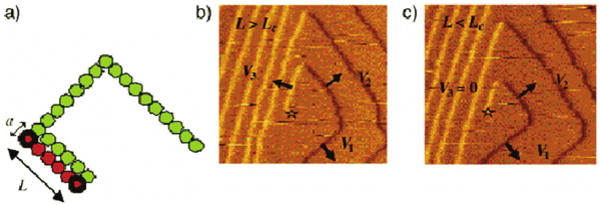
(a) Enlargement of a dislocation source; the green represents the original step while the orange represents the new growth. The images in (b) and (c) show that the critical length is the minimum length at which the step will begin growing outward and the following step will begin growing. Adding biological additives such as citrate, that changes the energetics of the crystal formation, can in turn alter the shape of the crystal. The dislocation source on brushite surface is marked with a star. Reproduced by permission from [89].
| (24) |
Here, n = L/b, L is the length of the step, b is the intermolecular distance along the step, a is the distance between rows, and Δμ is the change in chemical potential per growth unit during this phase transformation. The second term gives the free energy of the step edge γ. Setting Δg to zero and substituting kTσ for Δμ shows that the free energy only decreases if the length of the step exceeds a critical value, Lc, given by:
| (25) |
AFM images can show the birth of new step segments on brushite. The smallest step is below the critical length and is stationary (Figure 11c), but when it has exceeded the critical length it begins to move (Figure 11b). Step density is a function of the time that it takes for a new step to begin to move. This can be related to the critical length or to the probability of nucleating a kink, depending on whether thermodynamics or kinetics is in control [90]. If the steps are at equilibrium, the increase in step density implies an increase in the critical length and a concomitant increase in step free energy according to equation (25). Figure 11 suggests that citrate increases Lc, and in turn increases the period of time that it takes for a dislocation to create new step edges. The interfacial tensions of brushite with increasing citrate concentration measured by a thin-layer wicking method further confirmed this relationship [89].
This study suggests that the presence of additive molecules may modify the growth rate by changing the step density and/or the interfacial energies; and this finding will broaden our understanding of the mechanisms of biomineralization.
3. Dissolution
By analogy to growth, the dislocation-based Burton, Cabrera, and Frank (BCF) model and the 2D-nucleation model predict rates that vary with the free energy change (ΔG) of the dissolution reaction. The screw-dislocation-based BCF mechanism of crystal growth drives the crystal growth by the steps of spirals emanating from dislocations. This kinetic rate law, in fact, approaches quadratic behavior for small ΔG values near equilibrium conditions [91]:
| (26) |
The 2D-nucleation mechanism, predicts a non-linear rate decrease as equilibrium conditions are approached [91]. From calculations of the free energy of formation of a critical 2D nucleus for growth or a critical 2D pit for dissolution, the growth or dissolution rate of a nearly perfect crystal surface lacking obvious defects should obey the rate law given by equation (27) [91]:
| (27) |
Dove et al., using nucleation theory, predicted quartz dissolution processes that change with undersaturation from step retreat, to defect-driven and homogeneous etch pit formation. This result is consistent with recent observations of demineralization in biological minerals. However, improvement of nucleation models may be the missing link in attempts to unify mineral growth and dissolution into a mechanistic and quantitative framework across the continuum of driving force [92].
In many crystal dissolution studies, the conditions used were often far from equilibrium. The most often invoked relation has been based on the principle of detailed balancing or transition state theory leading to the rate law shown as equation (28) [93,94]
| (28) |
where Ac and α are general constants, dependent on pH, temperature T, or inhibitor molecules. ΔG (< 0) is the Gibbs free energy of dissolution. However, the complexities involving wide ranges of defects and active surface-chemistry of mineral structures are expected in the dissolution of rocks and biominerals [95,96].
Many inconsistencies in dissolution studies cannot be explained by the largely empirical kinetic “laws.” Therefore, it is important to analyze the possible kinetic surface characteristics and then understand the deviations from equation (28) under actual dissolution reaction conditions.
3.1. Dissolution Models
Unlike BCF or 2D nucleation mechanisms, equation (28) does not contain surface molecular complexes such as etch pits as rate-determining factors in crystal dissolution. Lasaga and Lüttge have used the following modified rate law (equation (29)) for the formation of etch pits responsible for the observed dissolution rates [97,98],
| (29) |
Here, C is the combination of several constants, χs is the mean surface diffusion distance, and rpit is the location of the step velocity minimum. The key function, f(rpit), is given by equation (30) [97,98]:
| (30) |
where γ is the surface free energy, u(r) is the strain energy at radius r, and ω is the molar volume. Equation (29) predicts the overall dissolution rate for minerals based on the expansion of etch pit induced stepwaves. The related strain energy is the driving force for subsequent etch pit formation. The dislocation strain energy for most crystals can be obtained from [95,97,98]:
| (31) |
where u is the isotropic bulk shear modulus or the strain energy to open a pit (in J/cm2), bBV the magnitude of the Burgers vector (Å), rh(Å) sets the upper bound on the strain energy, and r is the distance from the dislocation center (Å). When the undersaturation exceeds some critical value (ΔGcrit), the strain field of a dislocation will open up the hollow core to form an etch pit [99]. This concept was also developed by Lasaga and Blum [100] in their treatment of mineral dissolution.
Recently, AFM studies on the dissolution of sparingly soluble calcium phosphates have revealed that pit formation and growth are the principal elements of the dissolution process, and that the microscopic critical size effects should be embodied in any macroscopic dissolution model under similar experimental conditions [101]. The self-inhibiting effects observed in bulk dissolution using a CC method show that particle size must be taken into account in studies of demineralization where kinetics is greatly influenced by crystallite sizes [96].
These results can be explained in terms of a dissolution model incorporating particle size considerations which has been confirmed by CC and in situ AFM experiments. Demineralization of sparingly soluble salts such as apatite is generally initiated and accompanied by the formation and development of pits on the crystal surfaces, and the dissolution rates are also determined by the pit densities and spreading velocities. Analogous to the formation of two-dimensional nuclei/hillocks for crystal growth, in dissolution, the rate of step movement from a pit of radius r can be obtained based on the analysis above [96]:
| (32) |
| (33) |
where r*, the critical radius for the formation of a two-dimensional pit/dissolution step. R∞ is the velocity of dissolution steps at r → ∞. According to classical nucleation theory discussed in Section 2.1.2, the free energy, ΔG, for the nucleation of a pit is [97,98]:
| (34) |
where r is the radius and h is the depth of a pit, γ is the surface free energy, and Ω is the molecular volume. Δg, the Gibb's free energy change, is given by:
| (35) |
where υ is the number of ions in a formula unit, IAP is the actual activity product and Ksp the solubility product. When S < 1, the solutions are undersaturated, the first term on the right side of equation (34) is negative, reflecting the decrease of chemical potential, but the second term is positive due to the increase of surface roughness (pit formation) with losses of crystal mass and the expansion of the solid-liquid interfacial area [98]. Thus, the dependence of the Gibbs free energy on the radius (r) passes through a maximum, and the critical size (i.e., r*) can be obtained by setting ∂(ΔG)/∂(r) = 0, thus [96,98]:
| (36) |
In equation (33), R∞ is the velocity of dissolution steps at r → ∞. It has been shown that only pits which are larger than r* provide the active dissolution sites that contribute to dissolution. When r is closer to r*, there is no fast movement of its stepwave and the dissolution rate approaches zero.
Figures 12a and 12b illustrate the dissolution of a (010) brushite face close to equilibrium; the pit steps lose their orientations and become isotropic. However, their dissolution still proceeds by the initiation and growth of pits [101,102]. Only the spreading of large pit steps (> 0.2–0.4 μm) contributes to dissolution. Although small pits are present (< 0.2–0.4 μm), three types are recognizable, shown as 1–3 in Figure 12. The smaller pits, 1 and 2, in comparison with the larger pit, make only extremely small contributions to dissolution. Some, such as pit 3, even disappear from the surface during dissolution. In terms of the dissolution model (equation 32), the small size, 0.2–0.4 μm, can be regarded as having the critical dimension for pits and steps under these dissolution conditions. Figure 12c shows the relationship between the expanding velocities and sizes of (201) and (001) steps on dissolving (010) brushite faces, as revealed by AFM. At the lower relative undersaturation, 0.060, with the experimental critical pit sizes of about 0.2 and 0.3 μm, the step displacement velocities are extremely slow but with increase in size, R(r) increases and tends to reach a relatively constant value. Since r* is a function of undersaturation (equation (36)), these critical values, at σ = 0.172, for (201) and (101) steps are reduced to about 0.06 and 0.08 μm, respectively. In comparison with the value for σ = 0.060, their rates increase much more rapidly and achieve a high, relatively constant, value with increasing size, r. The solid and dashed lines in Figure 12c show the good agreement between the value calculated using equation (32) and the AFM experimental results, which implies that, on a microscopic physical level, the dissolution rate is a function of the step size and its critical value [101,102].
Figure 12.
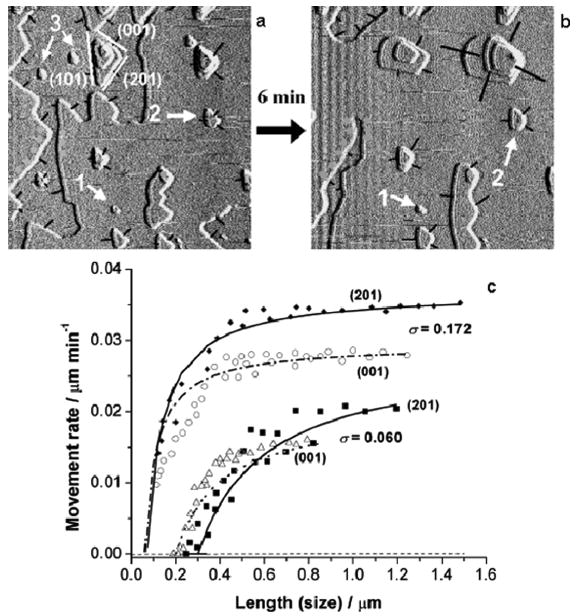
(a, b) AFM movie frames of brushite dissolution on (010) surfaces near the equilibrium condition of σ = 0.060. The significant developments are only observed for the large pit steps. The smaller ones are almost stationary (pit 1) in comparison with the large pits, and they make extremely small contributions to reaction (pit 2). Some of the small pits even disappear from the surface (pit 3) during dissolution. The black lines indicate the displacement directions. The scale of the images is 5 μm. (c) Step displacement rates as a function of size for (201) and (001) steps at undersaturation values of σ = 0.060 and 0.172, respectively. The lines are plotted according to equation (32). A direct relationship between the dissolution rate and the length of dissolution step is shown at the micron level. (The relative undersaturation is defined by σ = 1 − S to make it positive in dissolution experiments, pH = 4.50, I = 0.15 mol L−1, 37 °C). Reproduced by permission from [102].
Under bulk CC experimental conditions, dissolution rates decreased markedly with time, eventually tending to zero [96]. It should be noted that for brushite dissolution the CC method was capable of quantifying flux rates as low as 10−9−10−8 mol m−2 min−1. When the rates decreased below this limit, the process was regarded as being essentially suppressed. Typically, the dissolution rates of brushite were reduced to effective suppression in a few hours. At that time, crystallites remained in the undersaturated solutions and the percentage of the dissolved crystals before reaching that stage increased with increasing undersaturation, the values being about 64, 68, 73, and 79% at σ values of 0.06, 0.17, 0.35, and 0.49, respectively [96]. This unexpected dissolution suppression was also observed with the other sparingly soluble calcium phosphates such as β-TCP (tricalcium phosphate) [103], OCP [96], HAP [104], and carbonated apatites [105]. The unusual CC dissolution results of various calcium phosphates are consistent with the microscopic AFM step/pit-based model. When the particle size of dissolving crystals is sufficiently reduced, demineralization is thought to be dynamically stabilized due to the absence of active pits/defects on the very small crystallite surfaces [96]. The rate-limiting step for crystallization/dissolution is actually found to be the removal of surface defects [106].
Although many near-atomic-scale AFM observations of dissolution including our studies have been made [107–109], there is no complete physical picture that explains widely observed variations in dissolution behavior. A recent result of EDTA-mediated calcite dissolution demonstrates that, after penetration through a critical pit depth barrier, step velocity increases linearly with pit depth. EDTA and water initiate and propagate dissolution steps with pit-depth-dependent and -independent step velocities, respectively. The linear defects are susceptible to continuously increasing step velocities, but the point defects are not. The study highlights the need for further refinement of microscale mechanisms of mineral dissolution [110].
3.2. Enamel Demineralization
Human enamel is an inhomogeneous tissue with the approximate 10% reduction in mineral concentration from the surface to the enamel–dentin junction (EDJ) [111]. This anisotropy and inhomogeneity of enamel suggest that the rate of demineralization would depend on the direction and position of the acid attack within a developing lesion [112]. According to this suggestion, two different enamel surfaces were targeted for CC dissolution studies. Upon introduction into the undersaturated solutions, disturbed outer layers at the enamel surfaces resulting from polishing procedures were removed on faces both parallel (Figure 13a, b) and perpendicular (Figure 13c, d) to the rod c-axis of the polished surface of dental enamel. AFM images showed that dissolution occurred at the boundary between undissolved and dissolved sections. After 1 hour of dissolution, the native enamel surface can be clearly seen and the characteristic fish-scale “keyhole” structure at the surface was visible (Figure 13d) [113].
Figure 13.
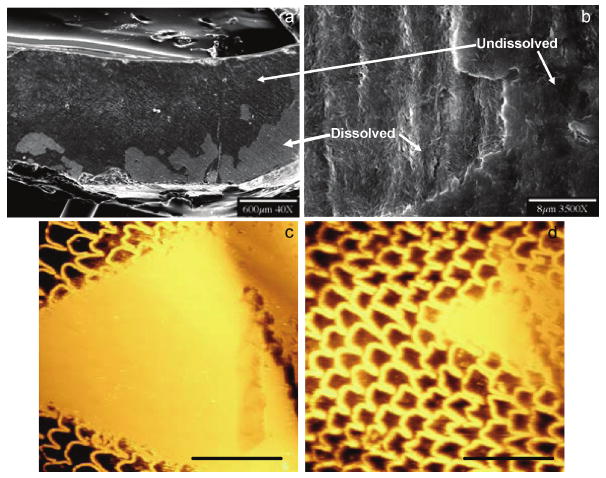
Initial dissolution of enamel surfaces. SEM images at lower (a) and higher magnifications (b) of the polished layer at an enamel surface (parallel to the rod c-axis) after 200 min of dissolution (pH = 4.5, I = 0.15 mol L−1, 37 °C at σ = 0.902). AFM images of the dissolution of a polished layer at an enamel surface (perpendicular to the rod c-axis) initially (c) and after 1h dissolution (d). Scale bars, 30 μm. Reproduced from [113] by permission of the American Chemical Society, copyright 2005.
The dissolution rate perpendicular to the rod c-axis decreased as the reaction proceeded from 5.4 ± 0.5 × 10⁻¹¹ mol mm−2 min−1, at 180 min reaction to 3.5 ± 0.5 × 10⁻¹¹ mol mm−2 min−1, at 3000 min dissolution, and the rate of demineralization parallel to the rod c-axis decreased from 4.2 ± 0.5 × 10⁻¹¹ mol mm−2 min−1, at 200 min reaction to 3.3 ± 0.5 × 10⁻¹¹ mol mm−2 min−1, at 1800 min dissolution [113]. These CC results suggest that the inhomogeneity factor does not influence the linearity of the mineral loss with time when the enamel surface is demineralized following the removal of the polishing layer. The rates of demineralization in directions perpendicular and parallel to the rod c-axis are both approximately constant with time; the former being higher than the latter. Other measurements also showed that the rates of demineralization of enamel perpendicular and parallel to the natural surface were both approximately constant with time after an initial sigmoidal period of dissolution [114,115].
Demineralization, initiated at core (prism or rod)/wall (prism sheath) interfaces, developed anisotropically along the c-axes (Figure 14a, b). Dissolution of walls and cores at an intermediate stage of the dissolution reaction showed apatite nanoparticles 100–200 nm in size on both cores and walls (Figure 14c–e). Further dissolution of the nanoparticles was suppressed in CC experiments; those from cores were released directly into the solution by fluid diffusion flux, resulting in empty cores (Figure 14f). After long reaction times (1 to 2 weeks) nanosized apatite particles collected from the bulk solution by filtration were kinetically protected against further dissolution even though the solutions remained undersaturated (Figure 15a and b). The CC dissolution curves reached plateaux prior to complete dissolution regardless of whether primary and permanent teeth (Figure 15c and d) were involved. This indicated the creation of metastable states in which the reaction was effectively suppressed even though the reaction solutions remained undersaturated. From the CC curves in Figure 15e, the mean dissolution rates of primary and permanent tooth enamel during the initial linear stage of dissolution were 1.5 ± 0.5 × 10⁻¹⁰ mol mm−2 min−1 and 2.6 ± 0.5 × 10⁻¹¹ mol mm−2 min−1, respectively [116].
Figure 14.
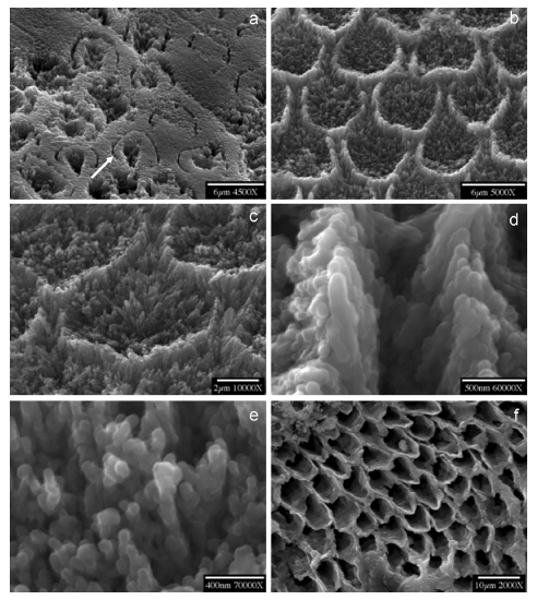
SEMs of enamel dissolution at different stages. Demineralization, initiated at the core/wall interfaces of rods, developed anisotropically along the c-axis shown by an arrow in (a) (dissolution time: a, 1000 min. b, 3300 min.). Dissolution of wall and core (c) shows that the crystallites become smaller and nanoparticles of apatite are formed on both walls (d) and cores (e) (dissolution time: 6000 min), finally resulting in hollow enamel cores after dissolution for 5 days (f). Reproduced from [113] and [116] by permission of the American Chemical Society, copyright 2005 and the International and American Association of Dental Research, copyright 2006, respectively.
Figure 15.
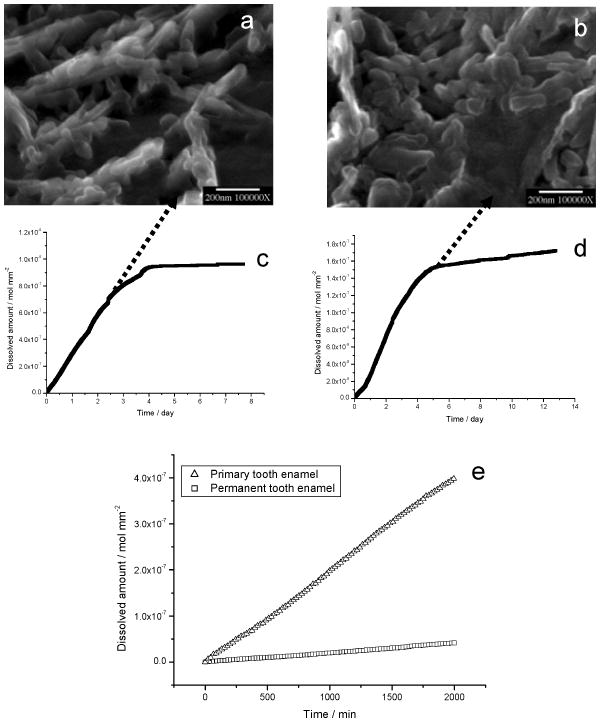
Nanosized crystallites at the plateaux stages of dissolution of (a) primary and (b) permanent enamel collected by filtration from the bulk solution. CC curves of (c) primary and (d) permanent tooth enamel dissolution. The rates decreased virtually to zero at the end of dissolution reactions. (e) Comparison of dissolution rates of primary and permanent tooth enamel during the initial linear stages of dissolution. Reproduced from [116] by permission of the International and American Association of Dental Research, copyright 2006.
It is well known that the dissolution of crystals is highly dependent on the thermodynamic driving forces; all crystals would inexorably dissolve until all the solid phases had disappeared despite a sustained undersaturation. However, it was previously shown that the surface-controlled crystal growth and dissolution is dominated by the movement of steps, and there exist critical conditions for dissolution pit/step formation and the dependence of dissolution rates upon pit/step sizes for sparingly soluble calcium phosphates. The self-inhibiting effects of tooth enamel observed in bulk CC dissolution show that particle size must be taken into account in studies of biodemineralization where the kinetics is greatly influenced by crystallite sizes. According to equation (33), when r is closer to r*, there is no fast movement of its stepwave and the dissolution rate approaches zero, suggesting that the formation of active pits is more difficult since the dimensions of the crystallites (l) fall into the same order as r* (for example, l becomes less than 20 r*). Correspondingly, the macroscopic CC dissolution rate decreases with extent of dissolution. Theoretical predictions are consistent with the CC dissolution results; using an apatite interfacial tension, γSL ≈ 105 mJ m−2 [117], and unit-cell dimensions a = b = 9.432 Å, c = 6.881 Å [118], the estimated value of r* from equation (36) is about 50 nm under these dissolution conditions. Figures 15a and 15b show that these undissolved nanoparticles of collected residues after long-term dissolution have similar size distributions. Nanosized enamel crystallites will be expected to show a remarkable degree of self-preservation in the fluctuating physiological milieu and, in association with organic components, may contribute to the physical characteristics of dental enamels [119].
3.3. Bone Demineralization
Bone has a complex hierarchical structure from macroscopic to microscopic length scales [120,121]. The crystals in bone are plate-shaped with thicknesses of 2–4 nm and have highly variable length and width dimensions. Most are arranged in layers within a collagen matrix [16]. Each crystal layer is separated by 4 layers of collagen triple helical molecules. This nanoscale structure forms the basic composite material of bone and most probably is responsible for much of its materials properties [122].
In addition to mineral platelets, spherical to cylindrical shaped nanoparticles in bone have recently been found to be an integral part of the layered structure of bone [123]. By observing the fracture/non-fracture surfaces of anorganic baboon bone, spherical to cylindrically shaped particles, approximately 20 nm in diameter, are present. These particles were also observed on uncoated anorganic bone specimens thereby excluding the possibility that they were coating artifacts and collagenous matrix (Figure 16a). In the high-resolution back-scattered electron image the spherical particles have a contrast similar to the crystal platelets. They are thus likely to have similar mineral properties.
Figure 16.
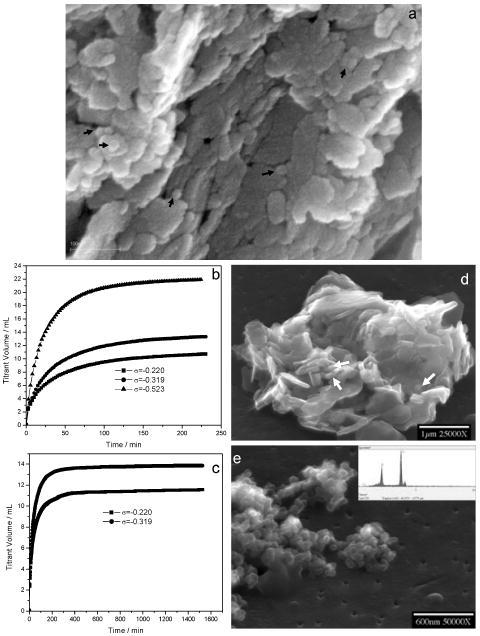
Characteristics of baboon bone before and after dissolution. (a) High resolution SEM of spherical to cylindrically shaped nanosized particles indicated by arrows on fractured surfaces of uncoated baboon bone sample prior to dissolution. Typical CC titrant-time curves after relatively short dissolution periods (b), reached plateaux over an extended experimental period prior to complete dissolution at different undersaturations (c). (d) SEM image of partially demineralized baboon bone at σ = −0.220 after a shorter dissolution period (less than 1 h). Nanosized particles about 20–100 nm (shown by arrows) and the typical plate-like crystals can be seen. (e) SEM of nanosized particles collected from the bulk solution at σ = −0.319 by filtration at the end of a long-term dissolution experiment; EDS of nanoparticles, showing residual crystallites were apatitic phases similar to those prior to demineralization (inset in (e)). Reproduced by permission from [123].
The demineralization of anorganic baboon osteonal bone has been investigated at relative undersaturations σHAP ranging from −0.220 to −0.523 at pH 5.50. Typical titrant-time curves using a nanomolar-sensitive CC technique, shown in Figure 16b, reached plateaux over an extended experimental period prior to complete dissolution (Figure 16c). This indicates the formation of metastable states in which the reaction was effectively suppressed even though the reaction solutions remained undersaturated. Some of the nanosized particles (20–100 nm) can be seen after relatively short dissolution periods (< 1h) (Figure 16d). These particles were released directly into the solution by fluid diffusion flux and were stabilized against further dissolution in the bulk undersaturated solution (> 1d) (Figure 16e). There are two possible sources for these nanoparticles: (1) They may be present in the initial bone structure and are not products of dissolution, or, (2) they are formed as a result of the dissolution of the platelet crystals. It is also conceivable that both sources exist.
Hassenkam et al. used AFM to image the exterior surface of intact and fractured trabecular bone and found small 20–30 nm nodular structures between collagen fibrils and a dense array of mineral plates [124]. However, even the plate-shaped crystals tended to have a rounded appearance because of the operational mode of the AFM. We are therefore limited to the high-resolution back-scattered electron (BSE) imaging technique that, at this point, provides the most detailed information on the mineral properties of these nanoparticles. Similar reproducible self-inhibited dissolution was observed with these nanoparticles during CC dissolution of synthetic carbonated apatite. This result rules out the possible influence of complicating biological factors such as the presence of organic matrix components and other impurities. Residues of these nanoparticles at the end of dissolution reactions or preexisting nanoparticles that are stabilized due to the lack of surface defects/pits are able to resist dissolution. This phenomenon of dissolution termination can also be explained by a dissolution model previously discussed, and these very small particles are not arbitrary; rather, these self-tuned and dissolution-insensitive effects for tiny crystallites occur specifically at the nanoscale.
We do not know whether the nanosized particles present in bone are the same as those that are insensitive to dissolution. It is, however, conceivable that the existence of both phenomena can be attributed to the same basic mechanism of formation, namely that a certain proportion of particles of nanoscale dimensions have defect free surfaces and are thus stabilized during formation or dissolution of bone. Their presence in bone and their formation during dissolution may, however, have important implications to the dual functions of bone, namely during load bearing and as a reservoir for mineral ions needed for metabolism.
4. Conclusion and Future Directions
4.1. Bottom-up Dynamics: Nucleation and Growth from Supersaturated Solutions
Biological control, either by localizing crystallization or by stabilizing the otherwise short-lived amorphous forms has been attributed to proteins and their cooperative combinations, peptides and inorganic ions, on the assumption that each exhibits roughly the same influence in inhibiting the nucleation and growth of crystallites. Intimate interaction between initial mineral nuclei and an organic matrix in the presence of soluble proteins and other impurities in a supersaturated solution controls the pathway of crystallization. However, some basic questions remain: (1) How do biomolecules or impurities alter the energy pathway during crystallization? (2) Do organisms change the concentrations and the composition of secreted biomacromolecules during different developing stages to inhibit or promote crystallization? (3) How do highly fluid matrix molecules control the sites of nucleation, the evolution of phases, and the final morphology of biominerals? (4) Are they catalysts, substrates or both? Heterogeneous crystallization (biomineralization) may follow completely different mechanisms across the continuum of driving forces. Therefore, it is necessary to carefully select the driving forces (supersaturations) for in vitro biomimetic mineralization studies.
In the light of the foregoing material, it is appropriate to ask: (1) By what sequence of events does a biomineral form at the earliest developing stages? (2) Are individual atoms or molecules added as crystals grow on organic template surfaces? Some interesting evidence has already suggested that inorganic nanocrystals (1–10 nm), made up of hundreds or even thousands of atoms, can form fundamental building blocks for highly ordered and complex natural minerals through nanocrystal aggregation [125]. It has also been suggested that mesoscale assembly and cooperative interactions between the forming nanocrystals and assembling proteins is pivotal to biomineralization processes [126–129,57].
A certain density of defects is inevitable even at equilibrium. However, when this same number of atoms is partitioned into nanometer-sized crystals, then, on average, each nanocrystal need not contain any interior defects [130]. Nanoparticles without active pits/defects on their surfaces are thus stabilized to resist further dissolution. Moreover, by way of oriented aggregation, the surface energy is reduced substantially because the interface is eliminated [131,132]. During this process, in addition to lowering the nucleation barrier, organic templates will reduce random Brownian motion-driven nanoparticle collisions and may allow adjacent particles to rotate to find the low-energy configuration [133]. The incorporation of other smaller impurity species may also be facilitated under conditions where crystals grow by nanocrystal attachment [130]. Furthermore, phase stability can be particle size-dependent because phase transformation and recrystallization are promoted by particle aggregation if the initial particles are metastable [134–136].
4.2. Top-down Dynamics: Dissolution
It has been found that demineralization reactions such as those involving tooth enamel and bone may be inhibited or even suppressed when the crystallite sizes fall into the critical nanoscale range. This phenomenon actually involves particle-size-dependent critical conditions of energetic control at the molecular level. Clearly, this dissolution termination is a kinetic phenomenon and cannot be attributed to reaction retardation as a result of surface modification by additives.
This size is not arbitrary; rather, it seems to give biominerals such as bone and tooth remarkable characteristics [119,122,123]. As the mineral size falls below a critical length scale (around 20–50 nm), the strength of a perfect mineral crystal is maintained and the biomaterials become insensitive to dissolution. Nanostructure optimization in a complex biocomposite will be expected to show a remarkable degree of self-preservation in the fluctuating physiological milieu, and, in association with organic matrix, may be related to the growth conditions in which some particles remain stable at a critical size, whereas most particles continue to grow into mature products.
Acknowledgments
This work was supported by a research grant from the National Institute of Dental and Craniofacial Research of the NIH (DE03223-35).
Abbreviations and Definitions
- AFM
atomic force microscopy
- BCF
Burton–Cabrera–Frank model
- BSE
back scattered electron
- CC
constant composition
- CNT
classical nucleation theory
- COM
calcium oxalate monohydrate
- C-V
Cabrera–Vermilyea model
- 2D
two-dimensional
- DCPD
brushite
- EDJ
enamel–dentin junction
- EDS
energy dispersive spectroscopy
- EDTA
ethylenediamine-N, N, N′, N′-tetraacetate
- FAP
fluorapatite
- f.c.c
face-centered cubic
- G–T
Gibbs-Thomson effect
- HAP
hydroxyapatite
- h.c.p
hexagonal close-packed
- IOL
intraocular lens
- OCP
octacalcium phosphate
- OPN
osteopontin
- r.h.c.p
random-hexagonal close-packed
- SEM
scanning electron microscopy
- TCP
tricalcium phosphate
- TEM
transmission electron microscopy
List of Symbols
- A
temperature-dependent Debye-Hückel constant
- Ac
constant in the BCF model
- ai
ionic activity of species i
- ae
equilibrium solute activity
- b
intermolecular distance along a step
- bBV
the magnitude of the Burgers vector
- β
kinetic coefficient
- c
concentration of bulk solution
- ci
ionic concentration of species i
- Ci
bulk solution concentration of additive molecule
- dhkl
step height
- D
combined coefficient reflecting geometric factors, sticking probability, and impurity lifetime
- f(m, x)
interfacial correlation factor
- Δg
total step growth free energy
- ΔG
overall Gibbs free energy of growth or dissolution
- γ
interfacial energy
- γSL
interfacial energy between solid and liquid
- h
the depth of a pit
- I
ionic strength
- IAP
ionic activity product of a sparingly soluble salt
- J
nucleation rate
- k
Boltzmann's constant
- κ
a kinetic preexponential
- Ksp
thermodynamic solubility product
- Lc
critical length of a step
- N0
density of foreign particles or substrates
- ρs
the number-density of a solid
- ρstep
step density
- λ0
average distance between two steps
- Ω
molecular volume
- rc
critical size of a nucleus
- r*
the critical radius for the formation of a two-dimensional pit
- R
rate of crystal growth or dissolution
- Rs
average radius of spherical shaped foreign particles
- R0
rate of reaction in the absence of additive molecule
- Ri
rate of reaction in the presence of additive molecule
- S
supersaturation ratio
- σ
relative supersaturation
- ts
induction period
- T
absolute temperature
standard state (ai = 1) of the chemical potential of species i
- μi
chemical potential of species of i
- Δμ
change in chemical potential
- ν
number of ions in a formula unit
- νi
step speed
- V
system volume
- χs
mean surface diffusion distance
- y±
mean activity coefficient
- zi
ion charge
References
- 1.Lichtenegger HC, Schöberl T, Bartl MH, Waite H, Stucky GD. Science. 2002;298:389–392. doi: 10.1126/science.1075433. [DOI] [PubMed] [Google Scholar]
- 2.Hamm CE, Merkel R, Springer O, Jurkojc P, Maier C, Prechtel K, Smetacek V. Nature. 2003;421:841–843. doi: 10.1038/nature01416. [DOI] [PubMed] [Google Scholar]
- 3.Sundar VC, Yablon AD, Grazul JL, Ilan M, Aizenberg J. Nature. 2003;424:899–900. doi: 10.1038/424899a. [DOI] [PubMed] [Google Scholar]
- 4.Wang LJ, Nie Q, Li M, Zhang F, Zhuang J, Yang W, Li T, Wang Y. Appl Phys Lett. 2005;87:1–3. 194105. [Google Scholar]
- 5.Milligan AJ, Morel FMM. Science. 2002;297:1848–1850. doi: 10.1126/science.1074958. [DOI] [PubMed] [Google Scholar]
- 6.Hoang Q, Sicheri F, Howard AJ, Yang DSC. Nature. 2002;425:977–980. doi: 10.1038/nature02079. [DOI] [PubMed] [Google Scholar]
- 7.Paine ML, Snead ML. J Bone Mineral Res. 1996;12:221–226. doi: 10.1359/jbmr.1997.12.2.221. [DOI] [PubMed] [Google Scholar]
- 8.Falini G, Albeck S, Weiner S, Addadi L. Science. 1996;271:67–69. [Google Scholar]
- 9.Kröger N, Lorenz S, Brunner E, Sumper M. Science. 2002;298:584–586. doi: 10.1126/science.1076221. [DOI] [PubMed] [Google Scholar]
- 10.Scheffel A, Gruska M, Faivre D, Linaroudis A, Plitzko JM, Schüler D. Nature. 2006;440:110–114. doi: 10.1038/nature04382. [DOI] [PubMed] [Google Scholar]
- 11.Du C, Falini G, Fermani S, Abbott C, Moradian-Oldak J. Science. 2005;307:1450–1454. doi: 10.1126/science.1105675. [DOI] [PubMed] [Google Scholar]
- 12.Lévêque I, Cusack M, Davis SA, Mann S. Angew Chem Int Ed. 2004;43:885–888. doi: 10.1002/anie.200353115. [DOI] [PubMed] [Google Scholar]
- 13.Cha JN, Stucky GD, Morse DE, Deming TJ. Nature. 2000;403:289–292. doi: 10.1038/35002038. [DOI] [PubMed] [Google Scholar]
- 14.Hartgerink JD, Beniash E, Stupp SI. Science. 2001;294:1684–1688. doi: 10.1126/science.1063187. [DOI] [PubMed] [Google Scholar]
- 15.De Yoreo JJ, Vekilov PG. In: Biomineralization, Vol 54 of Reviews in Mineralogy and Geochemistry. Dove PM, De Yoreo JJ, Weiner S, editors. The Mineralogical Society of America; Washington, DC: 2003. pp. 57–94. [Google Scholar]
- 16.Landis WJ, Hodgens KJ. J Struct Biol. 1996;117:24–35. doi: 10.1006/jsbi.1996.0066. [DOI] [PubMed] [Google Scholar]
- 17.Roschger P, Grabner BM, Rinnerthaler S, Tesch W, Kneissel M, Berzlanovich A, Klaushofer K, Fratzl P. J Struct Biol. 2001;136:126–136. doi: 10.1006/jsbi.2001.4427. [DOI] [PubMed] [Google Scholar]
- 18.Mann S, Archibald DD, Didymus JM, Douglas T, Heywood BR, Meldrum FC, Reeves NJ. Science. 1993;261:1286–1292. doi: 10.1126/science.261.5126.1286. [DOI] [PubMed] [Google Scholar]
- 19.Qiu SR, Wierzbicki A, Orme CA, Cody AM, Hoyer JR, Nancollas GH, Zepeda S, De Yoreo JJ. Proc Natl Acad Sci USA. 2004;101:1811–1815. doi: 10.1073/pnas.0307900100. [DOI] [PMC free article] [PubMed] [Google Scholar]
- 20.Orme CA, Noy A, Wierzbicki A, McBride MY, Grantham M, Dove PM, De Yoreo JJ. Nature. 2001;411:775–779. doi: 10.1038/35081034. [DOI] [PubMed] [Google Scholar]
- 21.Davis KJ, Dove PM, De Yoreo JJ. Science. 2000;290:1134–1137. doi: 10.1126/science.290.5494.1134. [DOI] [PubMed] [Google Scholar]
- 22.Touryan LA, Lochhead MJ, Marquardt BJ, Vogel V. Nature Mater. 2004;3:239–243. doi: 10.1038/nmat1096. [DOI] [PubMed] [Google Scholar]
- 23.De Yoreo JJ, Dove PM. Science. 2004;306:1301–1302. doi: 10.1126/science.1100889. [DOI] [PubMed] [Google Scholar]
- 24.Mann S. Biomineralization: Principles and Concepts in Bioinorganic Materials Chemistry. Oxford University Press; New York: 2001. [Google Scholar]
- 25.Subburaman K, Pernodet N, Kwak SY, DiMasi D, Ge S, Zaitsev V, Ba X, Yang NL, Rafailovich M. Proc Natl Acad Sci USA. 2006;103:14672–14677. doi: 10.1073/pnas.0602952103. [DOI] [PMC free article] [PubMed] [Google Scholar]
- 26.Liu XY. In: From Solid-Fluid Interface to Nanostructure Engineering. Liu XY, De Yoreo JJ II, editors. Plenum/Kluwer; New York: 2004. [Google Scholar]
- 27.Sunagawa I. In: Advances in Crystal Growth. Furukawa Y, Nakajima K, Sato K, editors. Elsevier Science; Amsterdam: 2001. pp. 1–20. [Google Scholar]
- 28.Kashchiev D. Nucleation: Basic Theory with Applications. Butterworth-Heinemann; Oxford: 2000. [Google Scholar]
- 29.Chernov AA. Modern Crystallography III—Crystal Growth. Springer; Berlin: 1984. pp. 1–158. [Google Scholar]
- 30.Laaksonen A, Talanquer V, Oxtoby DW. Annu Rev Phys Chem. 1995;46:489–524. doi: 10.1146/annurev.pc.46.100195.002421. [DOI] [PubMed] [Google Scholar]
- 31.Trau M, Saville DA, Aksay IA. Science. 1996;272:706–709. doi: 10.1126/science.272.5262.706. [DOI] [PubMed] [Google Scholar]
- 32.Larsen AE, Grier DG. Nature. 1997;385:230–233. [Google Scholar]
- 33.Yethiraj A, van Blaaderen A. Nature. 2003;421:513–517. doi: 10.1038/nature01328. [DOI] [PubMed] [Google Scholar]
- 34.Gasser U, Weeks ER, Schofield A, Pusey PN, Weitz DA. Science. 2001;292:258–262. doi: 10.1126/science.1058457. [DOI] [PubMed] [Google Scholar]
- 35.Zhang KQ, Liu XY. Nature. 2004;429:739–743. doi: 10.1038/nature02630. [DOI] [PubMed] [Google Scholar]
- 36.Auer S, Frenkel D. Nature. 2001;409:1020–1023. doi: 10.1038/35059035. [DOI] [PubMed] [Google Scholar]
- 37.Auer S, Frenkel D. Nature. 2001;413:711–713. doi: 10.1038/35099513. [DOI] [PubMed] [Google Scholar]
- 38.Cacciuto A, Auer S, Frenkel D. Nature. 2004;428:404–406. doi: 10.1038/nature02397. [DOI] [PubMed] [Google Scholar]
- 39.Sear RP. J Phys Chem B. 2006;110:4985–4989. doi: 10.1021/jp056377e. [DOI] [PubMed] [Google Scholar]
- 40.Ostwald WF. Z Phys Chem. 1897;22:289–302. [Google Scholar]
- 41.Gibbs JW. Collected Works, Vol 1 of Thermodynamics. Longmans and Green; New York: 1928. [Google Scholar]
- 42.Davies CW. Ion Association. Butterworth; London: 1962. [Google Scholar]
- 43.Mullin JW. Crystallization. 4th. Butterworth-Heinemann; Oxford: 2001. p. 130. [Google Scholar]
- 44.Kelton KF. In: Solid State Physics. Ehrenreich H, Turnbull D, editors. Vol. 45. Academic; New York: 1991. pp. 75–178. [Google Scholar]
- 45.Nancollas GH. Biological Mineralization and Demineralization. Springer-Verlag; New York: 1982. [Google Scholar]
- 46.Weiner S, Sagi I, Addadi L. Science. 2005;309:1027–1028. doi: 10.1126/science.1114920. [DOI] [PubMed] [Google Scholar]
- 47.Towe KM, Lowenstam HA. J Ultrastruct Res. 1967;17:1–13. doi: 10.1016/s0022-5320(67)80015-7. [DOI] [PubMed] [Google Scholar]
- 48.Lowenstam HA, Weiner S. Science. 1985;227:51–53. doi: 10.1126/science.227.4682.51. [DOI] [PubMed] [Google Scholar]
- 49.Anderson VJ, Lekkerkerker HNW. Nature. 2002;416:811–815. doi: 10.1038/416811a. [DOI] [PubMed] [Google Scholar]
- 50.Yau ST, Vekilov PG. Nature. 2000;406:494–497. doi: 10.1038/35020035. [DOI] [PubMed] [Google Scholar]
- 51.Oxtoby DW. Nature. 2000;406:464–465. doi: 10.1038/35020163. [DOI] [PubMed] [Google Scholar]
- 52.Liu XY. Langmuir. 2000;16:7337–7345. [Google Scholar]
- 53.Liu XY, Lim SW. J Am Chem Soc. 2003;125:888–895. doi: 10.1021/ja020355d. [DOI] [PubMed] [Google Scholar]
- 54.Liu XY. In: Advances in Crystal Growth Research. Furukawa Y, Nakajima K, Sato K, editors. Elsevier; Amsterdam: 2001. pp. 42–61. [Google Scholar]
- 55.Jiang H, Liu XY. J Biol Chem. 2004;279:41286–41293. doi: 10.1074/jbc.M314027200. [DOI] [PubMed] [Google Scholar]
- 56.Jiang H, Liu XY. J Biol Chem. 2005;280:42061–42066. doi: 10.1074/jbc.M412280200. [DOI] [PubMed] [Google Scholar]
- 57.Wang LJ, Guan X, Du C, Moradian-Oldak J, Nancollas GH. J Phys Chem C. 2007;111:6398–6404. doi: 10.1021/jp0675429. [DOI] [PMC free article] [PubMed] [Google Scholar]
- 58.Tomson MB, Nancollas GH. Science. 1978;200:1059–1060. doi: 10.1126/science.200.4345.1059. [DOI] [PubMed] [Google Scholar]
- 59.Liu XY. J Chem Phys. 2000;112:9949–9955. [Google Scholar]
- 60.Davey RJ. Nature. 2004;428:374–375. doi: 10.1038/428374a. [DOI] [PubMed] [Google Scholar]
- 61.Guan X, Tang R, Nancollas GH. J Biomed Mater Res A. 2004;71A:488–496. doi: 10.1002/jbm.a.30176. [DOI] [PubMed] [Google Scholar]
- 62.Wu W, Guan X, Tang RK, Hook D, Yan W, Grobe G, Nancollas GH. Langmuir. 2004;20:1356–1361. doi: 10.1021/la035606q. [DOI] [PubMed] [Google Scholar]
- 63.Liu XY, Boek ES, Briels WJ, Bennema P. Nature. 1995;374:342–345. [Google Scholar]
- 64.Burton WK, Cabrera N, Frank FC. Phil Trans R Soc. 1951;A243:299–358. [Google Scholar]
- 65.Bennema P. J Cryst Growth. 1984;69:182–197. [Google Scholar]
- 66.Hannon JB, Shenoy VB, Schwarz KW. Science. 2006;313:1266–1269. doi: 10.1126/science.1129342. [DOI] [PubMed] [Google Scholar]
- 67.Nielsen AE. Kinetics of Precipitation. Pergamon; Oxford: 1964. [Google Scholar]
- 68.Pina CM, Becker U, Risthaus P, Bosbach D, Putnis A. Nature. 1998;395:483–486. [Google Scholar]
- 69.Voorhees PW. Science. 2006;313:1247–1249. doi: 10.1126/science.1131892. [DOI] [PubMed] [Google Scholar]
- 70.Teng HH, Dove PM, Orme CA, De Yoreo JJ. Science. 1998;282:724–727. doi: 10.1126/science.282.5389.724. [DOI] [PubMed] [Google Scholar]
- 71.Teng HH, Dove PM, De Yoreo JJ. Geochim Cosmochim Acta. 2000;64:2255–2266. [Google Scholar]
- 72.Elhadj S, De Yoreo JJ, Hoyer JR, Dove PM. Proc Natl Acad Sci USA. 2006;103:19237–19242. doi: 10.1073/pnas.0605748103. [DOI] [PMC free article] [PubMed] [Google Scholar]
- 73.Weiner S, Dove PM. In: Biomineralization, Vol 54 of Reviews in Mineralogy and Geochemistry. Dove PM, De Yoreo JJ, Weiner S, editors. The Mineralogical Society of America; Washington, DC: 2003. pp. 1–29. [Google Scholar]
- 74.de Leeuw NH. J Phys Chem B. 2004;108:1809–1811. [Google Scholar]
- 75.Davis KJ, Dove PM, Wasylenki LE, De Yoreo JJ. Am Mineralogist. 2004;89:714–720. [Google Scholar]
- 76.Qiu SR, Wierzbicki A, Salter EA, Zepeda S, Orme CA, Hoyer JR, Nancollas GH, Cody AM, De Yoreo JJ. J Am Chem Soc. 2005;127:9036–9044. doi: 10.1021/ja043591s. [DOI] [PubMed] [Google Scholar]
- 77.Wang LJ, Zhang W, Qiu SR, Zachowicz WJ, Guan X, Tang R, Hoyer JR, De Yoreo JJ, Nancollas GH. J Cryst Growth. 2006;291:160–165. [Google Scholar]
- 78.Wang LJ, De Yoreo JJ, Guan X, Qiu SR, Hoyer JR, Nancollas GH. Cryst Growth Des. 2006;6:1769–1775. [Google Scholar]
- 79.Cabrera N, Vermilyea DA. Growth and Perfection of Crystals. Chapman and Hall; London: 1958. p. 393. [Google Scholar]
- 80.Land TA, Martin TL, Potapenko S, Tayhas Palmore G, De Yoreo JJ. Nature. 1999;399:442–445. [Google Scholar]
- 81.Potapenko S. J Cryst Growth. 1993;133:147–154. [Google Scholar]
- 82.Thomas TN, Land TA, DeYoreo JJ, Casey WH. Langmuir. 2004;20:7643–7652. doi: 10.1021/la049546f. [DOI] [PubMed] [Google Scholar]
- 83.Weaver ML, Qiu SR, Hoyer JR, Casey WH, Nancollas GH, De Yoreo JJ. ChemPhysChem. 2006;7:2081–2084. doi: 10.1002/cphc.200600371. [DOI] [PubMed] [Google Scholar]
- 84.De Yoreo JJ, Qiu SR, Hoyer JR. Am J Physiol Renal Physiol. 2006;291:F1123–F1132. doi: 10.1152/ajprenal.00136.2006. [DOI] [PubMed] [Google Scholar]
- 85.Wang LJ, Qiu SR, Zachowicz WZ, Guan X, De Yoreo JJ, Nancollas GH, Hoyer JR. Langmuir. 2006;22:7279–7285. doi: 10.1021/la060897z. [DOI] [PubMed] [Google Scholar]
- 86.Petsev DN, Chen K, Gliko O, Vekilov PG. Proc Natl Acad Sci USA. 2003;100:792–796. doi: 10.1073/pnas.0333065100. [DOI] [PMC free article] [PubMed] [Google Scholar]
- 87.Piana S, Jones F, Gale JD. J Am Chem Soc. 2006;128:13568–13574. doi: 10.1021/ja064706q. [DOI] [PubMed] [Google Scholar]
- 88.Liu J, Jiang H, Liu XY. J Phys Chem B. 2006;110:9085–9089. doi: 10.1021/jp057403b. [DOI] [PubMed] [Google Scholar]
- 89.Tang RK, Darragh M, Orme CA, Guan X, Hoyer JR, Nancollas GH. Angew Chem Int Ed. 2005;44:3698–3702. doi: 10.1002/anie.200500153. [DOI] [PubMed] [Google Scholar]
- 90.C. A. Orme, J. L. Giocondi, unpublished material.
- 91.Lasaga AC. Kinetic Theory in the Earth Sciences. Princeton University Press; Princeton: 1998. [Google Scholar]
- 92.Dove PM, Han N, De Yoreo JJ. Proc Natl Acad Sci USA. 2005;102:15357–15362. doi: 10.1073/pnas.0507777102. [DOI] [PMC free article] [PubMed] [Google Scholar]
- 93.Lasaga AC, Lüttge A. J Phys Chem B. 2005;109:1635–1642. doi: 10.1021/jp047631q. [DOI] [PubMed] [Google Scholar]
- 94.Helgeson HC, Murphy WM, Aagaard P. Geochim Cosmochim Acta. 1984;48:2405–2432. [Google Scholar]
- 95.Lasaga AC, Lüttge A. Science. 2001;291:2400–2404. doi: 10.1126/science.1058173. [DOI] [PubMed] [Google Scholar]
- 96.Tang R, Nancollas GH, Orme CA. J Am Chem Soc. 2001;123:5437–5443. doi: 10.1021/ja010064p. [DOI] [PubMed] [Google Scholar]
- 97.Lasaga AC, Lüttge A. Eur J Miner. 2003;15:603–615. [Google Scholar]
- 98.Lüttge A. J Electron Spectroscopy Related Phenomena. 2006;150:248–259. [Google Scholar]
- 99.Cabrera N, Levine MM, Plaskett JS. Phys Rev. 1954;96:1153–1156. [Google Scholar]
- 100.Lasaga AC, Blum AE. Geochim Cosmochim Acta. 1986;50:2363–2379. [Google Scholar]
- 101.Tang RK, Orme CA, Nancollas GH. J Phys Chem B. 2003;107:10653–10657. [Google Scholar]
- 102.Tang RK, Orme CA, Nancollas GH. Chem Phys Chem. 2004;5:688–696. doi: 10.1002/cphc.200300956. [DOI] [PubMed] [Google Scholar]
- 103.Tang RK, Wu W, Haas M, Nancollas GH. Langmuir. 2001;17:3480–3485. [Google Scholar]
- 104.Tang RK, Wang LJ, Nancollas GH. J Mater Chem. 2004;14:2341–2346. [Google Scholar]
- 105.Tang RK, Henneman ZJ, Nancollas GH. J Crystal Growth. 2003;249:614–624. [Google Scholar]
- 106.Piana S, Gale JD. J Am Chem Soc. 2005;127:1975–1982. doi: 10.1021/ja043395l. [DOI] [PubMed] [Google Scholar]
- 107.Lüttge A, Zhang L, Nealson KH. Am J Sci. 2005;305:766–790. [Google Scholar]
- 108.Beig MS, Lüttge A. Geochim Cosmochim Acta. 2006;70:1402–1420. [Google Scholar]
- 109.Yanina SV, Rosso KM, Meakin P. Geochim Cosmochim Acta. 2006;70:1113–1127. [Google Scholar]
- 110.Perry TD, Owen IV, Duckworth W, Kendall TA, Martin ST, Mitchell R. J Am Chem Soc. 2005;127:5744–5745. doi: 10.1021/ja042737k. [DOI] [PubMed] [Google Scholar]
- 111.Anderson P, Elliott JC, Bose U, Jones SJ. Arch Oral Biol. 1996;41:281–290. doi: 10.1016/0003-9969(95)00122-0. [DOI] [PubMed] [Google Scholar]
- 112.Dowker SEP, Elliott JC, Davis GR, Wassif HS. Caries Res. 2003;37:237–245. doi: 10.1159/000070865. [DOI] [PubMed] [Google Scholar]
- 113.Wang LJ, Tang RK, Bonstein T, Orme CA, Bush PJ, Nancollas GH. J Phys Chem B. 2005;109:999–1005. doi: 10.1021/jp046451d. [DOI] [PubMed] [Google Scholar]
- 114.Anderson P, Levinkind M, Elliott JC. Arch Oral Bio. 1998;43:649–656. doi: 10.1016/s0003-9969(98)00052-1. [DOI] [PubMed] [Google Scholar]
- 115.Chow LC, Takagi S. Caries Res. 1989;23:129–134. doi: 10.1159/000261165. [DOI] [PubMed] [Google Scholar]
- 116.Wang LJ, Tang RK, Bonstein T, Bush P, Nancollas GH. J Dent Res. 2006;85:359–363. doi: 10.1177/154405910608500415. [DOI] [PMC free article] [PubMed] [Google Scholar]
- 117.Wu W, Nancollas GH. Adv Colloid Interface Sci. 1999;79:229–279. doi: 10.1016/s0001-8686(98)00072-4. [DOI] [PubMed] [Google Scholar]
- 118.Kay MI, Young RA, Posner AS. Nature. 1964;204:1050–1052. doi: 10.1038/2041050a0. [DOI] [PubMed] [Google Scholar]
- 119.Tang RK, Wang LJ, Orme CA, Bonstein T, Bush PJ, Nancollas GH. Angew Chem Int Ed. 2004;43:2697–2701. doi: 10.1002/anie.200353652. [DOI] [PubMed] [Google Scholar]
- 120.Weiner S, Wagner HD. Annu Rev Mater Sci. 1998;28:271–298. [Google Scholar]
- 121.Landis WJ. Bone. 1995;16:533–544. doi: 10.1016/8756-3282(95)00076-p. [DOI] [PubMed] [Google Scholar]
- 122.Gao H, Ji B, Ingomar LJ, Arz E, Fratzl P. Proc Natl Acad Sci USA. 2003;100:5597–5600. doi: 10.1073/pnas.0631609100. [DOI] [PMC free article] [PubMed] [Google Scholar]
- 123.Wang LJ, Nancollas GH, Henneman ZJ, Klein E, Weiner S. Biointerphases. 2006;1:106–111. doi: 10.1116/1.2354575. [DOI] [PubMed] [Google Scholar]
- 124.Hassenkam T, Fantner GE, Cutroni JA, Weaver JC, Morse DE, Hansma PK. Bone. 2004;35:4–10. doi: 10.1016/j.bone.2004.02.024. [DOI] [PubMed] [Google Scholar]
- 125.Banfield JF, Welch SA, Zhang HT, Ebert T, Penn RL. Science. 2000;289:751–754. doi: 10.1126/science.289.5480.751. [DOI] [PubMed] [Google Scholar]
- 126.Cölfen H, Antonietti M. Angew Chem Int Ed. 2005;44:5576–5591. doi: 10.1002/anie.200500496. [DOI] [PubMed] [Google Scholar]
- 127.Cölfen H, Mann S. Angew Chem Int Ed. 2003;42:2350–2365. doi: 10.1002/anie.200200562. [DOI] [PubMed] [Google Scholar]
- 128.Margolis HC, Beniash E, Fowler CE. J Dent Res. 2006;85:775–793. doi: 10.1177/154405910608500902. [DOI] [PubMed] [Google Scholar]
- 129.Dunin-Borkowski RE, McCartney MR, Frankel RB, Bazylinski DA, Pósfai M, Buseck PR. Science. 1998;282:1868–1870. doi: 10.1126/science.282.5395.1868. [DOI] [PubMed] [Google Scholar]
- 130.Alivisatos AP. Science. 2000;289:736–737. doi: 10.1126/science.289.5480.736. [DOI] [PubMed] [Google Scholar]
- 131.Yeadon M, Ghaly M, Yang JC, Averback RS, Gibson JM. Appl Phys Lett. 1998;73:3208–3210. [Google Scholar]
- 132.Penn RL, Banfield JF. Science. 1998;281:969–971. doi: 10.1126/science.281.5379.969. [DOI] [PubMed] [Google Scholar]
- 133.Zhu HL, Averback RS. Philos Mag Lett. 1996;73:27–33. [Google Scholar]
- 134.McHale JM, Auroux A, Perrotta AJ, Navrotsky A. Science. 1997;277:788–791. [Google Scholar]
- 135.Zhang H, Banfield JF. J Mater Chem. 1998;8:2073–2076. [Google Scholar]
- 136.Schwertmann U, Friedl J, Stanjek HJ. J Colloid Interface Sci. 1999;209:215–223. doi: 10.1006/jcis.1998.5899. [DOI] [PubMed] [Google Scholar]