Abstract
The cruciform hypothesis states that if a visual evoked potential component originates in V1, then stimuli placed in the upper versus lower visual fields will generate responses with opposite polarity at the scalp. This diagnostic has been used by many studies as a definitive marker of V1 sources. To provide an empirical test of the validity of the cruciform hypothesis, we generated forward models of cortical areas V1, V2 and V3 that were based on realistic estimates of the 3-D shape of these areas and the shape and conductivity of the brain, skull and scalp. Functional MRI was used to identify the location of early visual areas and anatomical MRI data was used construct detailed cortical surface reconstructions and to generate boundary element method forward models of the electrical conductivity of each participant’s head. These two data sets for each subject were used to generate simulated scalp activity from the dorsal and ventral subdivisions of each visual area that correspond to the lower and upper visual field representations, respectively. The predicted topographies show that sources in V1 do not fully conform to the cruciform sign-reversal. Moreover, contrary to the model, retinotopic visual areas V2 and V3 show polarity reversals for upper and lower field stimuli. The presence of a response polarity inversion for upper versus lower field stimuli is therefore an insufficient criterion for identifying responses as having originated in V1.
INTRODUCTION
Localizing the sources of cortical activity from measurements of electromagnetic activity at the scalp is an important step in the interpretation of the functional significance of evoked responses. Localization of underlying sources is often approached through inverse modeling, but it has been suggested that evoked response components originating in striate cortex (area V1) can be identified on the basis of a characteristic polarity inversion of the response between upper and lower visual field stimuli (Jeffreys, 1971; Jeffreys and Axford, 1972a, b). Jeffreys made this argument based on correlations between the pattern of visual field losses and the locus of cortical damage determined post-mortem (Holmes, 1945) and from electrical stimulation results obtained during surgery (Brindley and Lewin, 1968). These data localized the striate cortex within the calcarine sulcus and more specifically suggested that the visual field octants straddling the horizontal meridian lay fully within the fissure on its “floor” and “roof”. The octants adjacent to the vertical meridian were seen to be on the medial facing walls of the calcarine fissure. Evoked response sources on the floor and roof of the sulcus were thus expected to be of opposite orientation and a set of numerical simulations of the expected scalp topography based on single current dipoles placed in the presumed location and orientation of the upper and lower field projections in the calcarine fissure mimicked the measured topography for a range of retinal loci (Jeffreys and Axford, 1972a, b). An upper/lower field polarity inversion has subsequently been widely used for the past 40 years as a diagnostic criterion for determining whether a given component of the evoked response is dominated by V1. Di Russo et al. (2002) reviewed the literature on the generators of the C1 component of the pattern appearance response. The literature on the generators of the N75 component of the pattern reversal response is reviewed in Di Russo et al. (2005). The underlying source geometry model has become known as the “cruciform” model or hypothesis.
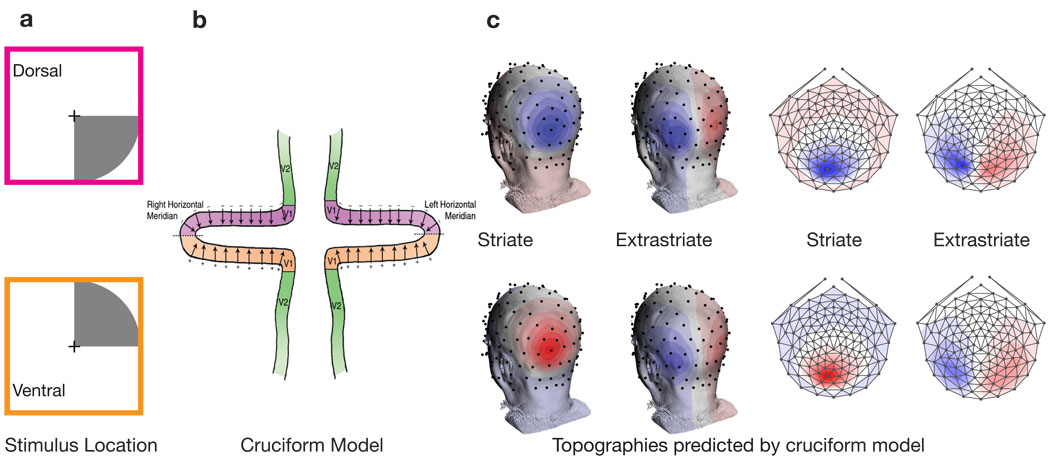
The model is often schematized as having a cross or “cruciform” shape when viewing the calcarine sulcus in a coronal section through the occipital lobe as shown in Figure 1. This sort of cartoon was admitted by Jeffreys to be only a schematic representation of the folding pattern of the region of calcarine cortex that contains V1 and adjacent visual areas e.g., V2, and V3, although these areas had yet to be differentiated at the time he proposed the model. The model relies on several assumptions: 1) That evoked potentials are generated by pyramidal cells oriented normal to the cortical surface; 2) That the sulcus has retinotopic specificity --- lower visual field stimuli activate the roof --- while upper visual field stimuli activate the floor of the sulcus; 3) that the sulcus is oriented horizontally. With these assumptions, an experimenter changes the location of a visual stimulus from the upper visual field to the lower visual field and expects to find components of opposite polarity arising from the corresponding loci in V1. A sign-reversing component of the electrical potential recorded on the scalp is thus diagnostic of a source located in striate cortex/V1 because, in the context of the model, it is the only retinotopic region that has the requisite source geometry.
Figure 1.
The upper plot in panel a) shows a lower visual field stimulus that will activate dorsal visual areas, while the lower plot shows an upper visual field stimulus that will activate ventral areas. Panel b) depicts the cruciform model of the anatomically organization of V1 and V2. The arrows in V1 represent predicted source orientations. This model predicts sources in V1 flipping orientation while V2 source maintain a consist orientation. The predicted topographies of this model are shown in panel c). The top row corresponds to sources in dorsal areas, while the bottom row corresponds to ventral areas. The topography simulations were realized by placing sources in V1 and V2 with orientations as specified by the cruciform model in panel b). Panel d) shows a flattened representation of the topographies in panel c).
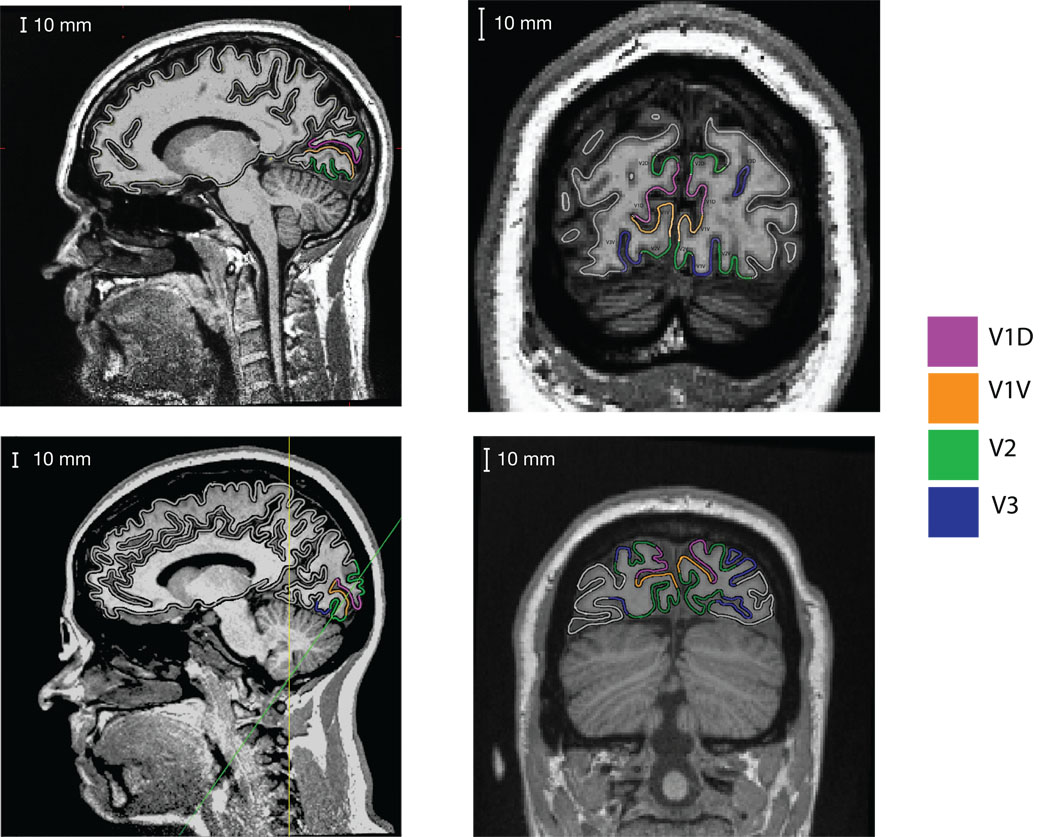
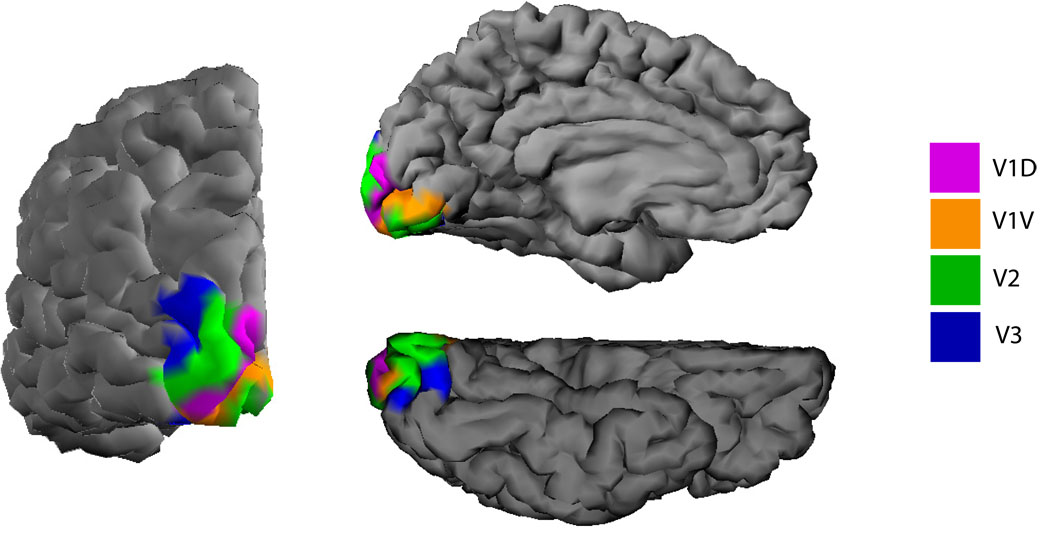
With the advent of robust procedures for mapping retinotopic visual areas using functional Magnetic Resonance Imaging (Sereno et al., 1995; DeYoe et al., 1996; Engel et al., 1997), it is possible now to revisit the cruciform model and to better test its predictions for scalp topography in individual participants. Figure 2 shows a coronal MRI section through the occipital cortex of an individual participant containing the calcarine sulcus. The upper and lower field representations of V1, V2 and V3 obtained from fMRI are shown in color. It is clear from this figure that the actual situation is much more complex than envisaged by the cruciform model and that variations of the sulcus shape can make the aggregate dipole moments deviate from being anti-parallel for upper and lower visual field projections in V1. If, for instance, the bottom of the calcarine sulcus is flattened, as seen in Figure 2 in the upper right coronal section, right hemisphere, the aggregate dipole moment for upper/lower stimuli points in the same direction instead of in opposite directions. Transverse folds running across the calcarine sulcus, shown in Figure 3 upper right medial view in V1d, also interfere with the predicted 180-degree flip in source orientation.
Figure 2.
MRI scans with visual areas V1, V2 and V3 labeled. Data from two participants are shown on the two rows. The first column shows a sagittal slice of both subjects. In this slice V1 is seen to localize to the calcarine sulcus, with V2 presenting both above and below. The second column contains a coronal slice for the first subject. The participant displays a complicated asymmetric folding pattern in the calcarine, with the left hemisphere showing an “s” curve, and the right hemisphere having a flattened bottom. For the second participant in the bottom row, an oblique slice taken perpendicular to the calcarine sulcus is displayed (indicated by the green line on the sagittal slice). This participant displays a calcarine sulcus that conforms more closely to the cruciform model, but also demonstrates how extrastriate areas V2 and V3 do not conform to the model since they also have opposite surface orientations. The anatomy of these subjects illustrates the heterogeneity of the calcarine sulcus.
Figure 3.
A rendering of the left hemisphere mid-gray surface with visual areas labeled. The left is a view of the posterior surface, the upper right is a view of the medial wall, and the lower right is a view of the ventral surface.
Here we used fMRI retinotopic mapping to provide the locations of the visual areas V1, V2 and V3 on high resolution structural scans. This procedure allowed us to obtain the three dimensional shape of the upper and lower visual field projections in V1 and adjacent areas V2 and V3 that might be confused with V1. These individually defined subsets of the cortical surface served as a constraint for sources in the upper and lower field projections in V1, V2 and V3. The expected scalp topographies of distributed sources in these areas were computed via a realistically shaped Boundary Element Method (BEM) forward model of the electrical properties of the brain, skull and scalp. Using these simulations, we tested two key predictions of the cruciform model: that V1 activity results in a polarity inverted scalp topography when its dorsal (lower visual field) and ventral (upper visual field) divisions are active and conversely, that the dorsal and ventral divisions of V2 and V3 do not produce polarity-inverted scalp topographies. Our simulations indicate that neither of these predictions from the cruciform model is consistently met. Across 27 participants only 3 hemispheres from 3 different subjects showed an inverse of polarity for a V1 source. Because the predictions of the cruciform model are violated in a majority of individuals polarity inversion is an unreliable diagnostic for activity originating in striate cortex.
METHODS
Participants
Retinotopic maps and structural scans were acquired in a total of 27 visually normal adult observers (19 male, mean age 36.4) as part of a number of other projects not related to this analysis. All participants had visual acuity of 20/20 or better in each eye, with correction if needed, and stereoacuity of 40 arc seconds or better on the Titmus and Randot stereoacuity tests. Informed consent was obtained prior to experimentation under a protocol that was approved by the Institutional Review Board of the Smith-Kettlewell Eye Research Institute.
Realistic forward model creation
Structural and functional MRI scanning was conducted at 3T on either a Siemens TIM Trio using a 12-channel head coil or a 3T GE Signa LX scanner. For fMRI, we employed a single-shot, gradient-echo EPI pulse sequence. Once per session, a 2-D SE T1-weighted volume was acquired with the same slice specifications as the functional series in order to align the fMRI data to the high resolution anatomical scan.
Rotating wedge stimuli were used to map polar angle sensitivity and expanding and contracting ring stimuli were used to map retinal eccentricity. Fifteen participants viewed a mapping stimulus extending to 10 degrees of eccentricity, another twelve viewed a mapping stimulus extending to 4 degrees. Fourier analysis was used to extract the magnitude and phase of the BOLD signal, which was visualized on a flattened representation of the cortical surface. Retinotopic field mapping produced ROIs defined for each participant's visual cortical areas V1, V2v, V2d, V3v, V3d in each hemisphere (DeYoe et al., 1996; Engel et al., 1997; Wade et al., 2002). We additionally split V1 at the retinotopically specified horizontal meridian to label V1d and V1v.
The FreeSurfer software package (Dale et al., 1999) (http://surfer.nmr.mgh.harvard.edu) was used to perform gray and white matter segmentation and cortical surface extraction. The FreeSurfer package extracts both gray/white and gray/cerebrospinal fluid (CSF) boundaries, but these surfaces can have different surface orientations. In particular, the gray/white boundary has sharp gyri (the curvature changes rapidly) and smooth sulci (slowly changing surface curvature), while the gray/CSF boundary is the inverse, with smooth gyri and sharp sulci. In order to avoid these discontinuities, we generated a surface partway between these two boundaries that has gyri and sulci with approximately equal curvature. From FreeSurfer a high-resolution cortical surface (~200,000 vertices) from each hemisphere in each subject was inflated to a sphere. Using MNESuite, this sphere was fit with 5-fold recursively subdivided icosahedron, having 10,242 vertices per hemisphere. This made the source sampling regular on the cortical surface. After refolding these sampled vertices, the volumetric distances between connected vertices was on average 3.7 mm, with a standard deviation of 1.5mm, range 0.1–11 mm. This cortical surface was used as a source constraint.
Individual BEM conductivity models were derived from the T1 and T2 weighted MRI scans of each observer. The FSL toolbox (Smith, 2002) (http://www.fmrib.ox.ac.uk/fsl/) was used to segment contiguous volume regions for the scalp, outer skull, inner skull and to convert these MRI volumes into inner skull, outer skull, and scalp surfaces.
Electrode position measurements for each observer were taken from a representative EEG recording session. A Polhemus FASTRACK system was used to digitize the electrode positions. Co-registration of electrode positions to the MRI head surface was done in MATLAB by a joint least-squares fit of three digitized fiducial points to their visible locations on the anatomical MRI, and a least-square fit minimizing the variation of electrode to scalp distance that kept the electrodes equidistant from the head surface.
The accurate representations of individual cortical surfaces, the 3-D electrode locations, and the individually defined scalp, skull and brain compartments were combined using the MNE software package (Hamalainen and Sarvas, 1989) (http://www.nmr.mgh.harvard.edu/martinos/userInfo/data/sofMNE.php) to create a BEM forward solution of the propagation of fields from the retinotopically identified dorsal and ventral subdivisions of V1, V2 and V3 of each hemisphere. We simulated sources as having uniform current density within a visual area and orientations constrained to be normal to the cortical surface.
RESULTS
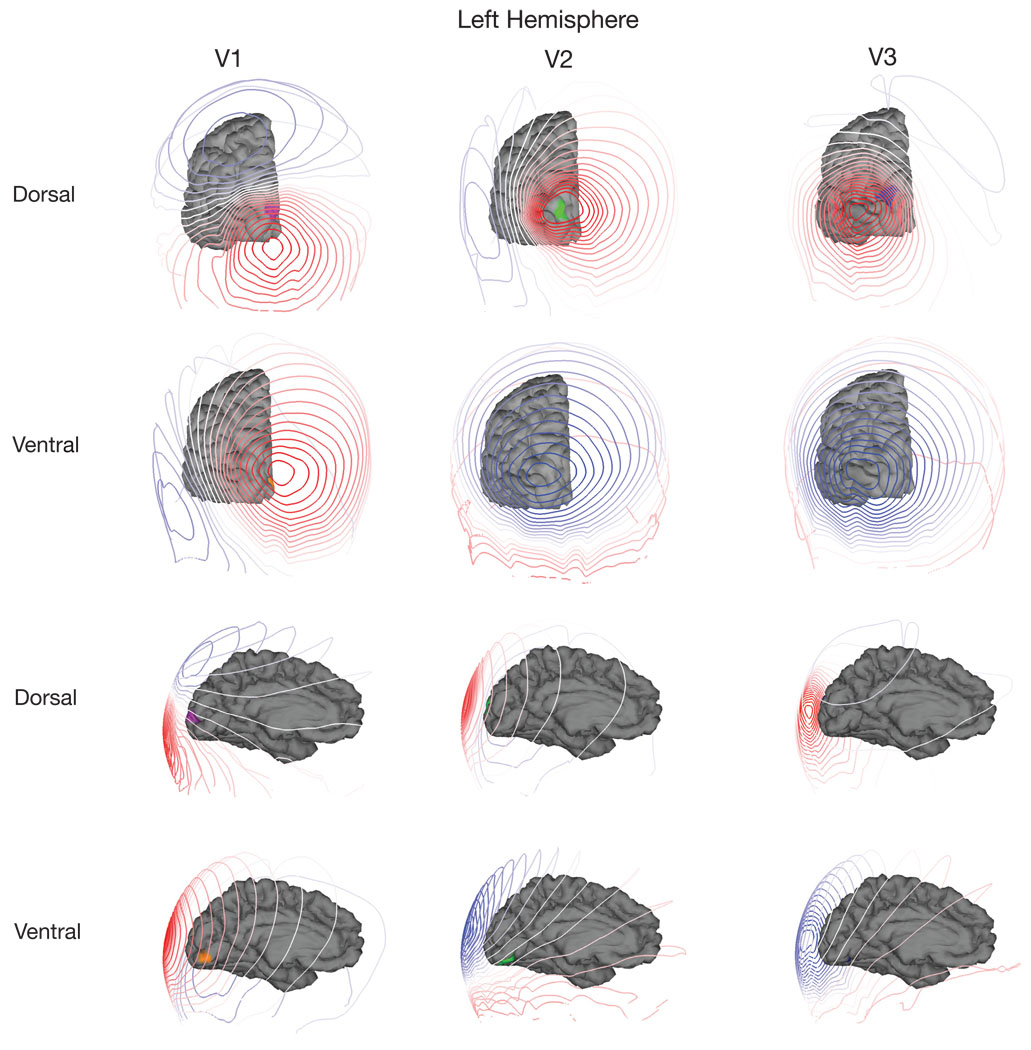
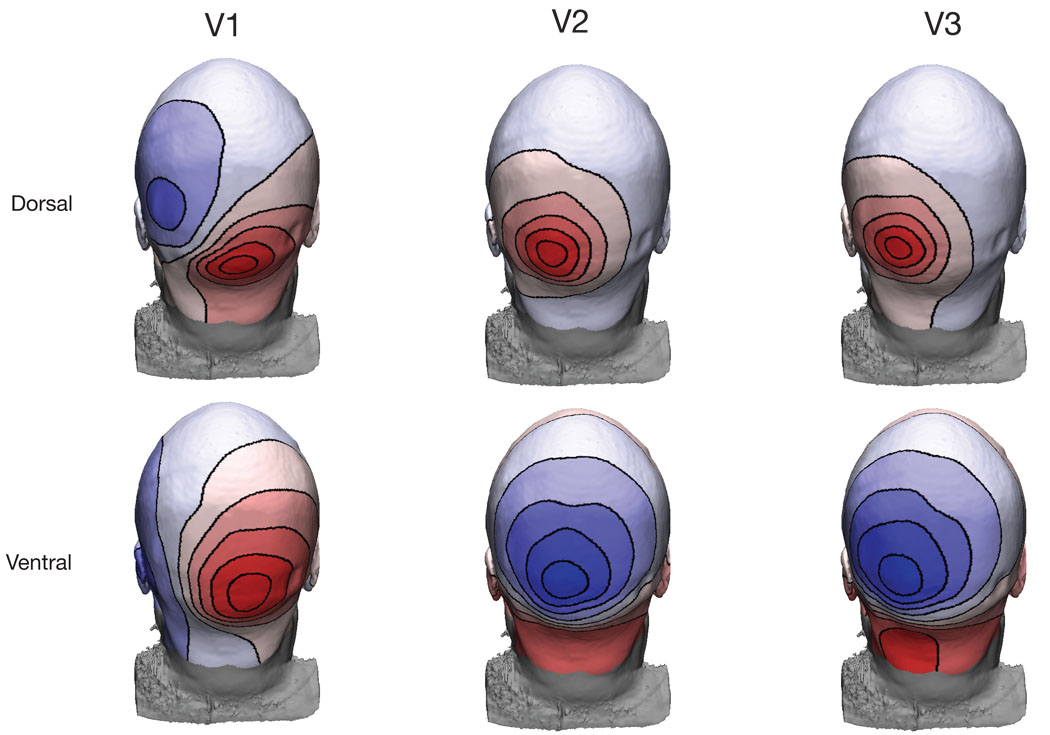
The precise anatomical shape of 27 individual cortices (54 hemispheres), combined with functional mapping of retinotopic visual areas was used to predict the scalp potential from a given visual area. Figure 4a–d illustrates the modeling. Figure 4a shows a posterior view of a single hemisphere from a single participant. The colored regions label the dorsal and ventral subdivisions of V1, V2 and V3 (the colors are consistent with Figure 3). The contours in Figure 4b plot the predicted scalp topography from the left dorsal division of V1. These potentials are plotted as an interpolated colormap on the participant’s scalp in Figure 4c. The scaling of these colormaps has been set independently. Finally, a representation that shows all scalp locations is given by showing a flattened view of the electrodes (Figure 4d). The field lines map out a quasi-dipolar topography that is consistent with the relatively small extent of the activated cortical surface.
Figure 4.
In panel a) is the cortical surface with visual areas labeled. In b) there are contour lines corresponding to the potential on the scalp from a simulated source. Panel c) shows how these contours appear on the scalp. Panel d) plots the scalp topography as a flattened representation.
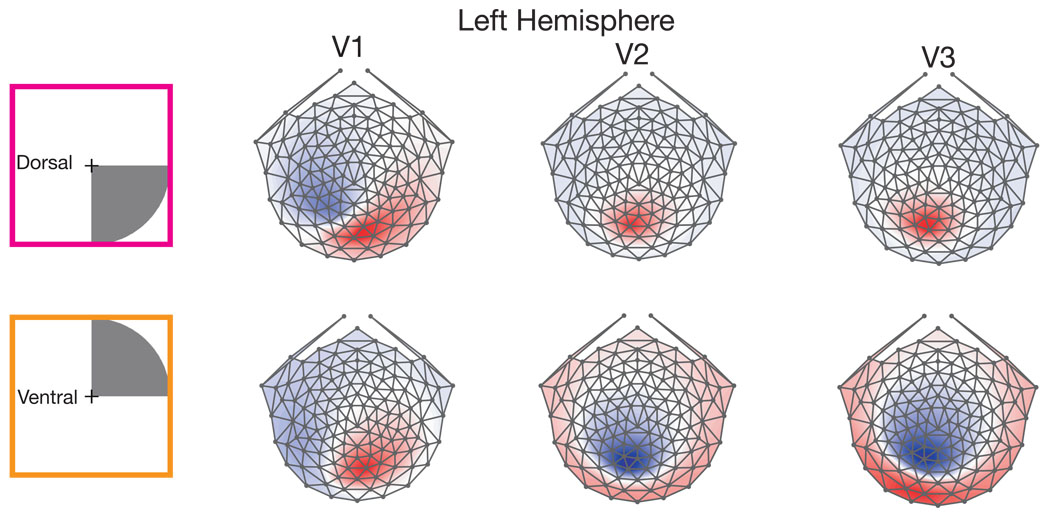
The simulated topographic data for the dorsal and ventral subdivisions of V1, V2, and V3 for two different size stimuli in a single participant are shown in Figure 5 and Figure 6. A number of previous empirical studies have used small stimuli that were presented at low eccentricities in the upper versus lower visual fields. Because the size of the stimulus may have an effect on the topographic predictions we simulated sources corresponding to quarter-field sized stimuli activating 4 degrees of the dorsal or ventral quadrant of a visual area, and also dorsal and ventral ring segments from 3–4 degrees in the periphery. Figure 5 shows the results from a simulated 3–4 degree ring segment, while Figure 6 shows the results for the 4 degree radius quarter field stimuli. The simulations for this participant clearly demonstrate that for both size stimuli, the sources in V1 change orientation, but do not completely reverse polarity. Moreover, activation of the dorsal versus ventral divisions of V2 results in a polarity reversal over a large portion of the posterior scalp.
Figure 5.
Predicted topographic components early visual areas in an individual subject. Each plot contains the results of simulating a uniform source in a ring ranging from 3–4 degrees eccentricity in a single visual area. The visual areas are color-coded the same as in Figure 3. The topographies in V1 do not full invert, but appear to rotate about 90 degrees, resulting in only a few locations showing polarity flips. The V2 and V3 sources exhibit many places where voltages completely reverse polarity for sources in their dorsal versus ventral divisions.
Figure 6.
Predicted scalp topographies from early visual areas in a single participant. Each plot contains the results of simulating a uniform source in a single visual area. Each colormap is scaled separately to highlight the shape of the topography. The topographies in V1 do not full invert, but appear to rotate about 90 degrees, resulting in only a few locations showing polarity flips. While the V2 and V3 sources exhibit many places where voltages completely reverse polarity.
Nevertheless, even if an individual deviates from the response pattern predicted by the cruciform model, it may hold up on average over a large population. Figure 7 shows topographies for quadrant-sized stimuli extending to 4 degrees in the right visual field averaged over 12 participants. The left visual field simulation results are shown in Supplementary Figure 1. As in Figure 5 and Figure 6, V1 shows an incomplete orientation change, while V2 and V3 demonstrate sign-inverting topographies that are supposed to be characteristic only of V1.
Figure 7.
Simulated topographies averaged over 12 participants in the study. A schematic of the simulated 4 degree radius quadrant stimulus is shown on the far left. The same pattern as demonstrated by the individual subject in Figure 6 appears on the cross subject average. The topographies in V1 do not full invert, but appear to rotate about 90 degrees, resulting in only a few locations showing polarity flips. While the V2 and V3 sources exhibit many places where voltages completely reverse polarity.
The previous simulation results used regions of interest corresponding to quarter-field sized stimuli activating 4 degrees of the dorsal or ventral quadrant of a visual area. The size of the stimulus may have an effect on the topographic predictions. We therefore defined smaller ROI’s that corresponded to a ring from 3–4 degrees in the periphery and we also simulated data from a group of 15 participants whose retinotopic mapping was done using a 10 degree radius field of view stimuli. We simulated full activation of these larger quadrant stimuli for these participants. The simulations are shown in Supplementary Figures 2–3. The results for the change of stimulus size are consistent with those from the 4-degree quadrant stimulus shown in Figure 7. V1 shows an incomplete orientation change while V2/V3 sign invert.
Mixtures of sources
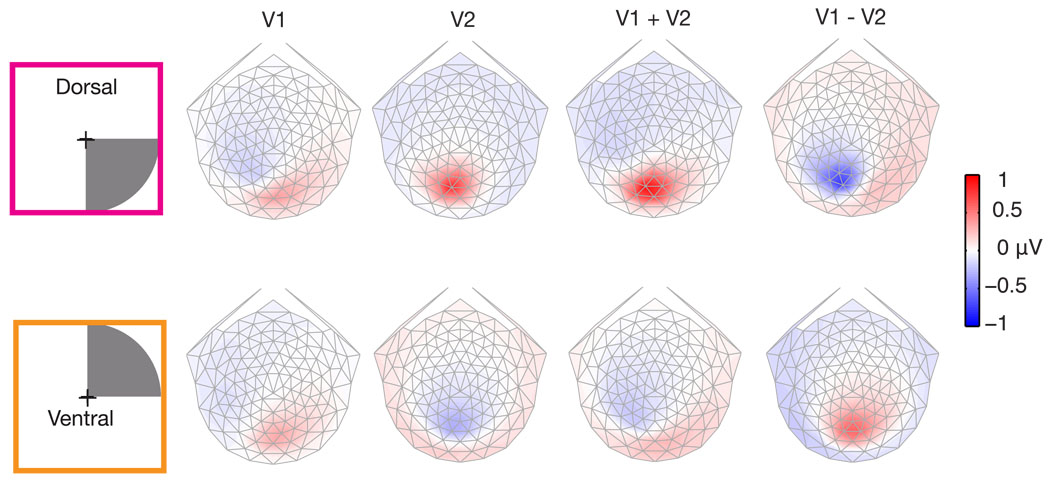
The previous simulations showed predicted topographies for an isolated source in a single visual area. However, visually evoked potential measurements are the result of a linear combination of the response from multiple visual areas. Figure 8 demonstrates four linear combinations of quadrant-sized sources in V1 and V2 (V3 topographies are very similar to V2 and so were omitted for simplicity). The four choices were: V1 alone, V2 alone, V1 plus V2, and V1 minus V2. There are an infinite number of linear combinations, these specific ones were chosen because they are representative of the range of combinations. V1 minus V2 was included because the cortical sources that contribute the dipolar far field measured at the scalp can be either positive or negative. The sources in V1 and V2 were simulated with identical current density and an area of activation determined by the fMRI defined retinotopic mapping. To facilitate comparison, every topography is presented using the same colormap. Isolated activation of dorsal V2 provides a larger voltage than does dorsal V1 (top row, Figure 8). Ventral areas have similar magnitude voltages for isolated activations (bottom row Figure 8). The largest voltages result when dorsal areas V1 and V2 are combined. Interestingly, both adding and subtracting V1 with V2 provides these large voltages. Whereas, for ventral sources the largest voltage occurs when V2 is subtracted from V1. It should be noted that the topography resulting from V1 being subtracted from V2 (V2 − V1), is simply a sign inversion of the topography shown in Figure 8. Also note that the topographies from linearly combining V1 and V2 could be explained with a single source. The linear combinations of V1 and V2 demonstrate that sign inversion for upper/lower field stimuli occurs even when there are sources in multiple visual areas.
Figure 8.
Simulated linear combinations of V1 and V2. The upper row shows topographies for a lower right visual field (dorsal left hemisphere) source. Note the color scale, unlike previous figures each topography has an identical color scaling. Dorsal V2 produces the largest scalp voltages. Linear combinations of V1 and V2 have significant contributions from V2.
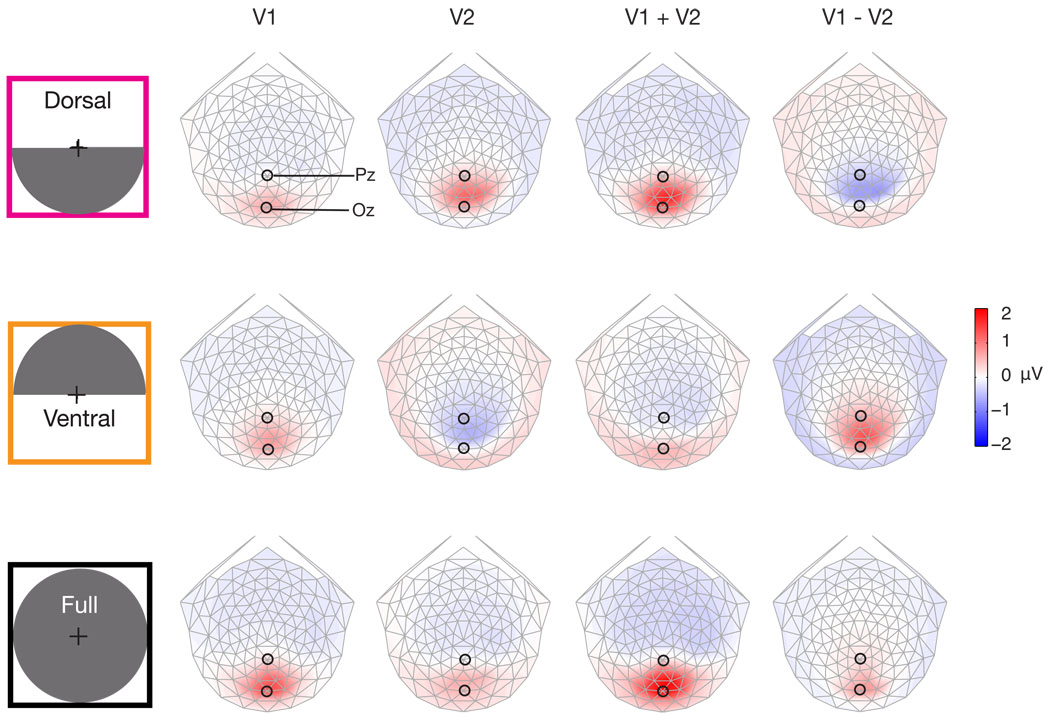
Bilateral stimuli are commonly used in many VEP experiments. Simulations for bilateral stimuli presented in the upper visual field, lower visual field, and combined upper/lower field are shown in Figure 9. These simulations are identical to those described in Figure 8 except for the size of the simulated stimulus and the color scaling. As before for dorsal sources, isolated activation of area V2 results in a larger voltage than activation of V1, while the linear combination of both is even larger (top row, Figure 9). Ventral sources also show the same pattern as in Figure 8: Similar magnitudes for isolated V1 and V2, with the largest voltages occurring when V1 and V2 have opposite polarity (middle row, Figure 9). A “full-field” stimulus is the only configuration in which isolated V1 sources show a larger scalp potential than V2 (bottom row, Figure 9). Also note, that between electrode locations Pz and Oz the polarity does not invert for upper/lower field stimuli in V1, but does for an extrastriate source. Even for bilateral stimuli the topographies predicted by the cruciform model of cortical folding do not occur. When sources are not single isolated visual areas, but linear combinations of multiple visual areas it is difficult to formulate a simple rule that unambiguously isolates striate cortex,
Figure 9.
Simulated linear combinations of V1 and V2 for bilateral stimuli. The first row contains topographies for a bilateral lower visual field (dorsal) stimulus. The middle row contains simulations for a bilateral upper visual field (ventral) stimulus. The bottom row contains the topographies for a full field stimulus. Note all topographies are identically scaled, and the color scaling is twice that of Figure 8. The only time the scalp voltage for a V1 source is larger than V2 is for the full field stimulus. For bilateral upper/lower visual field stimuli V1 has a consistent polarity at between Pz and Oz, while V2 reverses polarity.
DISCUSSION
Simulations of the expected scalp topography generated by sources in cortical areas V1, V2 and V3 show two departures from the cruciform model: an inversion of response polarity is not specifically associated with sources in V1, rather it is typical of sources in V2 and V3. Moreover, sources in V1 show changes in the orientation of the scalp map, but not its sign. Taken together, these results indicate that the polarity inversion of response components over the occipital scalp is not a reliable index of activity in V1. This pattern of results was obtained with quadrants of the visual field and with more limited annular stimuli confined to quadrants.
Our simulations differ in several respects from previous simulations in the literature. Ours is the first study to use individually determined surface-based forward models of the relevant visual areas (V1, V2 and V3). There are two benefits of this approach. The first is that the sources included in the forward models have realistic location and orientation parameters. The second is that we have modeled distributed activity in these areas. Previous analytical forward models have assumed both location and orientation parameters (Jeffreys, 1971; Jeffreys and Axford, 1972b, a; Onofrj et al., 1995) rather than having measured them in individual participants and have use single point sources (single equivalent current dipoles).
It is possible there may be a set of upper and lower field locations that yield a polarity inverted scalp distribution for sources in V1, but not for any other retinotopic visual area. This could hold for a given individual, or possibly even for a group of participants. Our simulations with quadrants and eccentricity-restricted annuli narrow the possible choices considerably. The simulation results of Ales et al. (2009) are relevant here. They modeled the expected topography for sources in V1 and V2 for many small stimulus locations out to 8.5 degrees eccentricity. Their results in two observers are in general agreement with ours: V1 sources do not reliably produce polarity inverted scalp topographies but V2 sources sometimes do. Given the robustness of the polarity inversion effect from sources in V2 and V3 in our simulations, it would be imperative to determine whether any proposed set of target locations actually produces the specific patterns needed to localize V1 in individual participants. To do this would involve the sort of detailed forward modeling that we have presented here or that has been done previously (Ales et al., 2009). Any protocol deviations from such a validated set of locations would also need to be validated.
The observation of response components that invert polarity between upper and lower field stimuli has been replicated many times and there is no question that it occurs as an empirical phenomenon. Di Russo et al. (2002) describes the papers that have used the presence of a polarity inversion to isolate V1 as the generator of the C1 component of the pattern appearance VEP.We simply question whether it is due to the geometric properties of the retinotopic map in V1. Ours is not the first study to question the validity of the cruciform model. Halliday and Michael (1970) reasoned that the cruciform model predicts that stimuli placed near the vertical meridian in the upper and lower visual fields should not produce a polarity inversion at the scalp because these parts of the visual field are represented on the medial faces of the calcarine fissure and not within it (see Figure 1, V1/V2 boundary). Nonetheless, clear polarity reversals were seen with both full octants next to the vertical meridian (Halliday and Michael, 1970) and with peripheral stimulus patches next to the vertical meridian (Michael and Halliday, 1971a). They argued that the sources of the polarity-inverting peak generated by stimuli next to the vertical meridian were located on the upper and lower surfaces of the occipital lobe in extra-striate cortex (Halliday and Michael, 1970; Michael and Halliday, 1971b). This view is consistent with the orientations of tissue in V2 and V3 (see Figure 2) and is also consistent with our finding that polarity inverted scalp maps can arise from quadrantic and annular sources in these areas (Figure 7 and Supplementary Figure 2).
Onofrj et al. (1995) recorded pattern reversal responses to a variety of spatially restricted stimuli. They compared predictions from two versions of the cruciform model that differed in the relative orientation of the “arms” of the cross and a model in which the operative sources were on the medial surfaces of the cortex, rather than within the calcarine sulcus. The measured fields were more consistent with the latter than the former forward models.
Several studies have used multifocal stimulation methods to record from multiple stimulus locations simultaneously. These studies consistently find evoked components that reverse polarity for stimuli presented near or just below the horizontal meridian (Slotnick et al., 1999; Tabuchi et al., 2002; James, 2003; Zhang and Hood, 2004). The cruciform model was evoked to explain this polarity reversal by Zhang and Hood (2004) who recorded multifocal VEPs from three bi-polar derivations over the occipital pole. Tabuchi et al. (2002) recorded multi-focal MEG response and found dipoles that localized to contralateral hemispheres and used the cruciform model to infer V1 as being the source of each peak of the evoked potential. James (2003) also found that dipoles localized to contralateral hemispheres were required to fit multifocal data, consistent with activity in early visual areas. Our functional retinotopic mapping (Figure 2) indicates that V2 and V3 curve back around V1. We find that the centroid of activation for an aggregate V1, V2 and V3 source to the 3–4 degree annuli stimuli is on average 8 mm from the centroid of V1 (range across 12 participants 4–13 mm). The centroid of an aggregate source in V1 and V2 lies 5 mm, on average, from the centroid of V1 (range 1–8 mm). The tight packing of V1, V2, and V3 make the localization of these dipoles consistent with a source in any one of these visual areas, or an aggregate activity in multiple visual areas.
Foxe and Simpson (2002) have argued that only the earliest portion of CI can be interpreted as being derived from striate cortex. They made this argument based on increases in the complexity of the scalp topography as one ascends the rising phase of the CI component and on a review of the likely latencies of responses in extra-striate visual areas which were noted to be very short. Because sources in V1, V2 and V3 for small stimuli are compact and are close together in three dimensions, combinations of these sources can produce rather focal scalp topographies, the simplicity of the topography at early latencies is not a strong argument. Moreover, Ales et al. found that sources in V1 and V2 have very similar onset latencies and thus reliance on the earliest part of the CI components as a marker for V1 may not reliably exclude sources in V2 and/or V3.
Perhaps the strongest case for CI arising in striate cortex comes from the study of Di Russo et al. (2002). They made their argument based on the topography of C1, its early onset latency, retinotopic polarity inversion and dipole source modeling that was referenced to structural MRI data and to functional MRI mapping. Dipolar sources were fit to the grand average CI topographies in Talaraich space. Functional MRI data was obtained for the VEP stimuli for 5 subjects, three of whom additionally had retinotopic mapping. The fMRI locus of striate cortex activity was converted to Talairach space (how this was done for the 2 subjects who did not have retinotopic mapping is not explained) for comparison with the CI dipole location. The centroids of the fMRI activations (striate) were similar to the grand average dipole location for CI --- they were within approximately 8mm in three dimensions according to Tables 3 and 4. The average distance between the centroids of V1 and V2 from our annulus data is 10 mm (range 7–16 mm). For V1 and V3, the centroids differ by 17 mm (rang 9–25 mm). The error in the DiRusso et al measurements is such that it is fair to conclude that the source could be coming from V1, but is not sufficient to conclude that the source is not in V2. It should also be noted that the cortical folding pattern is such that the vertical meridian tends to lie on the crown of a gyrus, placing corresponding locations of V1 and V2 on the opposite banks of the gyrus, and thus close together in 3-D (Rajimehr and Tootell, 2009). While it is true that the locations recovered by Di Russo et al., are consistent with sources in V1, the analysis presented is not sufficient to conclude that CI was not also or even exclusively generated in V2 (or V3).
The cruciform model was proposed as an alternative to the inverse modeling approach to source localization. Since the time of its introduction, considerable progress on robust and accurate solutions to the electromagnetic inverse problem has been made. Several studies have successfully localized activity in human striate cortex (Moradi et al., 2003; Im et al., 2006; Sharon et al., 2007; Yoshioka et al., 2008; Ales et al., 2009; Hagler et al., 2009; Brookes et al., 2010). An advantage of the inverse modeling approach is that it can recover the full time-course of activity in a given cortical area. Studies that have worked within the cruciform framework have only found the polarity inversion signature for the initial activity. Only the polarity inverting activity is interpretable within the model, but it is clear that V1 continues to respond well after the latency of the CI or N75 polarity inverting components. We show here that the polarity inversion criterion is not a reliable method for localizing even the early portion of the V1 time course and that, as a consequence, inverse modeling approaches should be used instead.
Supplementary Material
Simulated topographies averaged over 12 participants in the study for 4 degree radius quadrants that activate the right hemisphere. A schematic of the simulated quadrant stimulus is shown on the far left. These data display a mirror reversed pattern in comparison to the right visual field/left hemisphere simulation shown in Figure 7.
Simulated topographies for 3–4 degree quarter-ring stimuli. This figure is plotted identically to Figure 7. The topographies in V1 do not full invert, but appear to rotate about 90 degrees, resulting in only a few locations showing polarity flips. While the V2 and V3 sources exhibit many places where voltages completely reverse polarity.
Simulated topographies averaged over 15 participants with large field retinotopic maps. A schematic of the simulated stimulus is shown on the far left. The same pattern as demonstrated by the other simulated source configurations are present. The topographies in V1 do not full invert, but appear to rotate about 90 degrees, resulting in only a few locations showing polarity flips. While the V2 and V3 sources exhibit many places where voltages completely reverse polarity.
Simulated topographies averaged over 12 participants in the study. A schematic of the simulated 4 degree radius quadrant stimulus is shown on the far left. This simulation was done using a 3-shell sphere for the forward modeling calculations. The scalp radius was 11 cm, the skull radius was 10.67 cm, and the brain radius was 9.9 cm. The scalp conductivity was .33 S/m, the skull conductivity was .0042 S/m, and the brain conductivity was .33 S/m. The same pattern as demonstrated using the BEM model Figure 7 appears when using a spherical model. The topographies in V1 do not full invert, but appear to rotate about 90 degrees, resulting in only a few locations showing polarity flips. While the V2 and V3 sources exhibit many places where voltages completely reverse polarity.
Acknowledgements
Supported by EY06579, EY018875-01S109, EY006883-24, the C.V. Starr Fellowship, and a Research to Prevent Blindness Walt and Lilly Disney Award for Amblyopia Research
Footnotes
Publisher's Disclaimer: This is a PDF file of an unedited manuscript that has been accepted for publication. As a service to our customers we are providing this early version of the manuscript. The manuscript will undergo copyediting, typesetting, and review of the resulting proof before it is published in its final citable form. Please note that during the production process errors may be discovered which could affect the content, and all legal disclaimers that apply to the journal pertain.
REFERENCES
- Ales J, Carney T, Klein SA. The folding fingerprint of visual cortex reveals the timing of human V1 and V2. Neuroimage. 2009 doi: 10.1016/j.neuroimage.2009.09.022. [DOI] [PMC free article] [PubMed] [Google Scholar]
- Brindley GS, Lewin WS. The visual sensations produced by electrical stimulation of the medial occipital cortex. J Physiol. 1968;194:54–55. [PubMed] [Google Scholar]
- Brookes MJ, Zumer JM, Stevenson CM, Hale JR, Barnes GR, Vrba J, Morris PG. Investigating spatial specificity and data averaging in MEG. Neuroimage. 2010;49:525–538. doi: 10.1016/j.neuroimage.2009.07.043. [DOI] [PMC free article] [PubMed] [Google Scholar]
- Dale AM, Fischl B, Sereno MI. Cortical surface-based analysis. I. Segmentation and surface reconstruction. Neuroimage. 1999;9:179–194. doi: 10.1006/nimg.1998.0395. [DOI] [PubMed] [Google Scholar]
- DeYoe EA, Carman GJ, Bandettini P, Glickman S, Wieser J, Cox R, Miller D, Neitz J. Mapping striate and extrastriate visual areas in human cerebral cortex. Proc Natl Acad Sci U S A. 1996;93:2382–2386. doi: 10.1073/pnas.93.6.2382. [DOI] [PMC free article] [PubMed] [Google Scholar]
- Di Russo F, Martinez A, Sereno MI, Pitzalis S, Hillyard SA. Cortical sources of the early components of the visual evoked potential. Hum Brain Mapp. 2002;15:95–111. doi: 10.1002/hbm.10010. [DOI] [PMC free article] [PubMed] [Google Scholar]
- Di Russo F, Pitzalis S, Spitoni G, Aprile T, Patria F, Spinelli D, Hillyard SA. Identification of the neural sources of the pattern-reversal VEP. Neuroimage. 2005;24:874–886. doi: 10.1016/j.neuroimage.2004.09.029. [DOI] [PubMed] [Google Scholar]
- Engel SA, Glover GH, Wandell BA. Retinotopic organization in human visual cortex and the spatial precision of functional MRI. Cereb Cortex. 1997;7:181–192. doi: 10.1093/cercor/7.2.181. [DOI] [PubMed] [Google Scholar]
- Foxe JJ, Simpson GV. Flow of activation from V1 to frontal cortex in humans. A framework for defining "early" visual processing. Exp Brain Res. 2002;142:139–150. doi: 10.1007/s00221-001-0906-7. [DOI] [PubMed] [Google Scholar]
- Hagler DJ, Jr, Halgren E, Martinez A, Huang M, Hillyard SA, Dale AM. Source estimates for MEG/EEG visual evoked responses constrained by multiple, retinotopically-mapped stimulus locations. Hum Brain Mapp. 2009;30:1290–1309. doi: 10.1002/hbm.20597. [DOI] [PMC free article] [PubMed] [Google Scholar]
- Halliday AM, Michael WF. Changes in pattern-evoked responses in man associated with the vertical and horizontal meridians of the visual field. J Physiol. 1970;208:499–513. doi: 10.1113/jphysiol.1970.sp009134. [DOI] [PMC free article] [PubMed] [Google Scholar]
- Hamalainen MS, Sarvas J. Realistic conductivity geometry model of the human head for interpretation of neuromagnetic data. IEEE Trans Biomed Eng. 1989;36:165–171. doi: 10.1109/10.16463. [DOI] [PubMed] [Google Scholar]
- Holmes G. The Ferrier Lecture: The organization of the visual cortex in man. Proc Roy Soc Lond Series B, Biological Sciences. 1945;132:348–361. [Google Scholar]
- Im CH, Gururajan A, Zhang N, Chen W, He B. Spatial resolution of EEG cortical source imaging revealed by localization of retinotopic organization in human primary visual cortex. J Neurosci Methods. 2006 doi: 10.1016/j.jneumeth.2006.10.008. [DOI] [PMC free article] [PubMed] [Google Scholar]
- James AC. The pattern-pulse multifocal visual evoked potential. Invest Ophthalmol Vis Sci. 2003;44:879–890. doi: 10.1167/iovs.02-0608. [DOI] [PubMed] [Google Scholar]
- Jeffreys DA. Cortical source locations of pattern-related visual evoked potentials recorded from the human scalp. Nature. 1971;229:502–504. doi: 10.1038/229502a0. [DOI] [PubMed] [Google Scholar]
- Jeffreys DA, Axford JG. Source locations of pattern-specific components of human visual evoked potentials. I. Component of striate cortical origin. Exp Brain Res. 1972a;16:1–21. doi: 10.1007/BF00233371. [DOI] [PubMed] [Google Scholar]
- Jeffreys DA, Axford JG. Source locations of pattern-specific components of human visual evoked potentials. II. Component of extrastriate cortical origin. Exp Brain Res. 1972b;16:22–40. doi: 10.1007/BF00233372. [DOI] [PubMed] [Google Scholar]
- Michael WF, Halliday AM. The topography of occipital responses evoked by pattern-reversal in different areas of the visual field. Vision Res. 1971a;11:1202–1203. doi: 10.1016/0042-6989(71)90146-5. [DOI] [PubMed] [Google Scholar]
- Michael Wf, Halliday AM. Differences between the occipital distribution of upper and lower field pattern-evoked responses in man. Brain Res. 1971b;32:311–324. doi: 10.1016/0006-8993(71)90327-1. [DOI] [PubMed] [Google Scholar]
- Moradi F, Liu LC, Cheng K, Waggoner RA, Tanaka K, Ioannides AA. Consistent and precise localization of brain activity in human primary visual cortex by MEG and fMRI. Neuroimage. 2003;18:595–609. doi: 10.1016/s1053-8119(02)00053-8. [DOI] [PubMed] [Google Scholar]
- Onofrj M, Fulgente T, Thomas A, Malatesta G, Peresson M, Locatelli T, Martinelli V, Comi G. Source model and scalp topography of pattern reversal visual evoked potentials to altitudinal stimuli suggest that infoldings of calcarine fissure are not part of VEP generators. Brain Topogr. 1995;7:217–231. doi: 10.1007/BF01202381. [DOI] [PubMed] [Google Scholar]
- Rajimehr R, Tootell RB. Does retinotopy influence cortical folding in primate visual cortex? J Neurosci. 2009;29:11149–11152. doi: 10.1523/JNEUROSCI.1835-09.2009. [DOI] [PMC free article] [PubMed] [Google Scholar]
- Sereno MI, Dale AM, Reppas JB, Kwong KK, Belliveau JW, Brady TJ, Rosen BR, Tootell RB. Borders of multiple visual areas in humans revealed by functional magnetic resonance imaging. Science. 1995;268:889–893. doi: 10.1126/science.7754376. [DOI] [PubMed] [Google Scholar]
- Sharon D, H‰m‰l‰inen MS, Tootell RBH, Halgren E, Belliveau JW. The advantage of combining MEG and EEG: Comparison to fMRI in focally stimulated visual cortex. Neuroimage. 2007;36:1225–1235. doi: 10.1016/j.neuroimage.2007.03.066. [DOI] [PMC free article] [PubMed] [Google Scholar]
- Slotnick SD, Klein SA, Carney T, Sutter E, Dastmalchi S. Using multi-stimulus VEP source localization to obtain a retinotopic map of human primary visual cortex. Clin Neurophysiol. 1999;110:1793–1800. doi: 10.1016/s1388-2457(99)00135-2. [DOI] [PubMed] [Google Scholar]
- Smith SM. Fast robust automated brain extraction. Hum Brain Mapp. 2002;17:143–155. doi: 10.1002/hbm.10062. [DOI] [PMC free article] [PubMed] [Google Scholar]
- Tabuchi H, Yokoyama T, Shimogawara M, Shiraki K, Nagasaka E, Miki T. Study of the visual evoked magnetic field with the m-sequence technique. Invest Ophthalmol Vis Sci. 2002;43:2045–2054. [PubMed] [Google Scholar]
- Wade AR, Brewer AA, Rieger JW, Wandell BA. Functional measurements of human ventral occipital cortex: retinotopy and colour. Philos Trans R Soc Lond B Biol Sci. 2002;357:963–973. doi: 10.1098/rstb.2002.1108. [DOI] [PMC free article] [PubMed] [Google Scholar]
- Yoshioka T, Toyama K, Kawato M, Yamashita O, Nishina S, Yamagishi N, Sato MA. Evaluation of hierarchical Bayesian method through retinotopic brain activities reconstruction from fMRI and MEG signals. Neuroimage. 2008;42:1397–1413. doi: 10.1016/j.neuroimage.2008.06.013. [DOI] [PubMed] [Google Scholar]
- Zhang X, Hood DC. A principal component analysis of multifocal pattern reversal VEP. J Vis. 2004;4:32–43. doi: 10.1167/4.1.4. [DOI] [PubMed] [Google Scholar]
Associated Data
This section collects any data citations, data availability statements, or supplementary materials included in this article.
Supplementary Materials
Simulated topographies averaged over 12 participants in the study for 4 degree radius quadrants that activate the right hemisphere. A schematic of the simulated quadrant stimulus is shown on the far left. These data display a mirror reversed pattern in comparison to the right visual field/left hemisphere simulation shown in Figure 7.
Simulated topographies for 3–4 degree quarter-ring stimuli. This figure is plotted identically to Figure 7. The topographies in V1 do not full invert, but appear to rotate about 90 degrees, resulting in only a few locations showing polarity flips. While the V2 and V3 sources exhibit many places where voltages completely reverse polarity.
Simulated topographies averaged over 15 participants with large field retinotopic maps. A schematic of the simulated stimulus is shown on the far left. The same pattern as demonstrated by the other simulated source configurations are present. The topographies in V1 do not full invert, but appear to rotate about 90 degrees, resulting in only a few locations showing polarity flips. While the V2 and V3 sources exhibit many places where voltages completely reverse polarity.
Simulated topographies averaged over 12 participants in the study. A schematic of the simulated 4 degree radius quadrant stimulus is shown on the far left. This simulation was done using a 3-shell sphere for the forward modeling calculations. The scalp radius was 11 cm, the skull radius was 10.67 cm, and the brain radius was 9.9 cm. The scalp conductivity was .33 S/m, the skull conductivity was .0042 S/m, and the brain conductivity was .33 S/m. The same pattern as demonstrated using the BEM model Figure 7 appears when using a spherical model. The topographies in V1 do not full invert, but appear to rotate about 90 degrees, resulting in only a few locations showing polarity flips. While the V2 and V3 sources exhibit many places where voltages completely reverse polarity.


