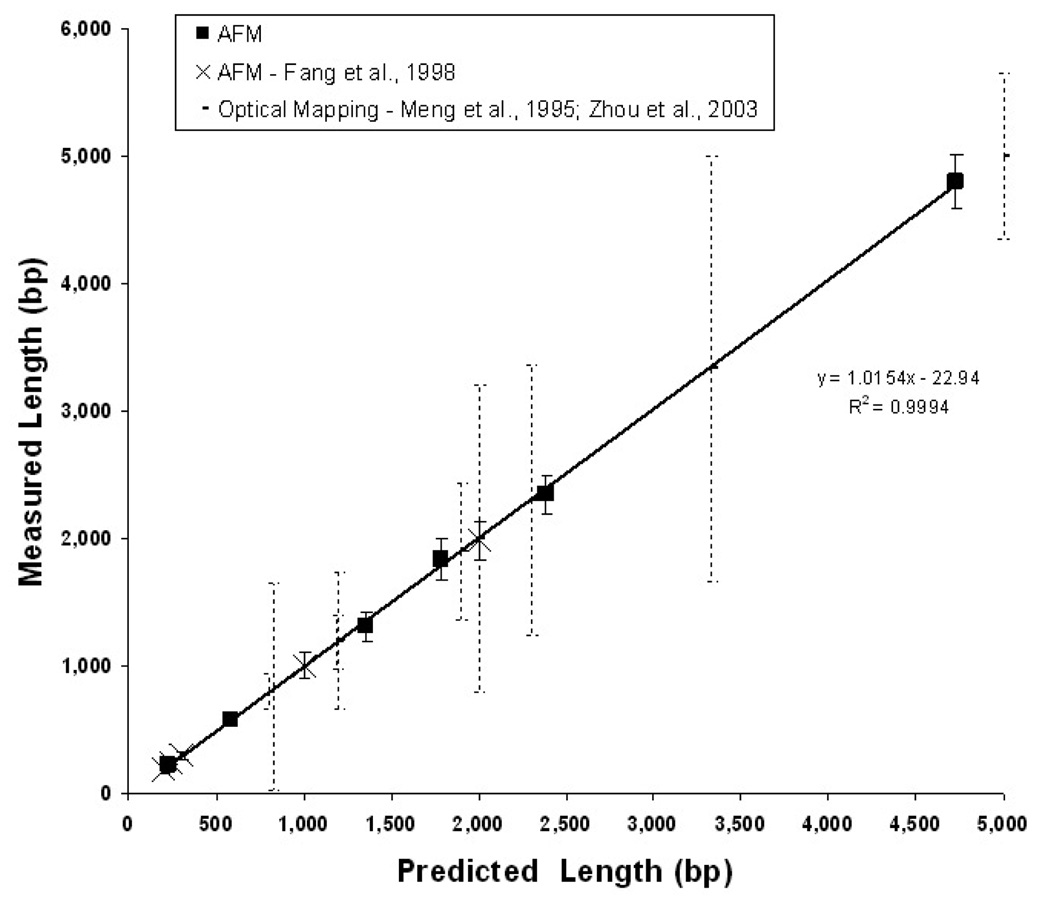
Figure 5.
AFM sizing of surface fixed, double-stranded DNA. The mean length in bp for pools of six different linear DNA molecules are plotted as dark squares (n = 10–40 molecules). Backbone contour length in nanometres is converted to bp using the nominal pitch of duplex beta DNA (0.33 nm/bp) [189]. Fragments range in size from 230 to 4731 bp (90–1561 nm). Error bars represent sample standard deviation. The x-axis is the length predicted from the sequence and the y-axis is the contour length as measured with AFM. A linear regression of the measurements is displayed. These measurements are consistent with those of Fang et al [189] who used a similar AFM sizing method (white circles). To illustrate the relative precision of this technique, we include data from a distinct optical single molecule sizing method (broken vertical lines; [156, 159, 162, 163].

