Abstract
One of the most popular methods to prepare tryptic peptides for bottom-up proteomic analysis is in-gel digestion. To date, there have been few studies comparing various digestion methods. In this study, we compare the efficiency of several popular in-gel digestion methods, along with new technologies that may improve digestion efficiency, using a human epidermoid carcinoma cell lysate protein standard. The efficiency of each protocol was based on the average number of proteins identified and their respective sequence coverage and relative quantitation using spectral counting. The importance of this study lies in its comparison of pre-existing in-gel digestion methods with those that use newly developed technologies that may introduce the potential for a more cost-effective digestion, higher protein yield, and an overall reduction in processing time. The following four protocols were compared: an overnight in-gel digestion protocol; an overnight in-gel digestion protocol, in which we remove the vacuum centrifugation steps; in-gel digestion in a barometric pressure cycler; and in-gel digestion in a scientific microwave. Several variables were tested for increased digestion efficiency and decreased keratin contamination. Statistical analysis was performed on replicate samples to determine significant differences between protocols.
Keywords: mass spectrometry, proteomics
INTRODUCTION
The field of proteomics has used tandem mass spectrometry (MS/MS) coupled with liquid chromatography (LC) for many years to characterize large sets of proteins in complex matrices.1 One way of doing this is bottom-up proteomics, whereby a proteolytic digestion of the proteins is performed prior to MS/MS analysis.2 Information about the proteins, such as the identification, post-translation modification discovery, and relative abundance, is then inferred, based on the MS/MS data.3
Trypsin is the most widely used endopeptidase for proteolytic digestion because of its high stability and cleavage specificity, which produce peptides that are the ideal size for MS/MS analysis.4 Two of the most widely used tryptic digestion approaches are in-gel digestion and in-solution digestion. In an in-gel digestion, proteins are run on a one-dimensional (1D) or 2D gel to separate the proteins. Gel bands are excised and then digested with trypsin.5 In an in-solution digestion, proteins are digested directly in specific buffers and/or solvents such as ammonium bicarbonate (AmBic) or acetonitrile (ACN).6
One of the main advantages of using an in-gel digestion is that it allows removal of any compounds that could be potentially harmful to mass spectrometers, such as detergents and salts.5 One of the major disadvantages of using an in-gel digestion is the loss of peptides during the in-gel digestion, especially during extraction steps, where some peptides may still be trapped within the gel matrix.5,7 Another disadvantage of an in-gel digestion is the amount of time it takes to complete most protocols, which directly increases the costs of performing an in-gel digestion.7 New technologies, such as scientific microwaves and barometric pressure cyclers, may help alleviate many of these problems.4,8,9 These new technologies have the potential to reduce significantly the amount of time required to perform the digest, which may increase throughput and save money.
To our knowledge, a comprehensive study of in-gel digestions using these new technologies has not been described in the literature. In this study, we compared a traditional Overnight digest against Microwave and pressure-assisted digests. We also compared the use of a modified trypsin with the use of an unmodified trypsin.
MATERIALS AND METHODS
Sample Preparation
A human epidermoid carcinoma cell lysate protein standard (10 μg; Santa Cruz Biotechnology, Santa Cruz, CA, USA) was run on a gel for 25 min, creating a gel blob that was approximately 2 cm long. The gel blob was fixed and stained overnight with Imperial Protein Stain (Thermo Fisher, San Jose, CA, USA) and destained with deionized water. The gel blobs were then cut into 1 mm cubes and placed into 1.5 mL microcentrifuge tubes. The gel pieces were digested and extracted according to one of a number of digestion methods using a modified sequencing-grade trypsin (Promega BioSciences, San Luis Obispo, CA, USA) or an unmodified trypsin (Wako Pure Chemical Industries, Chuo-ku, Osaka, Japan). Four replicates of each digestion method were conducted. Each digestion method was labeled with a specific color.
Digestion and Extraction Methods
Barocycler Digestion and Extraction Methods (Yellow)
The barometric pressure cycler used in this study was the Barocycler NEP 2320 (Pressure Biosciences, Boston, MA, USA). The entire process took place in a 150-μL Pressure Cycling Technology (PCT) Tube and Cap.
Digestion: Each cycle of the Barocycler digestion method increases the pressure to 20,000 pounds/square inch (PSI) for 50 s and then decreases the pressure to atmospheric pressure for 10 s. The entire digestion method, which takes about 40 min, consists of 40 cycles at 50°C. Each cycle of the Barocycler reduction/alkylation method increases the pressure to 20,000 PSI for 50 s and then decreases the pressure to atmospheric pressure for 10 s. The entire reduction/alkylation method, which takes about 20 min, consists of 20 cycles at 50°C.
Extraction: Each cycle of the Barocycler extraction method increases the pressure to 35,000 PSI for 10 s and then decreases the pressure to atmospheric pressure for 10 s. The entire extraction method, which takes about 10 min, consists of 10 cycles at 50°C. To control for the pressure imparted by the Barocycler, the reduction, alkylation, digestion, and extraction steps occurred in the nonpressurized water bath of the Barocycler at 50°C (Beige Group).
Microwave Digestion and Extraction Methods (Orange)
The scientific microwave used in this study was the CEM Discover (CEM, Mathews, NC, USA). The Microwave methods used the same method for the reduction, alkylation, digestion, and extraction steps. During the entire method, the temperature is monitored by a fiber-optic probe and held constant at 50°C. During the first cycle, the microwave power is held at 50 watts for 2 min and 30 s. During the second cycle, the microwave power is decreased to 1 watt for 10 min. During the third and final cycle, the temperature is decreased to room temperature for 20 min.
Overnight in-gel Digestion and Extraction Methods (Green)
In-gel reduction, alkylation, and tryptic digestion were similar to protocols published previously.5,10,11
Digestion: The gel pieces were washed twice with 50 mM AmBic, chemically dried twice using 100% ACN, and then mechanically dried using vacuum centrifugation. The gel pieces were reduced using 10 mM DTT in 100 mM AmBic at 56°C for 30 min. The gel pieces were then alkylated using 55 mM iodoacetamide in 100 mM AmBic at room temperature for 30 min in the dark. The gel pieces were washed twice with 50 mM AmBic, chemically dried twice using 100% ACN, and then mechanically dried using vacuum centrifugation. Finally, 500 ng trypsin in 50 mM AmBic was added and incubated overnight at 37°C.
Extraction: The supernatant was collected and put in a new tube. Next, 60% ACN with 0.1% trifluoroacetic acid (TFA) was added to the gel pieces, which were sonicated for 10 min and centrifuged for 8 min, and the supernatant was added to the supernatant collected previously. The supernatant was vacuum-centrifuged.
Modifications
The following modifications were made to the protocols described previously:
Beige Group
The Barocycler digestion and extraction methods were followed. All steps were performed in the nonpressurized water bath at 50°C rather than the pressurized chamber.
Blue Group
The Overnight in-gel digestion method was followed with one exception: the gel pieces were placed in the incubator overnight in a capped PCT microtube inside of a 1.5-mL tube with 1 mL water to encourage a more uniform temperature. The extraction step was performed in the Barocycler.
Cyan Group
The Overnight in-gel digestion method and the Barocycler extraction method were followed. All vacuum centrifugation steps were removed, and 40% ACN with 0.1% TFA was used for extraction. The samples were diluted to 5% ACN prior to loading on the mass spectrometer.
Magenta Group
The Overnight in-gel digestion method was followed until the digestion step, which took place in the Barocycler. The Overnight in-gel extraction method was used.
Pink Group
The Barocycler digestion method was followed until the digestion step, which took place in the incubator at 37°C overnight. The Barocycler extraction method was used.
Purple Group
The Overnight in-gel digestion method was followed until the digestion step, which took place in the microwave. The Overnight in-gel extraction method was used.
Red Group
The Microwave digestion method was followed until the digestion step, which took place in the incubator at 37°C overnight. The Microwave extraction method was used.
Rust Group
The Overnight in-gel digestion and extraction methods were followed. All vacuum centrifugation steps were removed, and 40% ACN with 0.1% TFA was used for extraction. The samples were diluted to 5% ACN prior to loading on the mass spectrometer.
LC-MS/MS Methods
A paradigm MG4 HPLC system (Michrom Bioresources, Auburn, CA, USA), coupled to a Thermo Finnigan LTQ ion trap mass spectrometer (Thermo Fisher) through a Michrom advance captive spray ionization source, was used for peptide separation and analysis. Each digested sample (10 μg) was loaded onto a trap column (Zorbax300SB-C18, 5 μm, 5×0.3 mm, Agilent Technologies, Santa Clara, CA, USA) and desalted online. Peptides were then eluted from the trap, separated on a reverse-phase Michrom Magic C18AQ (200 μm×150 mm) capillary column at a flow rate of 2 μL/min. Peptides were eluted using a 90-min gradient of 2% B–35% B over 60 min and 35% B–80% B for 3 min, held at 80% B for 2 min and 80% B–5% B in 1 min, and re-equilibrated for 8 min at 5% B (A=0.1% formic acid; B=100% ACN) and sprayed directly into the mass spectrometer, which was operated with a spray voltage of 1.8 kV, a heated capillary temperature of 180°C, and a full scan range of 350–1400 mass-to-charge ratio. Data-dependent MS/MS spectra were collected with the following parameters: 10 MS/MS spectra for the most intense ions from the full scan (minimum signal required=500.0, isolation width=2.0) with 35% collision energy for collision-induced dissociation. Dynamic exclusion of the same abundant peptides was enabled with a repeat count of 2 and an exclusion duration of 1 min.
Data Analysis
Database Searching
All MS/MS samples were analyzed using X! Tandem [Version TORNADO (2008.02.01.2)]. X! Tandem was set up to search the Human Ensembl Database (47,648 entries), assuming the digestion enzyme trypsin. X! Tandem was searched with a fragment ion mass tolerance of 0.40 Da and a parent ion tolerance of 1.8 Da. The iodoacetamide derivative of cysteine was specified in X! Tandem as a fixed modification. Deamidation of asparagine, oxidation of methionine, sulphone of methionine, tryptophan oxidation to formylkynurenin of tryptophan, and acetylation of the N-terminus were specified in X! Tandem as variable modifications.
Criteria for Protein Identification
Scaffold (Version Scaffold_2_05_00, Proteome Software Inc., Portland, OR, USA) was used to validate MS/MS-based peptide and protein identifications. Peptide identifications were accepted if they could be established at >80.0% probability, as specified by the peptide prophet algorithm.12 Protein identifications were accepted if they could be established at >80.0% probability and contained at least two identified peptides. Protein probabilities were assigned by the protein prophet algorithm.13 Proteins that contained similar peptides and could not be differentiated based on MS/MS analysis alone were grouped to satisfy the principles of parsimony.
RESULTS
To make a fair comparison between digestion methods, care was taken to control all variables other than the digestions method themselves. Before each batch of samples was analyzed, 125 fmol of a BSA digest was analyzed by LC-MS/MS and scored using X! Tandem [minimum log(e) score of –500] to attempt to account for analytical variation. Two replicates, one from the orange-unmodified trypsin group and one from the rust-modified trypsin group, were removed from the sample pool, as they were outside of the mean by at least 6 sd (the groups that contain the removed samples are indicated in all figures using an asterisk). We used Scaffold to perform label-free quantitative analyses using an ANOVA (P value <0.05) to determine which proteins were differentially expressed across all of the digestion protocols. All of the LC-MS/MS samples were analyzed using X! Tandem, and Scaffold was used to validate the MS/MS spectra. Peptide identifications were accepted if they could be established at >80.0% probability, and protein identifications were accepted if they could be established at >80.0% probability and contained at least two identified peptides. A two-tailed, homoscedastic, Student's t test was used to test our hypotheses. We chose a P value of <0.05 to determine significance.
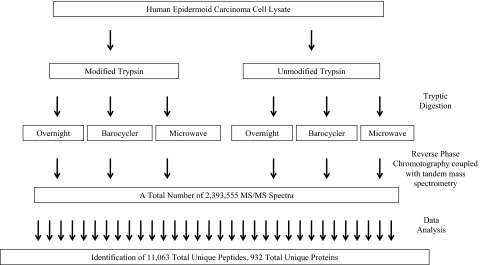
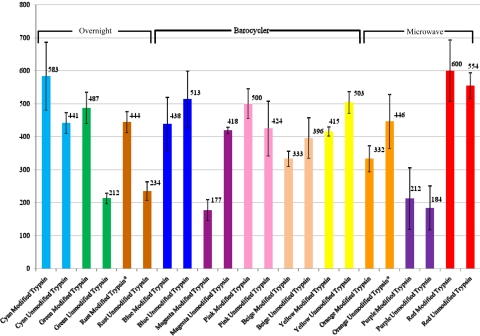
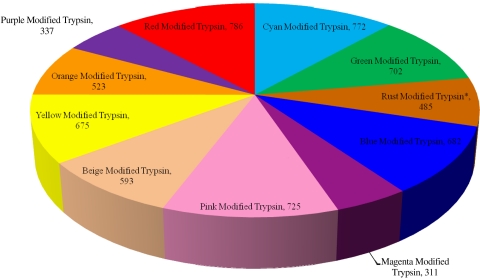
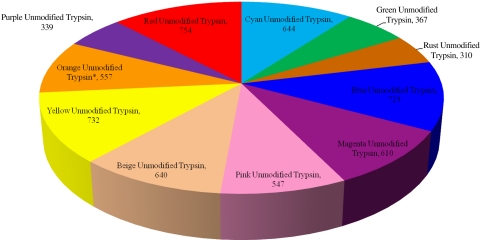
We acquired 2,393,555 total MS/MS spectra to identify 11,063 total unique peptides (191,928 total MS/MS spectra were used for identification) across all samples (Fig. 1). The average number of protein identifications for each digestion group using the modified trypsin is as follows (Fig. 2, Table 1): Cyan 583, Green 487, Rust 444, Blue 438, Magenta 177, Pink 500, Beige 333, Yellow 415, Orange 332, Purple 212, and Red 600. The average number of protein identifications for each digestion group using the unmodified trypsin is as follows: Cyan 441, Green 212, Rust 234, Blue 513, Magenta 418, Pink 424, Beige 396, Yellow 503, Orange 446, Purple 184, and Red 554. The total number of unique proteins identified in each protocol using the modified trypsin is as follows (Fig. 3, Table 2): Cyan 772, Green 702, Rust 485, Blue 682, Magenta 311, Pink 725, Beige 593, Yellow 675, Orange 523, Purple 337, and Red 786. The total number of unique proteins identified in each protocol using the unmodified trypsin is as follows (Fig. 4): Cyan 644, Green 367, Rust 310, Blue 723, Magenta 610, Pink 547, Beige 640, Yellow 732, Orange 557, Purple 339, and Red 754.
FIGURE 1.
Workflow. This flowchart illustrates the entire sample analysis workflow from start to finish. A human epidermoid carcinoma cell lysate (10 μg) was digested using various in-gel digestion procedures and technologies. The resulting peptides were then analyzed using reverse-phase chromatography coupled with MS/MS. All resulting spectra were then searched against a human protein sequences database using the X! Tandem algorithm for peptide identification.
FIGURE 2.
Average number of proteins identified. This bar graph illustrates the average number of protein identification for all four replicates across all 22 protocols. The error bars in this figure represent plus and minus 1 sd from the mean. Replicates that were outside of 6 SD were removed and their respective groups have been marked with an asterisk.
TABLE 1.
Characterization of each digestion group using the modified trypsin
| Digestion method | Average number of protein identifications (IDs) | Total number of unique protein IDs | Average number of keratin spectral counts | Number of replicates (n) |
|---|---|---|---|---|
| Cyan | 583 | 772 | 193 | 4 |
| Green | 487 | 703 | 89 | 4 |
| Rust | 444 | 485 | 203 | 3 |
| Blue | 438 | 682 | 157 | 4 |
| Magenta | 177 | 311 | 28 | 4 |
| Pink | 500 | 725 | 114 | 4 |
| Beige | 333 | 593 | 137 | 4 |
| Yellow | 415 | 675 | 115 | 4 |
| Orange | 332 | 523 | 89 | 4 |
| Purple | 212 | 337 | 67 | 4 |
| Red | 600 | 786 | 140 | 4 |
FIGURE 3.
Total number of unique proteins identified per protocol using the modified trypsin. This pie chart illustrates the total number of unique proteins identified in each protocol using the modified trypsin. Replicates that were outside of 6 SD were removed and their respective groups have been marked with an asterisk.
TABLE 2.
Characterization of each digestion group using the unmodified trypsin
| Digestion method | Average number of protein IDs | Total number of unique protein IDs | Average number of keratin spectral counts | Number of replicates (n) |
|---|---|---|---|---|
| Cyan | 441 | 664 | 128 | 4 |
| Green | 212 | 367 | 41 | 4 |
| Rust | 234 | 310 | 51 | 4 |
| Blue | 513 | 723 | 110 | 4 |
| Magenta | 418 | 610 | 92 | 4 |
| Pink | 424 | 547 | 107 | 4 |
| Beige | 396 | 640 | 168 | 4 |
| Yellow | 503 | 732 | 178 | 4 |
| Orange | 446 | 557 | 127 | 3 |
| Purple | 184 | 339 | 55 | 4 |
| Red | 554 | 754 | 163 | 4 |
FIGURE 4.
Total number of unique proteins identified per protocol using the unmodified trypsin. This pie chart illustrates the total number of unique proteins identified in each protocol using the unmodified trypsin. Replicates that were outside of 6 SD were removed and their respective groups have been marked with an asterisk.
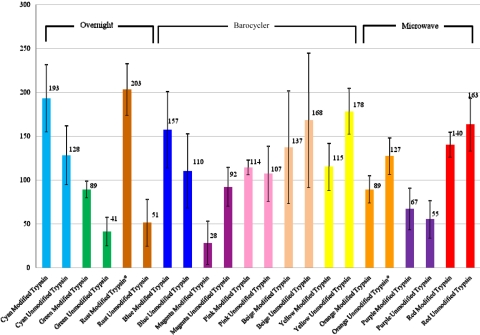
We identified 19 different keratin proteins across all of the samples. The average number of keratin spectral counts for each digestion group using the modified trypsin is as follows (Fig. 5): Cyan 193, Green 89, Rust 203, Blue 157, Magenta 28, Pink 114, Beige 137, Yellow 115, Orange 89, Purple 67, and Red 140. The average number of keratin spectral counts for each digestion group using the unmodified trypsin is as follows: Cyan 128, Green 41, Rust 51, Blue 110, Magenta 92, Pink 107, Beige 168, Yellow 178, Orange 127, Purple 55, and Red 163.
FIGURE 5.
Average number of keratin spectral counts. This bar graph illustrates the average number of Keratin spectral counts for all four replicates, across all 22 protocols. The error bars in this figure represent ±1 sd from the mean. Replicates that were outside of 6 SD were removed and their respective groups have been marked with an asterisk.
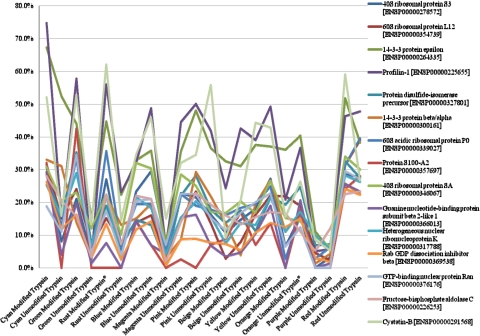
After using Scaffold to perform our quantitative analysis using an ANOVA (P<0.05) to determine the differentially expressed proteins across all of the digestion protocols, we randomly chose 15 of the top 45 differentially expressed proteins (keratins were excluded) and plotted their respective sequence coverage (Fig. 6). All of the differentially expressed proteins chosen exhibited an ANOVA P value <0.0000000001.
FIGURE 6.
Average sequence coverage of 15 differentially expressed proteins. This line graph illustrates the average sequence coverage of 15 differentially expressed proteins with a P value > 0.000000001 for all four replicates across all protocols. Replicates that were outside of 6 SD were removed and their respective groups have been marked with an asterisk.
DISCUSSION
Prior to our experiment, our hypothesis was that the protocols that used a short digestion (i.e., the Barocycler and the Microwave) would yield a more efficient digest if the unmodified trypsin were used. Our data support this hypothesis for the Barocycler digestion method [Magenta Group; an average of 177 proteins identified using the modified trypsin and an average of 418 proteins identified using the unmodified trypsin (Fig. 2); t test P value of 0.0066] but not for the Microwave digestion method [Purple Group; an average of 212 proteins identified using the modified trypsin and an average of 184 proteins identified using the unmodified trypsin (Fig. 2); t test P value of 0.4272]. We also hypothesized that the Overnight digestion method (Green Group) using the unmodified trypsin would yield a less-efficient digest. Our data also supported this hypothesis [modified trypsin had an average number of 487 proteins identified, and the unmodified trypsin had an average number of 212 proteins identified (Fig. 2); t test P value of 0.00002].
There was no significant difference between the standard Overnight digestion (Green Group) using the modified trypsin (average number of 487 proteins identified) and the protocol in which the digestion took place in the Barocycler (Magenta Group) using the unmodified trypsin [average number of 418 proteins identified (Fig. 2); t test P value of 0.1915]. There was a significant difference between the protocol in which only the digestion took place in the Microwave (Purple Group) using the unmodified trypsin [average number of 184 proteins identified (Fig. 2)] and both the standard Overnight digestion (t test P value of 0.0001) and the digestion that took place in the Barocycler (t test P value of 0.0046). As there is an insignificant increase between the number of proteins identified using the standard Overnight digestion (Green Group) using the modified trypsin and the Barocycler (Magenta Group) using the unmodified trypsin (t test P value of 0.1915), it may be more beneficial to perform the digestion in the Barocycler as a result of the amount of time saved.
There was no significant increase in the number of proteins identified when the extraction protocol was varied, while the digestion parameters were held constant. The standard Overnight extraction (Green Group) using the modified trypsin yielded an average number of 487 proteins identified, and the protocol in which the extraction took place in the Barocycler (Blue Group) yielded 438 proteins identified using the modified trypsin (Fig. 2; t test P value of 0.4008). There was also no significant increase in the number of proteins identified when the vacuum centrifugation steps were removed from the standard Overnight digestion. The standard Overnight digestion (Green Group) with the modified trypsin yielded an average number of 487 proteins identified, and the standard Overnight digestion using the modified trypsin with the vacuum centrifugation steps removed (Rust Group) yielded an average number of 444 proteins identified (Fig. 2; t test P value of 0.1765). Surprisingly, there was a significant increase in the number of keratin spectra identified in the standard Overnight digestion without the vacuum centrifugation (Rust Group) using the modified trypsin (203), as opposed to the standard Overnight digestion (Green Group) with the modified trypsin (89; Fig. 5; t test P value of 0.0007). This comes as a surprise, as our postulation prior to this experiment was that the vacuum centrifuge presented the greatest source of keratin contamination during our sample preparation.
There was a significant increase in the number of proteins identified when the entire process was carried out in the pressurized chamber in the Barocycler as opposed to the nonpressurized water bath. The Barocycler digestion (Yellow Group) with the unmodified trypsin yielded an average number of 503 proteins identified, and the digestion with the unmodified trypsin, which took place in the water bath at 50°C (Beige Group), yielded an average number of 396 proteins identified (Fig. 2; t test P value of 0.0334). The data show that this increase in the digestion efficiency is most likely a result of the increased pressure rather than the increased temperature.
The protocol that yielded the highest number of proteins on average was the protocol in which the reduction/alkylation and extraction steps took place in the microwave, but the digestion itself took place in an incubator overnight (Red Group). This was the case for the modified and unmodified trypsins [600 and 554 proteins identified, respectively (Fig. 2)]. We have no apparent explanation of why this would be the case.
The data generated in this study support that pressure cycling and Microwave technologies can result in significant differences between the number of proteins identified compared with traditional in-gel digestion techniques when analyzing complex mixtures of proteins. In this study, however, they did not significantly out-perform traditional Overnight in-gel digestion.
In the future, it may be useful to replicate this experiment using complex mixtures of protein in solution rather than in gels. It would also be useful to compare these technologies on the digestion of membrane proteins only, as anecdotal observations have indicated that technologies such as the Barocycler and Microwave may improve their digestion efficiency. Future studies are planned that will address these hypotheses. In addition, caution should be taken in globalizing these results to other types of proteomics samples that may be dissimilar to the one used in this study.
ACKNOWLEDGMENTS
The authors gratefully acknowledge Thermo Fisher and Pressure Biosciences for their assistance and support. This work was financially supported by the UC Davis Genome Center.
Footnotes
Supplemental data: the complete dataset for this project, including all of the raw mass spectrometry files, mzXML files, and Scaffold file, can be downloaded from the Tranche proteomics data repository (https://proteomecommons.org/) using the following hash: G/ ctR9iCIeHgvbiQ6qQgf+EQNUePWDQ1iwttqjXXMT14Dl8drunjq 2BDH/QuX1i9y4fWNqXoL7BxPE0gEVPeO6ZRXKwAAAAAAA Cs4g==). Pass phrase for the Supplemental data: emFqtBu5eq 44LCUms49x.
REFERENCES
- 1.Gygi S. Quantitative analysis of complex protein mixtures using isotope-coded affinity tags. Nat Biotechnol 1999;17:994–999 [DOI] [PubMed] [Google Scholar]
- 2.Strader MB, Verberkmoes NC, Tabb DL, et al. Characterization of the 70S ribosome from Rhodopseudomonas palustris using an integrated “top-down” and “bottom-up” mass spectrometric approach. J Proteome Res 2004;3:965–978 [DOI] [PubMed] [Google Scholar]
- 3.Nesvizhskii AI, Vitek O, Aebersold R. Analysis and validation of proteomic data generated by tandem mass spectrometry. Nat Meth 2007;4:787–797 [DOI] [PubMed] [Google Scholar]
- 4.Sun W, Gao S, Wang L, et al. Microwave-assisted protein preparation and enzymatic digestion in proteomics. Mol Cell Proteomics 2006;5:769–776 [DOI] [PubMed] [Google Scholar]
- 5.Rosenfeld J, Capdevielle J, Guillemot JC, Ferrara P. In-gel digestion of proteins for internal sequence analysis after one- or two-dimensional gel electrophoresis. Anal Biochem 1992;203:173–179 [DOI] [PubMed] [Google Scholar]
- 6.Stone KL, Williams KR. Enzymatic digestion of proteins in solution and in SDS polyacrylamide gels. The Protein Protocols Handbook. 1996;415–425 [Google Scholar]
- 7.Park Z-Y, Russell DH. Identification of individual proteins in complex protein mixtures by high-resolution, high-mass-accuracy MALDI TOF-mass spectrometry analysis of in-solution thermal denaturation/enzymatic digestion. Anal Chem 2001;73:2558–2564 [DOI] [PubMed] [Google Scholar]
- 8.Chen S-T, Chiou S-H, Wang K-T. Enhancement of chemical reactions by microwave irradiation. J Chin Chem Soc 1991;38:85–91 [Google Scholar]
- 9.Juan HF, Chang SC, Huang HC, Chen ST. A new application of microwave technology to proteomics. Proteomics 2005;5:840–842 [DOI] [PubMed] [Google Scholar]
- 10.Wilm M, Shevchenko A, Houthaeve T, et al. Femtomole sequencing of proteins from polyacrylamide gels by nano-electrospray mass spectrometry. Nature 1996;379:466–469 [DOI] [PubMed] [Google Scholar]
- 11.Hellman U, Wernstedt C, Góñez J, Heldin CH. Improvement of an “in-gel” digestion procedure for the micropreparation of internal protein fragments for amino acid sequencing. Anal Biochem 1995:224:451–455 [DOI] [PubMed] [Google Scholar]
- 12.Keller A, Nesvizhskii AI, Kolker E, Aebersold R. Empirical statistical model to estimate the accuracy of peptide identifications made by MS/MS and database search. Anal Chem 2002;74:5383–5392 [DOI] [PubMed] [Google Scholar]
- 13.Nesvizhskii AI, Keller A, Kolker E, Aebersold R. A statistical model for identifying proteins by tandem mass spectrometry. Anal Chem 2003;75:4646–4658 [DOI] [PubMed] [Google Scholar]


