

Abstract
Pancreatic β-cells and HIT-T15 cells exhibit oscillations of cytosolic calcium ([Ca2+]i) that are dependent on glucose metabolism and appear to trigger pulsatile insulin secretion. Significantly, differences in the pattern of this [Ca2+]i oscillatory activity may have important implications for our understanding of how glucose homeostasis is achieved during the feeding and fasting states. When single β-cells are exposed to a stepwise increase in glucose concentration that mimics the transition from fasting to feeding states, fast irregular oscillations of [Ca2+]i are observed. Alternatively, when single β-cells are equilibrated in a steady state concentration of glucose that mimics the fasting state, slow periodic oscillations of [Ca2+]i are noted. Here we report a fundamental difference in the mechanism by which glucose induces these two types of [Ca2+]i oscillatory activity. In agreement with previous studies, we substantiate a role for L-type voltage-dependent Ca2+ channels as mediators of the fast oscillations of [Ca2+]i observed after a stepwise increase in glucose concentration. In marked contrast, we report that voltage-independent calcium channels (VICCs) mediate slow oscillations of [Ca2+]i that occur when β-cells are equilibrated in steady state concentrations of glucose. Slow [Ca2+]i oscillations are mediated by VICCs which are pharmacologically and biophysically distinguishable from voltage-dependent Ca2+ channels that mediate fast oscillations. Specifically, slow [Ca2+]i oscillations are blocked by extracellular La3+, but not by nifedipine, and are independent of changes in membrane potential. Measurements of membrane conductance also indicate an important role for VICCs, as demonstrated by a steady state inward Ca2+ current that is blocked by La3+. The steady state Ca2+ current appears to generate slow [Ca2+]i oscillations by triggering Ca2+-induced Ca2+ release from intracellular Ca2+ stores, a process that is mimicked by extracellular application of caffeine, a sensitizer of the ryanodine receptor/Ca2+ release channel. Depletion of intracellular Ca2+ stores with thapsigargin stimulated Mn2+ influx, suggesting the presence of Ca2+-release-activated Ca2+ channels. Taken together, these observations are consistent with a role for VICCs (possibly G-type channels) and/or Ca2+-release-activated Ca2+ channels as mediators of slow [Ca2+]i oscillations in β-cells. We propose that slow oscillations of [Ca2+]i probably serve as important initiators of insulin secretion under conditions in which tight control of glucose homeostasis is necessary, as is the case during the fasting normoglycemic state.
A rise in the cytosolic free Ca2+ concentration ([Ca2+]i) is the critical signaling messenger that triggers exocytosis in many types of secretory cells. In pancreatic β-cells, insulin secretion is stimulated markedly during feeding by a combination of glucose- and incretin hormone-derived signals [e.g. glucagon-like peptide-1 (GLP-1)] acting in a synergistic fashion (1). Although the exact mechanism by which insulin secretion occurs has yet to be fully elucidated, it is generally recognized that the postprandial rise in blood glucose is a causative factor. Exposure of β-cells to a stepwise increase in glucose concentration (typically from 5 to 20 mM) results in the closing of ATP-sensitive potassium channels, membrane depolarization, the opening of voltage-dependent Ca2+ channels (VDCCs), and a subsequent rise in [Ca2+]i characterized by fast oscillatory behavior. Various mechanisms have been proposed to explain the generation of these glucose-induced [Ca2+]i fluctuations at the single cell level, including oscillations of glucose metabolism (2), inositol 1,4,5-trisphosphate production (3), cyclical periods of Ca2+-induced Ca2+ release (CICR) (4), and Ca2+-influx during action potentials (5).
Much less attention has focused on the slow periodic oscillations of [Ca2+]i that are observed when β-cells are exposed to steady state concentrations of glucose. The potential significance of these slow oscillations of [Ca2+]i becomes apparent when one recognizes that in the fasting state, large fluctuations in blood glucose are not normally observed due to the tight control of glucose homeostasis necessary to maintain normoglycemia. As it is possible that slow oscillations of [Ca2+]i play a significant or even dominant role as initiators of pulsatile insulin secretion during the fasting state, we have sought to define the mechanism by which glucose generates them.
To this end, we have monitored slow oscillations of [Ca2+]i in single rat β-cells and cells derived from a hamster insulinoma (HIT-T15) cell line (6). HIT-T15 cells are widely used as a model for β-cells because they retain the ability to respond to glucose. HIT cells do, however, respond at lower concentrations of glucose than normal β-cells. This concentration difference results from the expression of low affinity GLUT-2 glucose transporters in β-cells and both GLUT-2 and high affinity GLUT-1 transporters in HIT cells (7). Measurements of [Ca2+]i were obtained while simultaneously monitoring the resting membrane potential or while cells were voltage clamped using the perforated patch method, which maintains the integrity of [Ca2+]i buffering and intracellular signaling systems (8–10). We report that slow [Ca2+]i oscillations in β-cells and HIT-T15 cells are not associated with changes in membrane potential and do not appear to be triggered by Ca2+ influx through VDCCs. In contrast, we present findings that favor an important role for voltage-independent calcium channels (VICCs) as mediators of this type of oscillatory activity. We suggest that these slow oscillations in [Ca2+]i levels and concomitant pulses of insulin secretion may maintain the metabolic activity of β-cells and/or provide systemic tissues with small pulses of insulin so as to support glucose homeostasis during interprandial periods of normoglycemia.
Materials and Methods
Preparation of islet cell and insulinoma cell cultures
Male Sprague-Dawley rats (250–350 g) were anesthetized by ip injection of sodium pentobarbital. The pancreas was removed, and islets of Langerhans were isolated by hand picking after collagenase (type XI, Sigma Chemical Co., St. Louis, MO) digestion (11). Islets were dissociated into a single cell suspension by digestion with trypsin-EDTA and mechanical trituration through a 27-gauge stainless steel needle. The single cells were allowed to settle on glass coverslips that had been coated with 1 mg/ml Concanavalin-A (Sigma, type V). Coverslips with attached cells were placed in petri dishes containing RPMI-1640 containing 11.1 mM glucose and supplemented with 10% fetal bovine serum. HIT-T15 cells (passages 65–75) were obtained from the American Type Culture Collection (Rockville, MD) and grown on Concanavalin-A-coated coverslips bathed in Ham’s F-12 medium containing 10 mM glucose and supplemented with 10% horse serum and 2.5% fetal bovine serum. All culture media also contained penicillin-G (100 U/ml) and streptomycin (100 μg/ml). Cultures were maintained at 37 C in a 5% CO2 atmosphere incubator, and experiments were conducted 1–4 days postplating. β-Cells were selected for recording based on morphological criteria, as previously described (1). Briefly, cells 10–15 μm in diameter were considered β-cells, as these are considerably larger than the other cell types.
Fura-2 microspectrofluorimetry of [Ca2+]i
Cells were prepared for measurement of [Ca2+]i by incubating in external recording solution (see below) containing fura-2AM (Molecular Probes, Sunnyvale, CA). β-Cells were loaded with 0.5–1.0 μM fura-2AM for 0.5 h at room temperature (20–23 C), whereas HIT-T15 cells loaded less well and required 5 μM fura-2AM for 1.5 h at room temperature (see below). Glass coverslips with fura-2-loaded adherent cells formed the base of a recording chamber, which was maintained at 32 C by a Peltier temperature controller (Micro Devices, Inc., Jenkintown, PA) mounted on the stage of a Zeiss IM35 microscope (Zeiss, New York, NY) equipped with an Ionoptix Corp. (Milton, MA) dual excitation video imaging system. [Ca2+]i was estimated from the ratio of 510 nm emission fluorescences due to excitation by 350 nm and 380 nm wavelength light from the following equation (12): [Ca]i = Kd × β × [(R − Rmin)/(Rmax − R)], where Kd is the dissociation constant of fura-2 (225 nM), β is the ratio of 380 nm induced fluorescences of free/bound fura-2, R is the measured ratio of 350 nm/380 nm fluorescences, and Rmin and Rmax are 350 nm/380 nm fluorescence ratios in zero [Ca2+] and saturating [Ca2+], respectively.
Compartmentalization of fura-2
The degree of compartmentalization of fura-2 was assessed for HIT-T15 cells loaded at room temperature or 37 C. The fura-2 fluorescence after permeabilization of single cells with a 120-sec pulse (see below) of 10 μM digitonin as a ratio of the fluorescence before permeabilization was used to assess the extent to which fura-2 was compartmentalized into subcellular organelles. Cells were bathed in the following intracellular-type saline during these measurements: 140 mM KCl, 1.2 mM MgCl2, 1 mM EGTA (pH 7.4 with KOH), and 10 mM HEPES, pH 7.4, with NaOH. Using this method, the post/prepermeabilization fluorescence ratio for cells loaded at 37 C was 0.25 ± 0.02 (n = 19 cells), and that for cells loaded at room temperature was 0.09 ± 0.01 (n = 20 cells). In the subsequent experiments reported here, HIT-T15 cells were fura-2 loaded at room temperature.
Perforated patch-clamp recording conditions
Patch-clamp recordings were obtained from fura-2AM-loaded cells bathed in an external solution containing 138 mM NaCl, 5.6 mM KC1, 2.6 mM CaCl2, 1.2 mM MgCl2, and 20 mM HEPES (pH adjusted to 7.4 with NaOH; 295 mosmol). Glucose was added to this solution as specified in the text. The resting membrane potential of cells was measured under current clamp, or the cells were voltage clamped using the perforated patch (1, 8–10) configuration. Patch pipettes pulled from soft glass (Kimax-51, Kimble Glass, Inc., Vineland, NJ) were fire polished (final resistance, 3–6 megohms) and tip-dipped in 95 mM K2SO4, 7 mM MgCl2, and 5 mM HEPES-NaOH (pH 7.4), then back filled with the same solution containing nystatin (240 μg/ml). The patch pipette was connected to an EPC-9 (Heka Electronics, Lambrecht, Germany) patch-clamp amplifier, and the access resistance (15–30 megohms) and whole cell capacitance (5–15 picofarads) were monitored after seal formation. In voltage-clamp experiments, the series resistance was compensated for by at least 60%. The pipette solution did not contain fura-2 and was nominally Ca2+ free. A sudden rise in [Ca2+]i and simultaneous decrease in fluorescence intensity provided a useful marker for seal breakdown or rupture of the cell membrane during an experiment.
Application of test substances
A stepwise increase in the concentration of glucose in the bathing solution was achieved by a rapid superfusion system (equilibration time, 1 min). GLP-1, caffeine, thapsigargin, and econazole were applied directly to individual cells by pneumatic pressure ejection from blunt-tipped puffer pipettes, as described previously (1).
Results
Slow oscillations of [Ca2+]i recorded from rat β-cells and HIT-T15 cells
Rat pancreatic β-cells were bathed in saline containing 7.5 mM glucose. This concentration is within the range of 5–8 mM, and more than 7 mM glucose reported as the threshold for insulin secretion in rat or mouse β-cells (13). Under these conditions, [Ca2+]i in the majority of cells (n = 79 of 100 cells) was stable (mean ± SEM, 120 ± 30 nM), with no oscillations of [Ca2+]i observed during the standard 20-min recording session. In contrast, 21% of the cells (n = 21 of 100) exhibited slow oscillations of [Ca2+]i (Fig. 1A). These oscillations were typically 200–300 nM in amplitude, were not superimposed on an underlying shift in the baseline [Ca2+]i, and had a mean periodicity of 4.2 ± 0.3 min (n = 21), a frequency similar to that observed in whole rat islets (4.6 ± 0.2 min) (14), but somewhat slower than that observed in mouse islets under steady state (15 mM) glucose concentrations (15). Slow oscillations were also observed when β-cells were equilibrated in 5 mM glucose (data not shown). Higher concentrations of glucose (10–20 mM) were not examined in detail due to the appearance of fast irregular oscillations associated with electrical bursting activity. HIT-T15 insulinoma cells also exhibited slow oscillations of [Ca2+]i, but at concentrations of glucose (2 mM) lower than that required for β-cells (Figs. 1A and 3A). [Ca2+]i oscillations were not observed when β-cells or HIT-T15 cells were equilibrated in a solution to which no glucose was added.
Fig. 1.

Representative examples of glucose and insulinotropic peptide-induced alterations of [Ca]i in β-cells. A, Slow oscillations of [Ca2+]i recorded when a β-cell was equilibrated in a steady state concentration (7.5 mM) of glucose. B, A β-cell was initially equilibrated in 5 mM glucose, then a stepwise increase in glucose concentration to 15 mM was applied by rapidly switching the contents of the bathing solution. C, A 30-sec pulse of 10 nM GLP-1-(7-37) was directly applied to a cell bathed in 5 mM glucose, using a puffer pipette (see Materials and Methods).
Fig. 3.
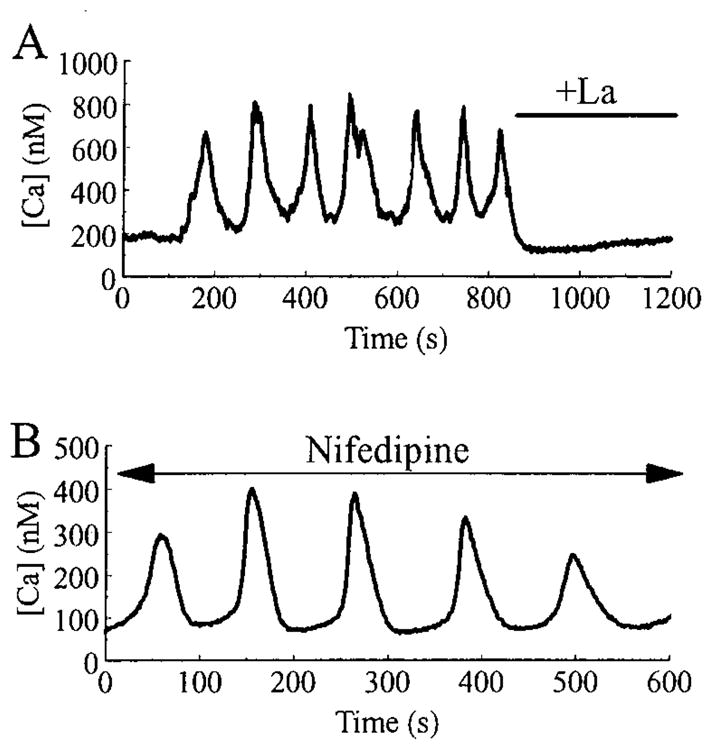
Slow oscillations of [Ca2+]i are blocked by La3+, but not by nifedipine. In A, slow [Ca2+]i oscillations were recorded from a HIT-T15 cell bathed in a solution containing 2 mM glucose and 2.6 mM Ca2+. Note that the oscillations were rapidly blocked by superfusion with an identical saline solution to which 500 μM La3+ was added. In B, slow [Ca2+]i oscillations recorded from a HIT-T15 cell bathed in 2 mM glucose and 2.6 mM Ca2+ were unaffected by the addition of 5 μM nifedipine to the superfusate.
The pattern of slow oscillatory activity observed under steady state glucose concentrations differed from that observed when the extracellular glucose concentration was raised in a stepwise fashion from an initial value of 5 mM to a final value (15 mM) that is nearly saturating for stimulation of insulin secretion (13). In about 30% of cells tested, such a rise in glucose concentration produced a rise in [Ca2+]i (Fig. 1B) on which a series of smaller amplitude, fast oscillations were observed (n = 5), similar to those reported in whole mouse islets after a shift from 2 to 20 mM glucose (14). These findings suggested a fundamental difference in the mechanism by which steady state and stepwise changes in glucose concentration regulate [Ca2+]i.
A stepwise change in glucose concentration from 5 to 15 mM is known to raise [Ca2+]i by shifting the resting membrane potential to less negative values, thereby opening dihydropyridine-sensitive (L-type) VDCCs (16). Membrane depolarization can also be achieved by treatment of β-cells with the insulinotropic hormone GLP-1-(7–37) (1). GLP-1-(7–37) increased [Ca2+]i in a biphasic manner (n = 5), but did not induce the slow oscillations of [Ca2+]i characteristic of cells equilibrated in a steady state concentration of glucose (Fig. 1C). Therefore, it appeared that the slow oscillatory activity might be independent of changes in membrane potential and not dependent on calcium entry through VDCCs.
A role for VICCS as mediators of slow [Ca2+]i oscillations
To more directly assess the role calcium channels might play in the generation of slow [Ca2+]i oscillations, we examined the extracellular Ca2+ dependence of this type of activity. The slow oscillations recorded from a β-cell equilibrated in 7.5 mM glucose were rapidly and reversibly abolished in all cells tested (n = 3) by switching the superfusate to a nominally Ca2+-free solution (Fig. 2), as expected if the oscillations are maintained by calcium influx through plasma membrane-associated calcium channels. Similar results were obtained with HIT-T15 cells. These [Ca2+]i oscillations appeared identical in both β-cells and HIT cells, and the majority of subsequent experiments were performed only on HIT cells. Slow [Ca2+]i oscillations in HIT-T15 cells were blocked by extracellular application of 100–500 μM La3+ (Fig. 3A), a competitive blocker of both VDCCs and VICCs. To test for a possible role of L-type VDCCs as mediators of slow [Ca2+]i oscillations, HIT-T15 cells were pretreated with 5 μM of the L-type VDCC blocker nifedipine. Nifedipine failed to block the slow oscillations of [Ca2+]i (Fig. 3B), indicating that L-type channels are unlikely to mediate this form of oscillatory activity. In contrast, we confirmed that in rat β-cells, the fast oscillations of [Ca2+]i evoked by a stepwise change in glucose concentration from 5 to 15 mM are markedly diminished by pretreatment with nifedipine (n = 5 cells; data not shown).
Fig. 2.
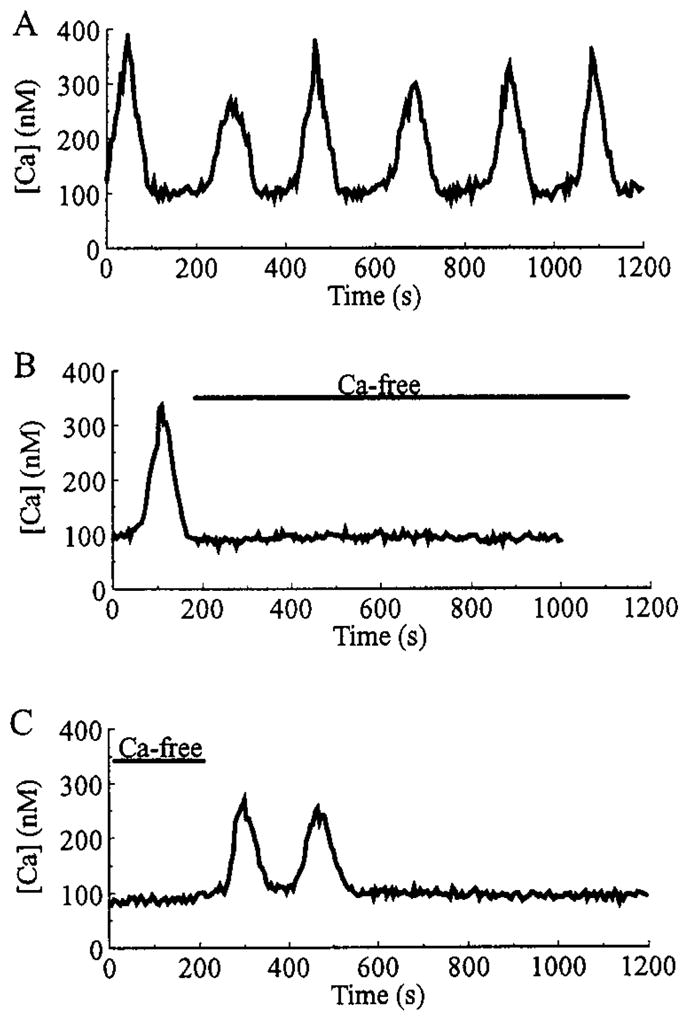
Slow oscillations of [Ca2+]i require extracellular Ca2+. A, A β-cell exhibited slow oscillations of [Ca2+]i when the bath solution contained a normal concentration (2.6 mM) of Ca2+. As illustrated in B, when the superfusate was switched to a nominally Ca2+-free saline (as indicated by the bar), the oscillations were abolished. As illustrated in C, reintroduction of 2.6 mM Ca2+ briefly restored the slow oscillatory activity. All recordings are from the same cell under conditions of steady state equilibration in 7.5 mM glucose. Records A and B are separated by a 350-sec interval, whereas records B and C are separated by a 200-sec interval.
So as to more accurately characterize the subtype(s) of the non-L-type calcium channel(s) involved in the initiation of slow oscillations, measurements of [Ca2+]i were obtained while simultaneously current or voltage clamping the cells. As shown in Fig. 4A {top trace), the resting membrane potential of a HIT-T15 cell remained nearly constant (about −60 mV) during all phases of the [Ca2+]i oscillation cycle (Fig. 4A, bottom trace). Further, [Ca2+]i oscillations continued if the membrane potential was held under voltage clamp at −70 mV (Fig. 4B), negative to the activation threshold of L-type (fast deactivating) and T-type (slow deactivating non-dihydropyridine-sensitive) VDCCs in HIT-T15 (17) and rat β-cells (18). To confirm that electrical access to the cell was intact, depolarizing voltage clamp steps from −70 to 0 mV were applied to open VDCCs, resulting in a large increase in [Ca2+]i (Fig. 4B). Although these findings suggested that slow oscillations of [Ca2+]i were independent of VDCC activity, it remained possible that a periodic shift of the activation threshold for L- or T-type channels to more negative potentials might contribute to the oscillatory activity. This appears to be highly unlikely given that pretreatment of HIT-T15 cells with 5 μM nifedipine failed to block the slow oscillatory activity (Fig. 3B), whereas the depolarization-induced rise in [Ca2+]i observed under voltage clamp was completely abolished (n = 5 cells; data not shown).
Fig. 4.

Slow oscillations of [Ca2+]i are independent of changes in membrane potential. In A and B are illustrated perforated patch recordings from the same fura-2AM-loaded HIT-T15 cell equilibrated in 2 mM glucose. As indicated in A, [Ca2+]i (lower trace, left side scale) and the resting membrane potential (Em; upper trace, right side scale) were simultaneously monitored in the current clamp recording configuration. Little or no change in membrane potential was observed during the [Ca2+]i oscillations. As illustrated in B, the cell was then voltage clamped to a holding potential of −70 mV. At this holding potential, the slow oscillations were not blocked (note different scales for [Ca2+]i in A and B). Application of a depolarizing voltage step to 0 mV induced a large rise in [Ca2+]i due to the opening of VDCCs, thereby confirming that electrical access to the cell was intact. Similar results were obtained with rat β-cells.
A steady state inward calcium current may generate slow oscillations of [Ca2+]i
Taken together, these findings indicate that the slow oscillations of [Ca2+]i are dependent on calcium influx through VICCs. Such a mechanism implies that β-cells exhibit a significant resting membrane permeability to Ca2+ that is glucose dependent and membrane potential independent. As an indirect test of this hypothesis, we examined the effects of extracellular Mn2+ (substituted for Ca2+) on HIT-T15 cells loaded with fura-2AM and equilibrated in a steady state concentration (2 mM) of glucose. Mn2+ has previously been reported to permeate some types of VICCs (but not VDCCs), and the consequence of such a transmembrane flux of Mn2+ is the rapid quenching of intracellular fura-2 fluorescence (19). Extracellular application of Mn2+ (but not La3+) resulted in quenching of the fura-2 signal (Fig. 5A), suggesting the presence of active VICCs that are permeant to Mn2+ and blocked by La3+. To test this possibility, the resting membrane conductance of voltage-clamped HIT-T15 cells was measured, and the effects of extracellular La3+ tested. As shown in Fig. 5B, La3+ decreased the resting membrane conductance under conditions of steady state glucose equilibration. The decreased membrane conductance was accompanied by an outward shift in the holding current, as expected if La+3 blocks a steady state inward current that is active at a holding potential (−80 mV) close to the resting potential. This finding indicated that the demonstrated ability of La3+ to block slow [Ca2+]i oscillations (Fig. 3A) most likely resulted from its ability to competitively block the entry of Ca2+ through VICCs that are glucose regulated.
Fig. 5.
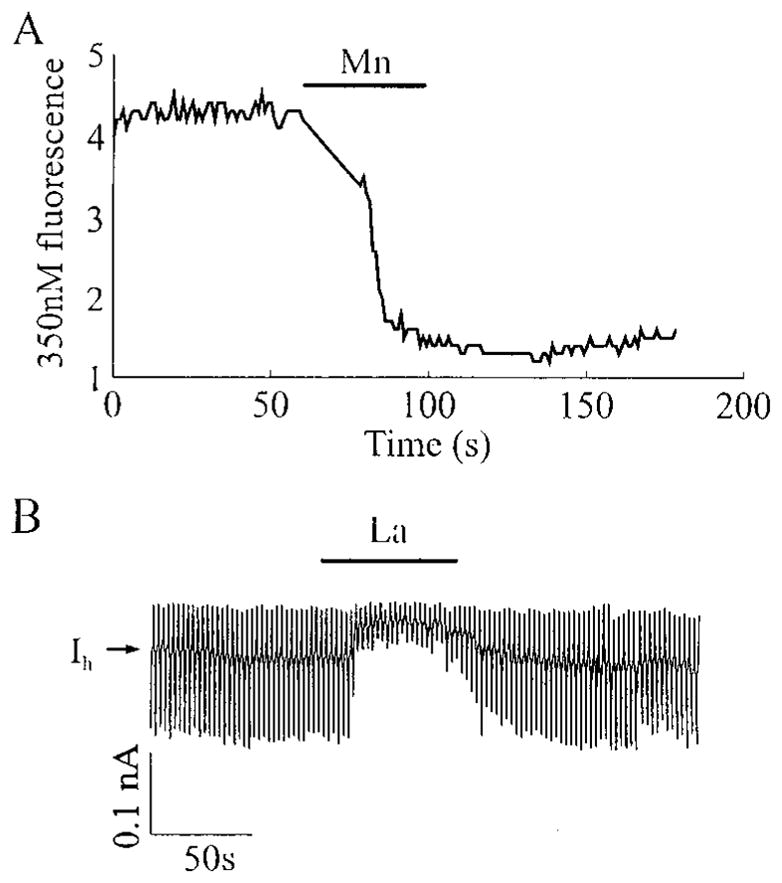
HIT-T15 cells equilibrated in 2 mM glucose exhibit a pathway for divalent cation influx that is permeant to Mn2+, but blocked by La3+. In A is illustrated quenching of the intracellular fura-2 fluorescence signal by 2.6 mM Mn2+ applied extracellularly from a puffer pipette (Ca2+ was omitted from the Mn2+-containing solution). Fura-2 was excited at 350 nm, and the fluorescence emmision was measured at 510 nm. In B is illustrated a voltage-clamp experiment in which the resting membrane conductance was monitored by applying ±10 mV voltage steps (each for 1 sec) from a holding potential of −80 mV. La3+ (100 μM), applied extracellularly from a puffer pipette, caused a reduction in membrane conductance (as indicated by the smaller current responses to applied voltage steps) and a shift in the holding current (IH) in the outward direction.
Possible role for CICR and Ca2+ release-activated Ca2+ channels (ICRAC) in the generation of slow [Ca2+]i oscillations
The entry of Ca2+ through VICCs might serve to generate slow Ca2+ oscillations by triggering CICR, a process that is mimicked by extracellular application of caffeine, a sensitizer of the ryanodine receptor/Ca2+ release channel (4, 20). To test for a role of intracellular Ca2+ stores in the generation of slow Ca2+ oscillations, caffeine was applied to quiescent β-cells bathed in 7.5 mM glucose. Caffeine at a concentration of 10 mM also evoked slow oscillations of [Ca2+]i (Fig. 6A; n = 10). These oscillations were not superimposed on a shift in the baseline [Ca2+]i, and their periodicity resembled that observed in spontaneously active cells equilibrated in steady state concentrations of glucose. Caffeine is known to increase the sensitivity of ryanodine receptors/Ca2+ release channels to intracellular Ca2+ and to enhance CICR. The response of β-cells to caffeine, therefore, is consistent with an important role for CICR in the generation of slow [Ca2+]i oscillations that are triggered by a glucose-dependent Ca2+ influx mechanism.
Fig. 6.

Evidence for a ICRAC. In A, a rat β-cell, equilibrated in 7.5 mM glucose, responded to a single 60-sec application of caffeine (caff.; 10 mM) with a series of slow oscillations of [Ca2+]i. In B, a HIT-T15 cell equilibrated in 2 mM glucose was stimulated with 2 μM thapsigargin (TG), causing a rise in [Ca2+]i, detected as a small increase in the intensity of fluorescence due to excitation of fura-2 at 350 nm. A subsequent application of 2.6 mM Mn2+ (substituted for Ca2+) caused quenching of the fluorescence signal in six of seven cells, indicating activation of a Mn2+-permeant conductance by thapsigargin. No quenching by Mn2+ was observed before application of thapsigargin. In C, a HIT-T15 cell equilibrated in 2 mM glucose was treated with 2.6 mM Mn2+ before and after stimulation with 10 μM econazole (EC). Mn2+-induced quenching of the fura-2 fluorescence was not increased after treatment with econazole (n = 7). Note that econazole caused a rise in [Ca2+]i, measurable as an increase in the intensity of fura-2 fluorescence.
The exact nature of the VICCs that allow Ca2+ influx has yet to be determined. Mn2+ quenching of the fura-2 signal, as reported here, could arise from influx of Mn2+ through G-type channels (21) in the plasma membrane, which would normally serve to generate a steady state inward Ca2+ current at a fixed bathing glucose concentration. A second possibility is that Mn2+ enters through a ICRAC (22) that is regulated by a calcium influx factor (CIF) and/or by direct protein-protein interaction (23). Although ICRAC channels are reportedly Mn2+ permeant in some cell types (19), an ICRAC current has not yet been reported in insulinoma or β-cells. To indirectly test for the presence of such a current in HIT-T15 cells, we treated quiescent cells with 2 μM thapsigargin, an inhibitor of ATP-dependent calcium pumps (24). Thapsigargin inhibits intracellular sequestration of Ca2+, thereby causing a rise in free cytosolic Ca2+ that is detectable as an increase in the 350 nm fura-2 fluorescence intensity. After stimulation by thapsigargin, the 350 nm fluorescence intensity increased, indicating the release of intracellular calcium stores (Fig. 6B). Under these conditions, cells that were initially unaffected by Mn2+ now displayed Mn2+ quenching, suggesting the activation of ICRAC by an as yet to be characterized CIF. To more directly test whether the thapsigargin-induced Mn2+ quenching might be due to activation of ICRAC, cells were stimulated with 10 μM econazole. Econazole inhibits cytochrome P-450 and increases free cytosolic [Ca2+]i by depleting intracellular Ca2+ stores, but, unlike thapsigargin, it is believed to block activation of ICRAC (25, 26). Stimulation of HIT-T15 cells (n = 7 cells) with econazole resulted in a rise of [Ca2+]i, but in these cells, Mn2+ quenching was not observed (Fig. 6C), as expected if the entry of Mn2+ occurs via VICCs of the ICRAC subtype. These results suggest that an ICRAC-type current is present in HIT-T15 cells and may contribute to the replenishment of intracellular Ca2+ stores during oscillations.
Discussion
The [Ca2+]i oscillations described here most closely resemble the slow (0.2–0.3 min−1) oscillations reported in rat (13) and mouse (14, 27) islets under conditions of steady state glucose concentration. Oscillations of [Ca2+]i have also been reported in single mouse (28–30) and rat (31, 32) β-cells, but the relationship of these oscillations to changes in membrane potential have not been fully assessed. Fast [Ca2+]i oscillations in whole mouse islets and single rat β-cells appear to be generated by β-cell electrical bursting or spiking activity (27, 32), and are induced by stepwise changes in glucose concentration that trigger membrane depolarization and Ca2+ influx via VDCCs. In marked contrast, we demonstrate by simultaneous recordings of membrane potential and [Ca2+]i that slow [Ca2+]i oscillations are observed under steady state concentrations of glucose and occur in the absence of membrane depolarization. We have also demonstrated that these slow oscillations are dependent on extracellular Ca2+ and show that they can be blocked by La3+, but not by the L-type Ca2+ channel blocker, nifedipine. These findings indicate that slow [Ca2+]i oscillations are not dependent on VDCCs, but are instead dependent on VICCs.
Rat islets show oscillations in O2 consumption and insulin secretion with a similar frequency to slow [Ca2+]i oscillations (13, 14); therefore, it is possible that pulsatile insulin secretion is driven by metabolic oscillations that are glucose dependent and that regulate the free cytosolic Ca2+ concentration through influences on calcium influx and/or CICR. A metabolically regulated Ca2+ channel with low voltage dependence was recently described in human β-cells (21). These G-type VICCs have also been described in bovine chromaffin cells, where they were shown to be activated by pertussis toxin (33). Although G-type Ca2+ channels have not been directly recorded in rat β-cells, the dependence of slow [Ca2+]i oscillations on glucose metabolism and extracellular Ca2+ may be explained by the influx of Ca2+ through such a channel. Because the experiments reported here were performed at a fixed bath glucose concentration, the inward current through the G-channel might be expected to be constant. This is consistent with our observation that the membrane potential and membrane current did not change detectably during slow [Ca2+]i oscillations, whereas La3+ decreased the steady state membrane conductance and shifted the holding current in the outward direction.
Using Mn2+ quenching of fura-2 fluorescence as an indicator, we have also shown the presence in HIT-T15 cells of a divalent cation entry pathway activated by depletion of Ca2+ stores with thapsigargin, and sensitive to econazole. These pharmacological properties are as expected if the divalent cation entry is mediated by a ICRAC. ICRAC calcium currents activated by thapsigargin have been recorded in rat mast cells (22), but under the experimental conditions of this study, these currents would be expected to be too small to be reliably resolved.
Although we have not begun to fully explore the biophysical properties of the glucose-regulated VICCs, our findings suggest a dual mechanism of action by which slow oscillations of [Ca2+]i are generated by Ca2+ influx through both G-type and ICRAC-type channels. The G-type channel is proposed to provide the necessary means by which transmembrane Ca2+ influx triggers CICR, possibly acting through ryanodine receptor/Ca2+ release channels located in the endoplasmic reticulum. In contrast, ICRAC-type channels are proposed to provide the entry path for Ca2+ influx that is directed to refilling calcium stores (capacitative calcium entry mechanism). The combination of Ca2+ influx via G-type channels and the resultant CICR would generate the rising phase of the oscillations, whereas influx via ICRAC-type channels would play a role in refilling intracellular Ca2+ stores. A combination of Ca2+ uptake by intracellular stores and extrusion across the plasma membrane would result in the falling phase of these oscillations. It has been shown in mouse pancreatic acinar cells that after a cytosolic Ca2+ spike, an average 39% of the total mobilizable cellular Ca2+ pool is extruded (34). The proportions of cytosolic Ca2+ removed by uptake or extrusion are not known for β-cells or HIT-T15 cells; however, stimulation of HIT-T15 cells with thapsigargin, which elevates intracellular [Ca2+]i, does cause an increased efflux of Ca2+ from these cells (Leech, C. A., and P. J. S. Smith, unpublished observations).
At the metabolic level, the glucose signaling system that mediates slow oscillations of [Ca2+]i appears to be quite distinct from that which mediates fast oscillations of [Ca2+]i observed during stepwise shifts in glucose concentration. The fundamental features of these two glucose signaling systems are summarized in Fig. 7. In Fig. 7A is illustrated the conventional signaling system involving VDCCs (12, 16), which comes into play during stepwise shifts in the glucose concentration. This signaling system is likely to trigger Ca2+-dependent insulin secretion during the transition from fasting to feeding states. In Fig. 7B is illustrated the herein proposed nonconventional signaling system that uses VICCs and may play a dominant role to maintain insulin secretion under conditions of steady state glucose concentration, as occurs during the fasting normoglycemic state. Both signaling systems require glucose metabolism, but differ in that the conventional pathway uses ATP generated by aerobic glycolysis, whereas the nonconventional pathway uses a yet to be characterized metabolite(s), possibly including cyclic ADP-ribose (35, 36).
Fig. 7.
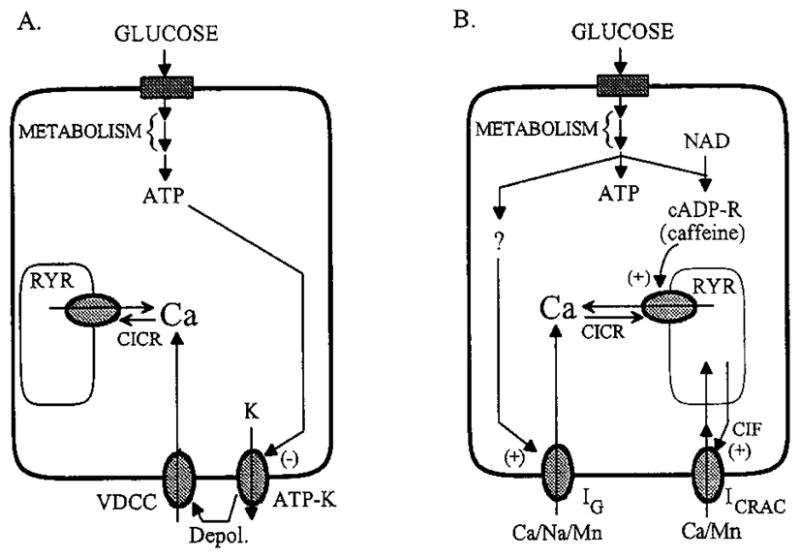
A, Glucose-signaling pathways that may mediate the rise in [Ca2+]i observed after a stepwise increase in glucose concentration. The uptake and metabolism of glucose generate ATP, which acts to depolarize (depol.) β-cells by inhibiting ATP-sensitive potassium channels (ATP-K) that regulate the resting membrane potential. Membrane depolarization leads to the activation of VDCC. Influx of Ca2+ through these channels causes the elevation of cytosolic [Ca2+], which also triggers CICR through activation of the ryanodine receptor/calcium release channels (RYR). B, For a cell equilibrated in a fixed concentration of glucose below the threshold for initiation of electrical bursting, metabolism of glucose may generate multiple signals. These are proposed to include ATP, cyclic ADP-ribose (cADP-R) generated from nicotinamide adenine dinucleotide (NAD), and an as yet to be characterized metabolite (?) that activates the G-type channel (IG). Influx of Ca2+ through the G-channel raises [Ca2+]i until it reaches a level that stimulates CICR. Sensitization of the ryanodine receptors to Ca2+ may result from the action of cADP-R on them (37). Release of Ca2+ from intracellular stores and subsequent depletion of the stores leads to activation of a ICRAC by a CIF or a small mol wt G-protein (23). Further elevation of [Ca2+]i then inhibits release from the stores, and a combination of Ca2+ extrusion from the cell and reuptake by the stores brings [Ca2+]i back to basal levels.
It is important to emphasize that the slow [Ca2+]i oscillations described here depend on glucose concentrations in the normoglycemic range, such as occurs during the fasting state. The mechanisms regulating the oscillations in [Ca2+]i are entirely different from the abrupt sustained rise in [Ca2+]i due to the opening of VDCCs in response to elevations of blood glucose and intestinal insulinotropic peptides during feeding. The oscillations of [Ca2+]i observed in constant normoglycemic glucose concentrations originate from the pulsatile mobilization of Ca2+ from intracellular stores triggered by a constant influx of extracellular Ca2+.
In conclusion, we propose that these glucose-requiring spontaneous oscillations in [Ca2+]i and insulin secretion are of physiological significance during periods of interprandial normoglycemia and serve to maintain the metabolic activity of the β-cell and/or provide small pulses of insulin to the peripheral insulin-sensitive tissues so as to maintain glucose homeostasis during fasting.
Footnotes
This work was supported by NIH Grants DK-30834, DK-30457 (to J.F.H.), and DK-45817 (to G.G.H.).
References
- 1.Holz GG, IV, Kuhtreiber WM, Habener JF. Pancreatic β-cells are rendered glucose competent by the insulinotropic hormone GLP-1(7–37) Nature. 1993;361:362–365. doi: 10.1038/361362a0. [DOI] [PMC free article] [PubMed] [Google Scholar]
- 2.Corkey BE, Deeney JT, Glennon MC, Matschinsky FM, Prentki M. Regulation of steady-state free Ca2+ levels by the ATP/ADP ratio and orthophosphate in permeabilized RINm5F cells. J Biol Chem. 1988;263:4247–4253. [PubMed] [Google Scholar]
- 3.Woods NM, Cuthbertson KSR, Cobbold PH. Repetitive transient rises in cytoplasmic free calcium in hormone-stimulated hepatocytes. Nature. 1986;319:600–602. doi: 10.1038/319600a0. [DOI] [PubMed] [Google Scholar]
- 4.Berridge MJ. Inositol trisphosphate and calcium signalling. Nature. 1993;361:315–325. doi: 10.1038/361315a0. [DOI] [PubMed] [Google Scholar]
- 5.Schlegal W, Winiger BP, Mollard P, Vacher P, Wuarin F, Zahnd GR, Wollheim CB, Dufy B. Oscillations of cytosolic Ca2+ in pituitary cells due to action potentials. Nature. 1987;329:719–721. doi: 10.1038/329719a0. [DOI] [PubMed] [Google Scholar]
- 6.Santerre RF, Cook RA, Crisel RMD, Shar JD, Schmit RJ, Williams DC, Wilson CP. Insulin synthesis in a clonal cell line of simian virus transformed hamster pancreatic β-cells. Proc Natl Acad Sci USA. 1981;78:4339–4343. doi: 10.1073/pnas.78.7.4339. [DOI] [PMC free article] [PubMed] [Google Scholar]
- 7.Inagaki N, Yasuda K, Inoue G, Okamoto Y, Yano H, Someya Y, Ohmoto Y, Deguchi K, Imagawa K-I, Imura H, Seino Y. Glucose as regulator of glucose transport activity and glucose-transporter mRNA in hamster β-cell line. Diabetes. 1992;41:592–597. doi: 10.2337/diab.41.5.592. [DOI] [PubMed] [Google Scholar]
- 8.Horn R, Marty A. Muscarinic activation of ionic currents by a new whole-cell recording method. J Gen Physiol. 1988;92:145–159. doi: 10.1085/jgp.92.2.145. [DOI] [PMC free article] [PubMed] [Google Scholar]
- 9.Leech CA, Holz GG. Application of patch clamp methods to the study of calcium currents and calcium channels. Methods Cell Biol. 1994;40:135–151. doi: 10.1016/s0091-679x(08)61113-9. [DOI] [PMC free article] [PubMed] [Google Scholar]
- 10.Sala S, Parsey RV, Cohen AS, Matteson DR. Analysis and use of the perforated patch technique for recording ionic currents in pancreatic β-cells. J Membr Biol. 1991;122:177–187. doi: 10.1007/BF01872640. [DOI] [PubMed] [Google Scholar]
- 11.McDaniel ML, Colca J, Kotogal N, Lacy P. A subcellular fractionation approach for studying insulin release mechanisms and calcium metabolism in islets of Langerhans. Methods Enzymol. 1983;98:182–200. doi: 10.1016/0076-6879(83)98149-1. [DOI] [PubMed] [Google Scholar]
- 12.Grynkiewicz G, Poenie M, Tsien RY. A new generation of Ca2+ indicators with greatly improved fluorescence properties. J Biol Chem. 1985;260:3440–3450. [PubMed] [Google Scholar]
- 13.Ashcroft FM, Rorsman P. Electrophysiology of the pancreatic β-cell. Prog Biophys Mol Biol. 1991;54:87–143. doi: 10.1016/0079-6107(89)90013-8. [DOI] [PubMed] [Google Scholar]
- 14.Longo EA, Tornheim K, Deeney JT, Varnum BA, Tillotson D, Prentki M, Corkey BE. Oscillations in cytosolic free Ca2+, oxygen consumption, and insulin secretion in glucose-stimulated rat pancreatic islets. J Biol Chem. 1991;266:9314–9319. [PubMed] [Google Scholar]
- 15.Gilon P, Shepherd RM, Henquin J-C. Oscillations of secretion driven by oscillations of cytoplasmic Ca2+ as evidenced in single pancreatic islets. J Biol Chem. 1993;268:22265–22268. [PubMed] [Google Scholar]
- 16.Rajan AS, Aguilar-Bryan L, Nelson DA, Yaney GC, Hsu WH, Kunze DL, Boyd AE., III Ion channels and insulin secretion. Diabetes Care. 1990;13:340–363. doi: 10.2337/diacare.13.3.340. [DOI] [PubMed] [Google Scholar]
- 17.Satin LS, Cook DL. Evidence for two calcium currents in insulin-secreting cells. Pfluegers Arch. 1988;411:401–409. doi: 10.1007/BF00587719. [DOI] [PubMed] [Google Scholar]
- 18.Hiriart M, Matteson DR. Na channels and two types of Ca channels in rat pancreatic B cells identified with the reverse hemolytic plaque assay. J Gen Physiol. 1988;91:617–639. doi: 10.1085/jgp.91.5.617. [DOI] [PMC free article] [PubMed] [Google Scholar]
- 19.Sage SO, Merritt JE, Hallam TJ, Rink TJ. Receptor-mediated calcium entry in fura-2-loaded platelets stimulated with ADP and thrombin. Biochem J. 1989;258:923–926. doi: 10.1042/bj2580923. [DOI] [PMC free article] [PubMed] [Google Scholar]
- 20.McPherson PS, Campbell KP. The ryanodine receptor/Ca2+ release channel. J Biol Chem. 1993;268:13765–13768. [PubMed] [Google Scholar]
- 21.Rojas E, Hidalgo J, Carroll PB, Li MX, Atwater I. A new class of calcium channels activated by glucose in human pancreatic β-cells. FEBS Lett. 1990;261:265–270. doi: 10.1016/0014-5793(90)80568-4. [DOI] [PubMed] [Google Scholar]
- 22.Hoth M, Penner R. Depletion of intracellular calcium stores activates a calcium current in mast cells. Nature. 1992;355:353–356. doi: 10.1038/355353a0. [DOI] [PubMed] [Google Scholar]
- 23.Putney JW, Bird GStJ. The signal for capacitative calcium entry. Cell. 1993;75:199–201. doi: 10.1016/0092-8674(93)80061-i. [DOI] [PubMed] [Google Scholar]
- 24.Inesi G, Sagara Y. Thapsigargin, a high affinity and global inhibitor of intracellular Ca2+ transport ATPases. Arch Biochem Biophys. 1992;298:313–317. doi: 10.1016/0003-9861(92)90416-t. [DOI] [PubMed] [Google Scholar]
- 25.Alvarez J, Montero M, Garcia-Sancho J. Cytochrome P-450 may link intracellular Ca2+ stores with plasma membrane Ca2+ influx. Biochem J. 1991;274:193–197. doi: 10.1042/bj2740193. [DOI] [PMC free article] [PubMed] [Google Scholar]
- 26.Mason MJ, Mayer B, Hymel LJ. Inhibition of Ca2+ transport pathways in thymic lymphocytes by econazole, miconazole, and SKF 96365. Am J Physiol. 1993;264:C654–C662. doi: 10.1152/ajpcell.1993.264.3.C654. [DOI] [PubMed] [Google Scholar]
- 27.Valdeolmillos M, Santos RM, Contreras D, Soria B, Rosario LM. Glucose-induced oscillations of intracellular Ca2+ concentration resembling bursting electrical activity in single mouse islets of Langerhans. FEBS Lett. 1989;259:19–23. doi: 10.1016/0014-5793(89)81484-x. [DOI] [PubMed] [Google Scholar]
- 28.Grapengeisser E, Gylfe E, Hellman B. Glucose-induced oscillations of cytoplasmic Ca2+ in the pancreatic β-cell. Biochem Biophys Res Commun. 1988;151:1299–1304. doi: 10.1016/s0006-291x(88)80503-5. [DOI] [PubMed] [Google Scholar]
- 29.Grapengeisser E, Gylfe E, Hellman B. Sulfonylurea mimics the effect of glucose in inducing large amplitude oscillations of cytoplasmic Ca2+ in pancreatic β-cells. Mol Pharmacol. 1990;37:461–467. [PubMed] [Google Scholar]
- 30.Gylfe E, Grapengeisser E, Hellman B. Propagation of cytoplasmic Ca2+ oscillations in clusters of pancreatic β-cells exposed to glucose. Cell Calcium. 1991;12:229–240. doi: 10.1016/0143-4160(91)90023-8. [DOI] [PubMed] [Google Scholar]
- 31.Herchuelz A, Pochet R, Pastiels Ch VanPraet A. Heterogeneous changes in [Ca2+]i induced by glucose, tolbutamide and K+ in single rat pancreatic B cells. Cell Calcium. 1991;12:577–586. doi: 10.1016/0143-4160(91)90076-q. [DOI] [PubMed] [Google Scholar]
- 32.Theler J-M, Mollard P, Guerineau N, Vacher P, Pralong WF, Schlegel W, Wollheim CB. Video imaging of cytosolic Ca2+ in pancreatic β-cells stimulated by glucose, carbachol, and ATP. J Biol Chem. 1992;267:18110–18117. [PubMed] [Google Scholar]
- 33.Cena V, Brocklehurst KW, Pollard HB, Rojas E. Pertussis toxin stimulation of catecholamine release from adrenal medullary chromaffin cells: mechanism may be by direct activation of L-type and G-type calcium channels. J Membr Biol. 1991;122:23–31. doi: 10.1007/BF01872736. [DOI] [PubMed] [Google Scholar]
- 34.Tepikin AV, Voronina SG, Gallacher DV, Petersen OH. Pulsatile Ca2+ extrusion from single pancreatic acinar cells during receptor-activated cytosolic Ca2+ spiking. J Biol Chem. 1992;267:1407314076. [PubMed] [Google Scholar]
- 35.Galione A. Cyclic ADP-ribose: a new way to control calcium. Science. 1993;259:325–326. doi: 10.1126/science.8380506. [DOI] [PubMed] [Google Scholar]
- 36.Islam MdS, Larsson O, Berggren P-O. Cyclic ADP-ribose in β-cells. Science. 1993;262:584–585. doi: 10.1126/science.8211188. [DOI] [PubMed] [Google Scholar]
- 37.Meszaros LG, Bak J, Chu A. Cyclic ADP-ribose as an endogenous regulator of the non-skeletal type ryanodine receptor Ca2+ channel. Nature. 1993;364:76–79. doi: 10.1038/364076a0. [DOI] [PubMed] [Google Scholar]